Self-Host in One Command, Jinja2 Prompts, and Polish Across Evals and Observability
Self-host Future AGI in one command with pre-built images and a Windows installer. Prompts now support Jinja2 alongside Mustache. Plus reliable access to voice recordings, annotation and eval scores exported alongside traces into datasets, a Request Explorer in the AI gateway, nested JSON access in eval variables, faster session lists, and a long list of polish across Observe and evals.
Self-Host Future AGI in One Command
Self-hosting Future AGI is one script: clone the repo, run `bin/install`, log in. The script pulls pre-built service images from Docker Hub, brings the stack up in about 30 seconds, and works on macOS, Linux, and Windows (through Git Bash, WSL, or a new native PowerShell installer). The first account is created from the command line, with no email server required.
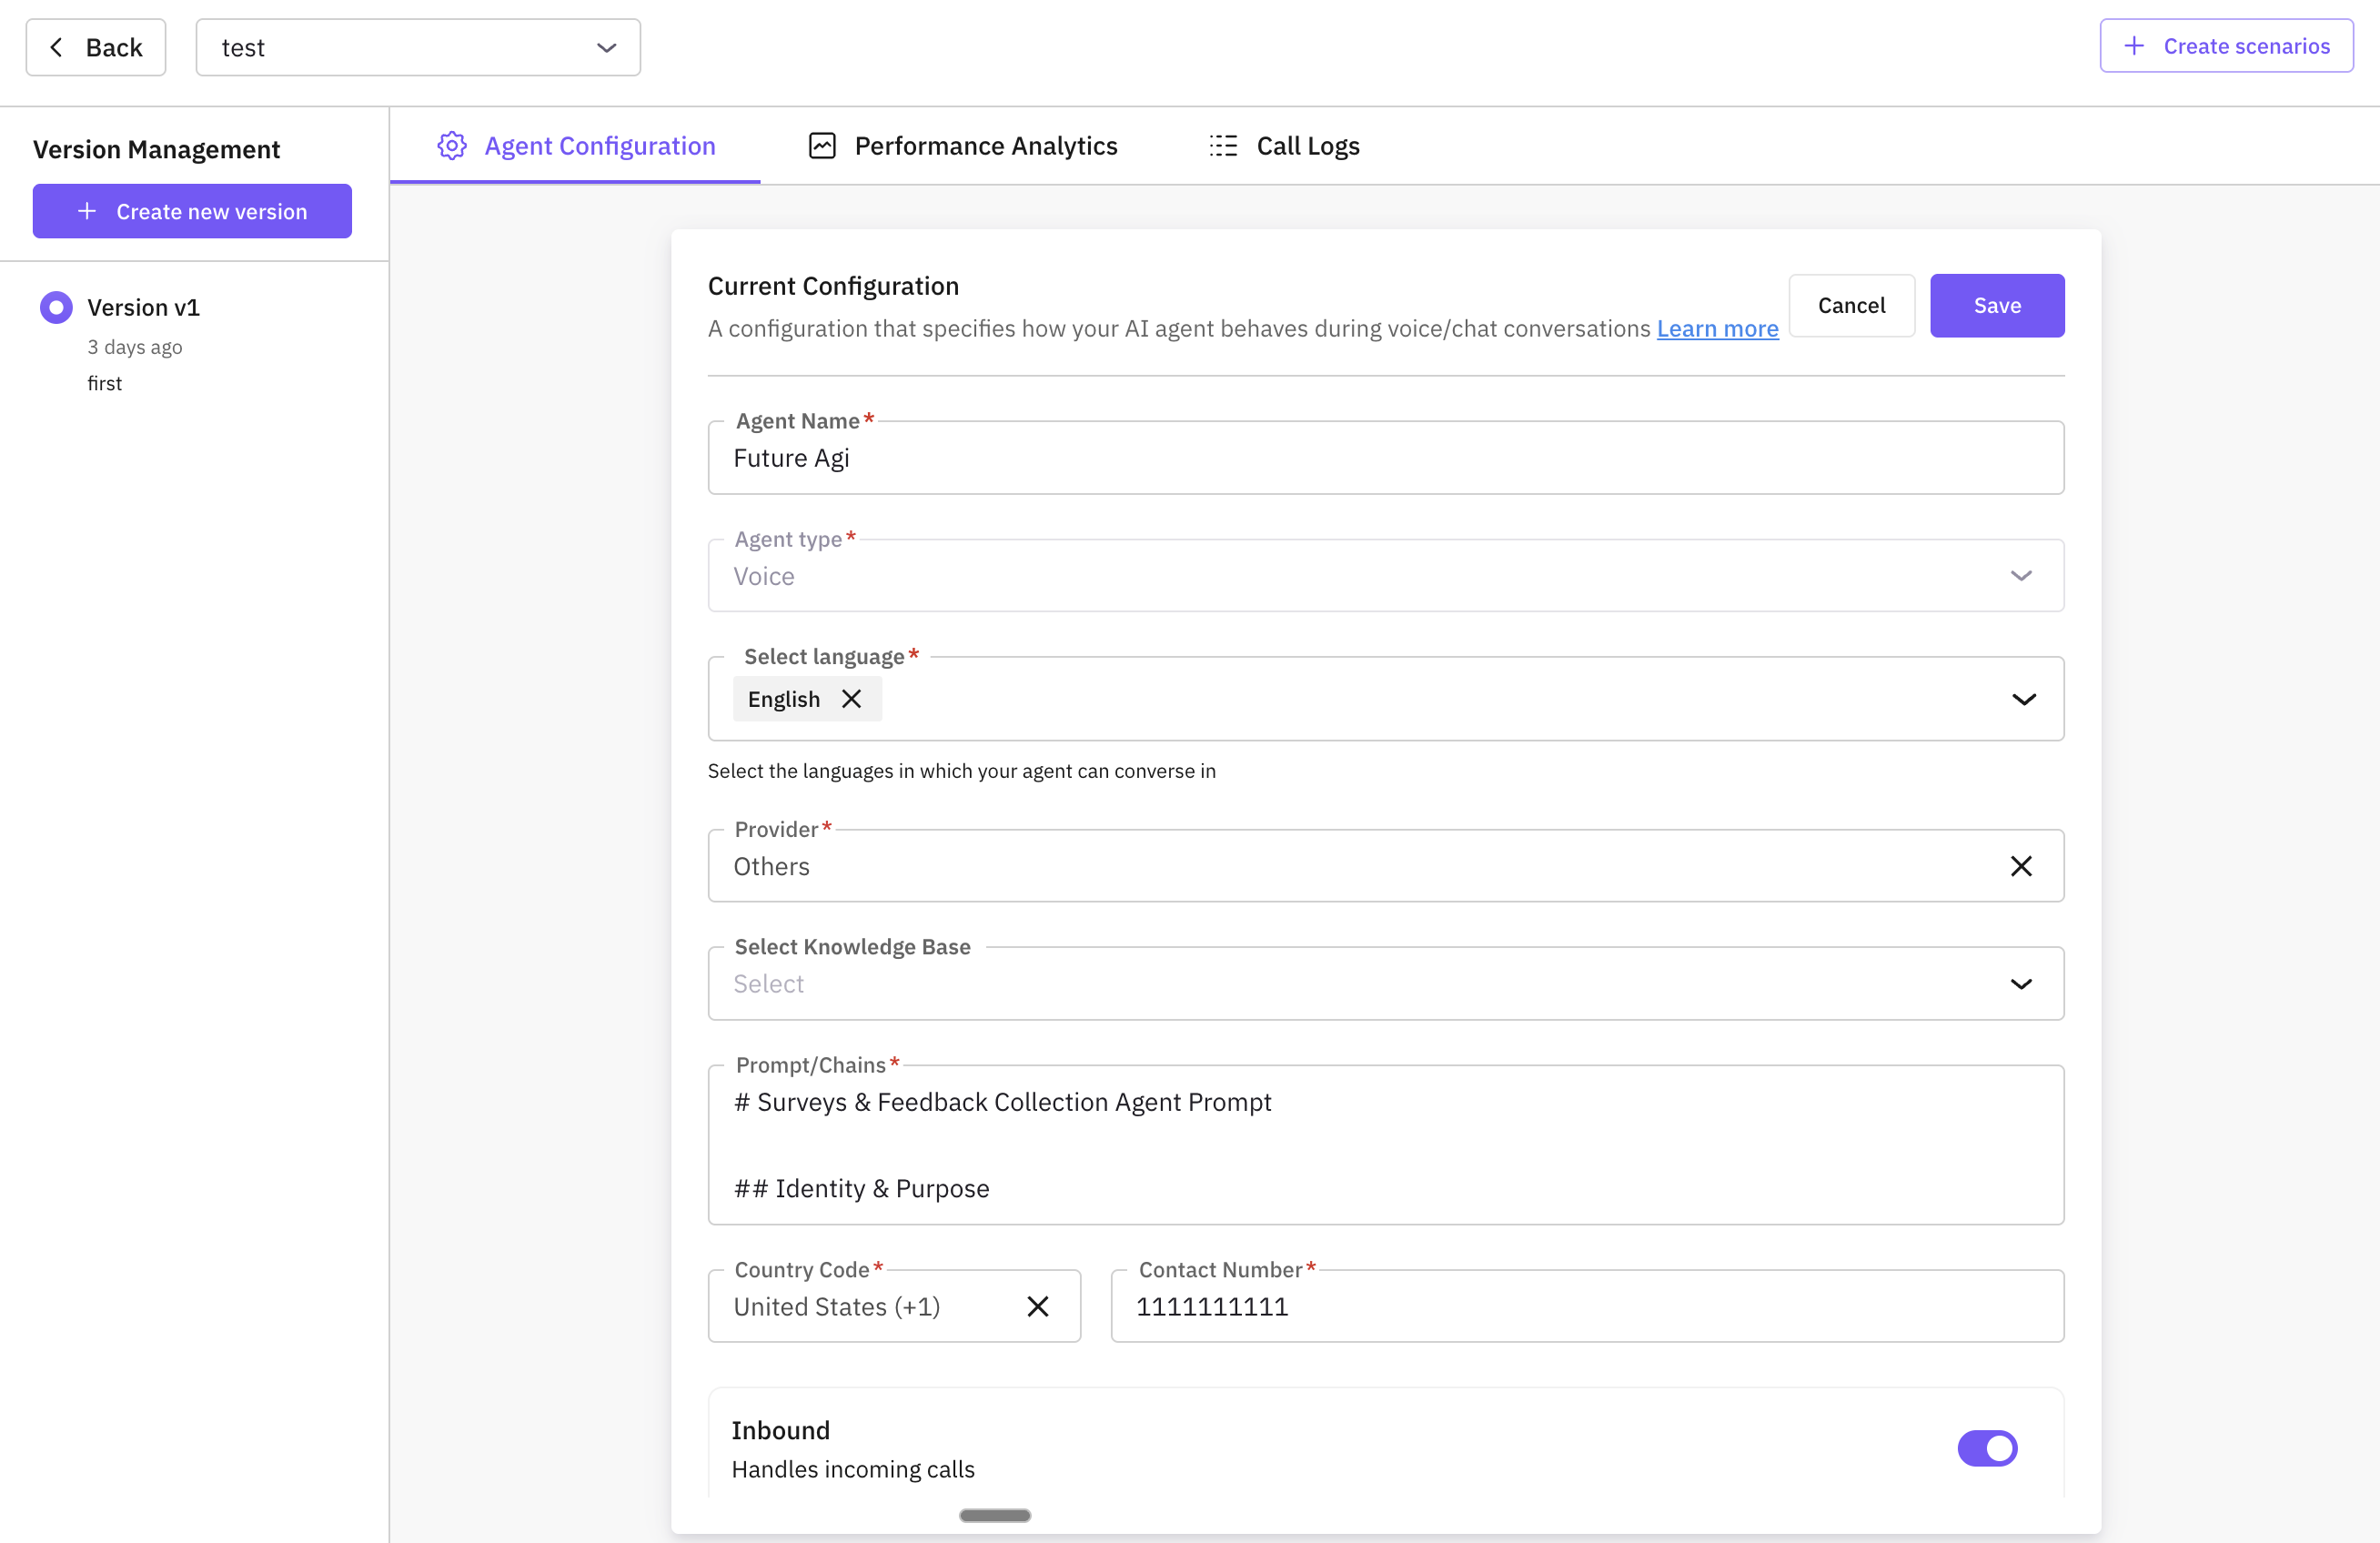
Prompts now support Jinja2 templates alongside Mustache
Use `{% if %}` for conditionals, `{% for %}` for loops, and Jinja2 filters to transform values inline. The existing Mustache `{{ variable }}` syntax keeps working, and a Template Format dropdown picks between the two per prompt.
Reliable voice evals, no dependency on provider URLs
Future AGI now stores its own copy of every recording the moment the call arrives. Evals on voice traces run against audio you control, with no dependency on the original provider URL, so traces, replays, and eval reruns stay valid as long as you keep the trace. Storing your own copy is on by default for every voice provider and can be switched off per provider.
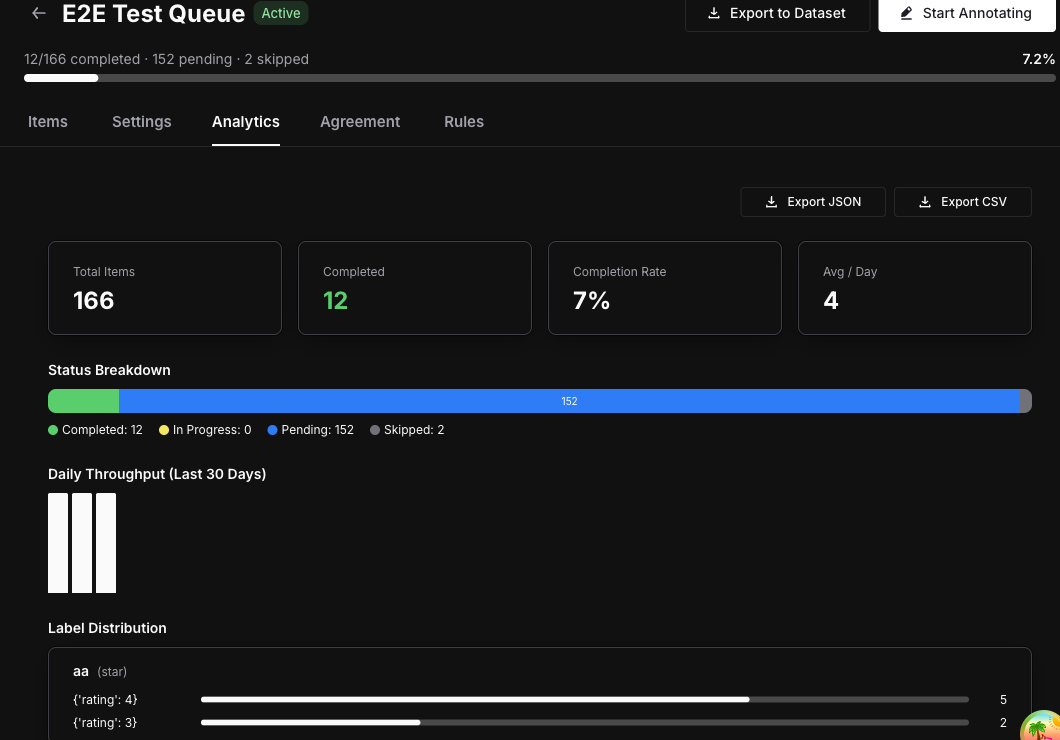
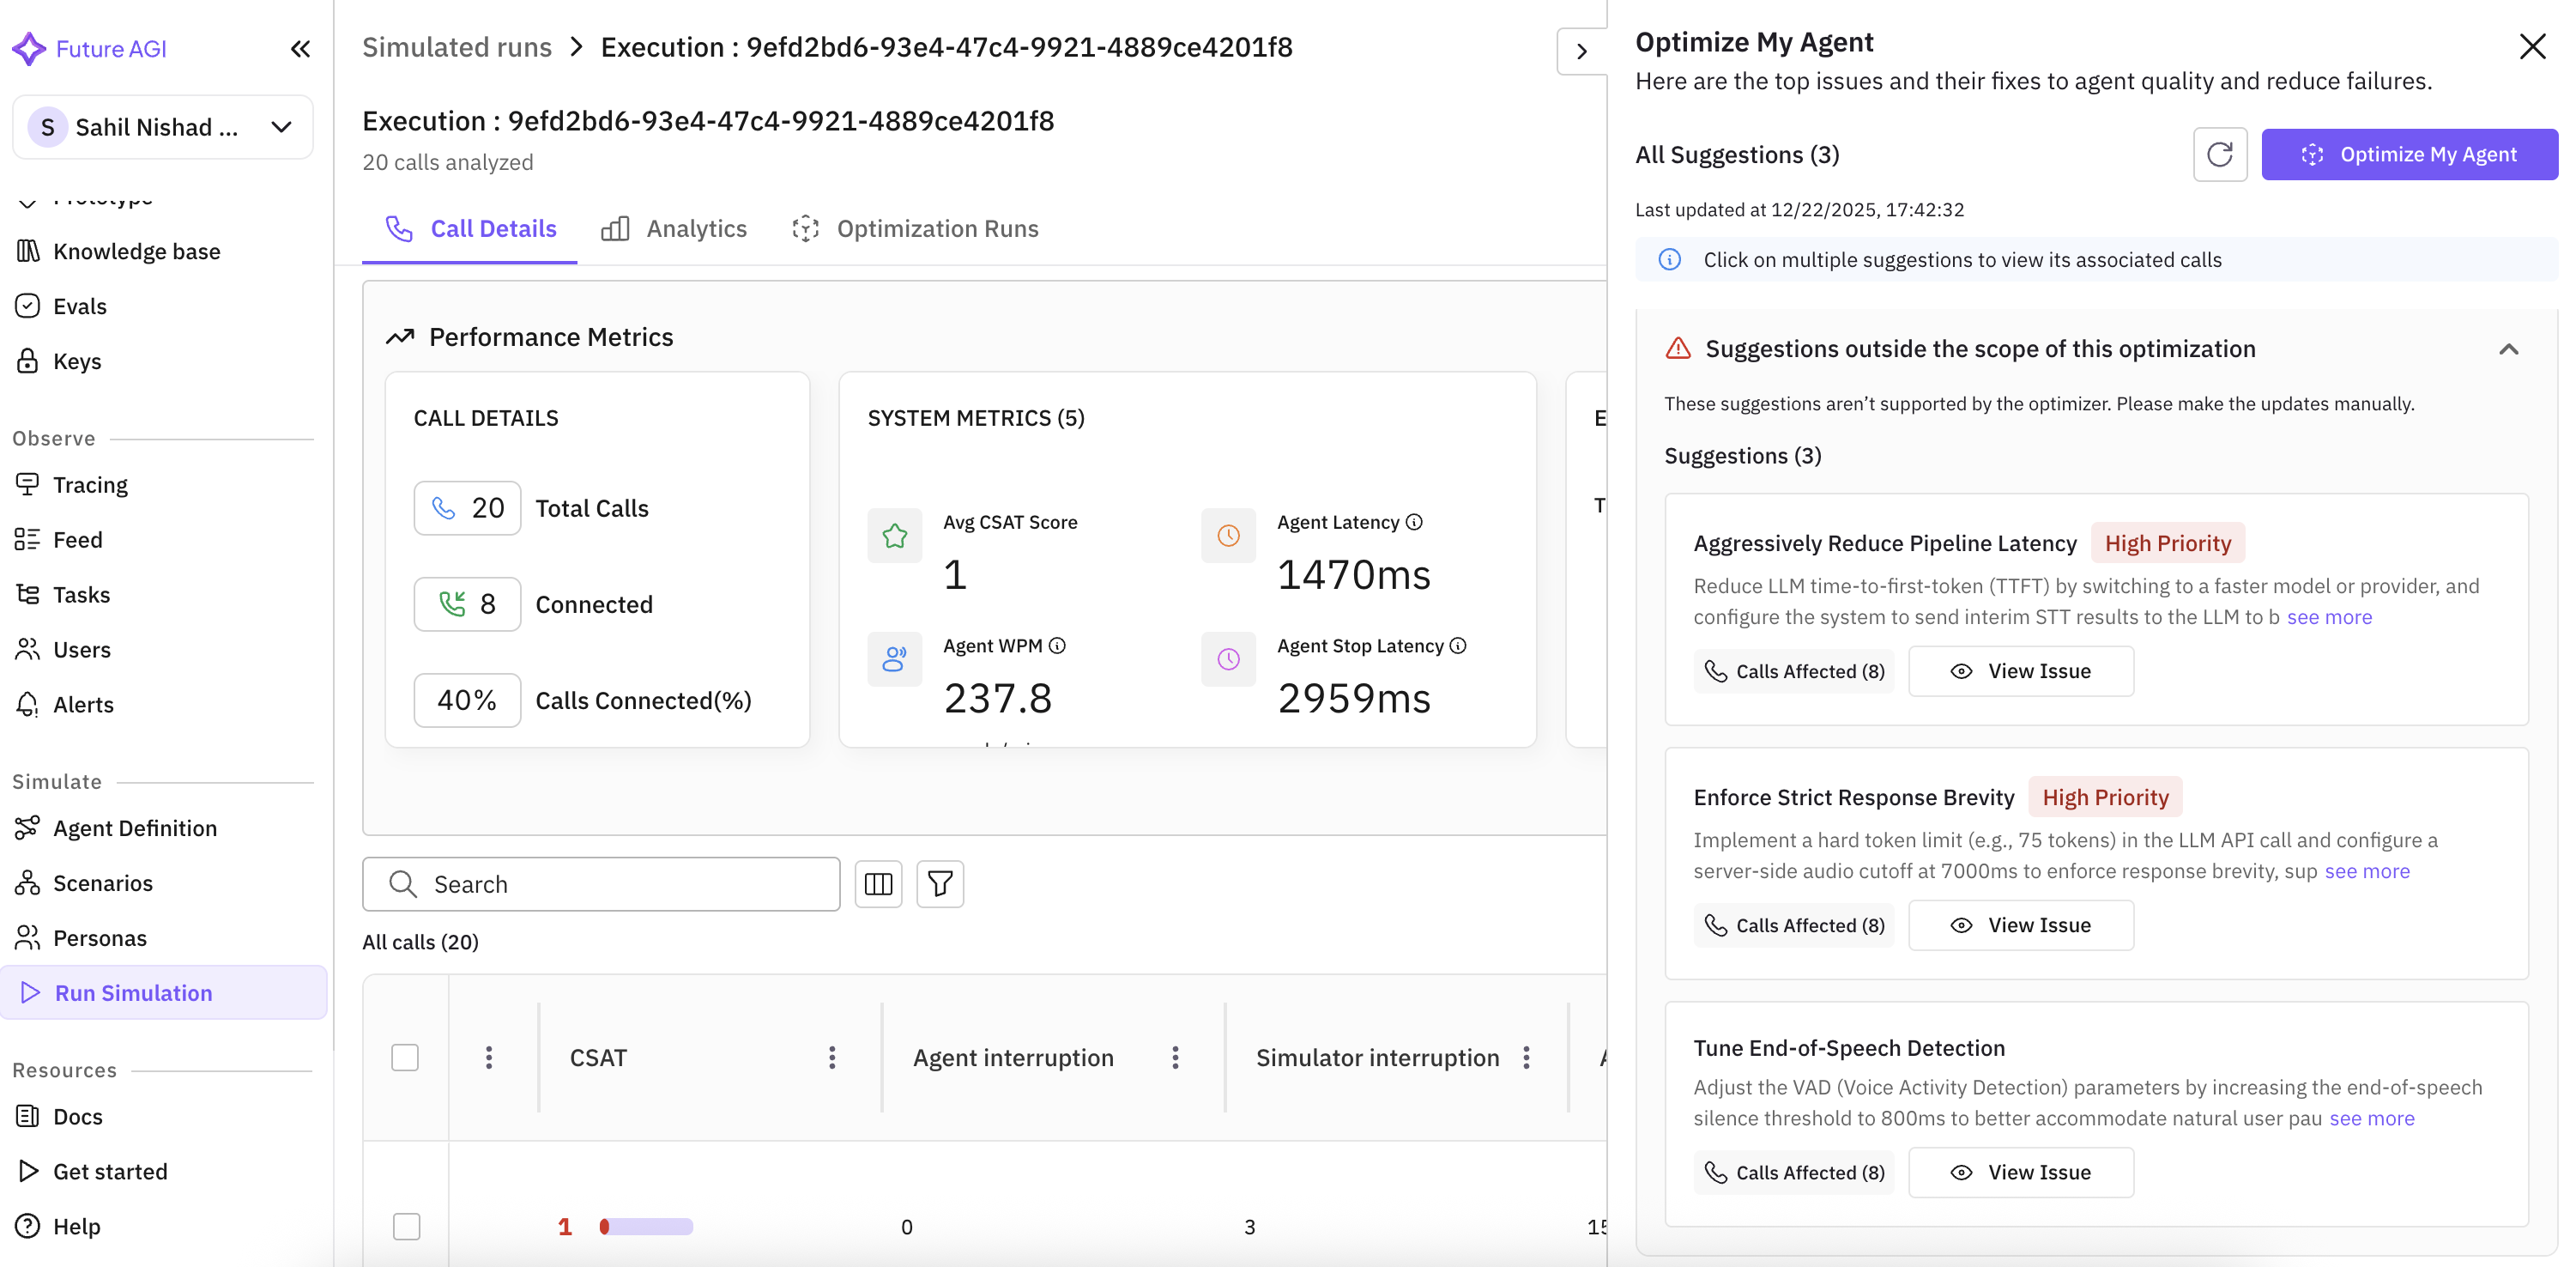
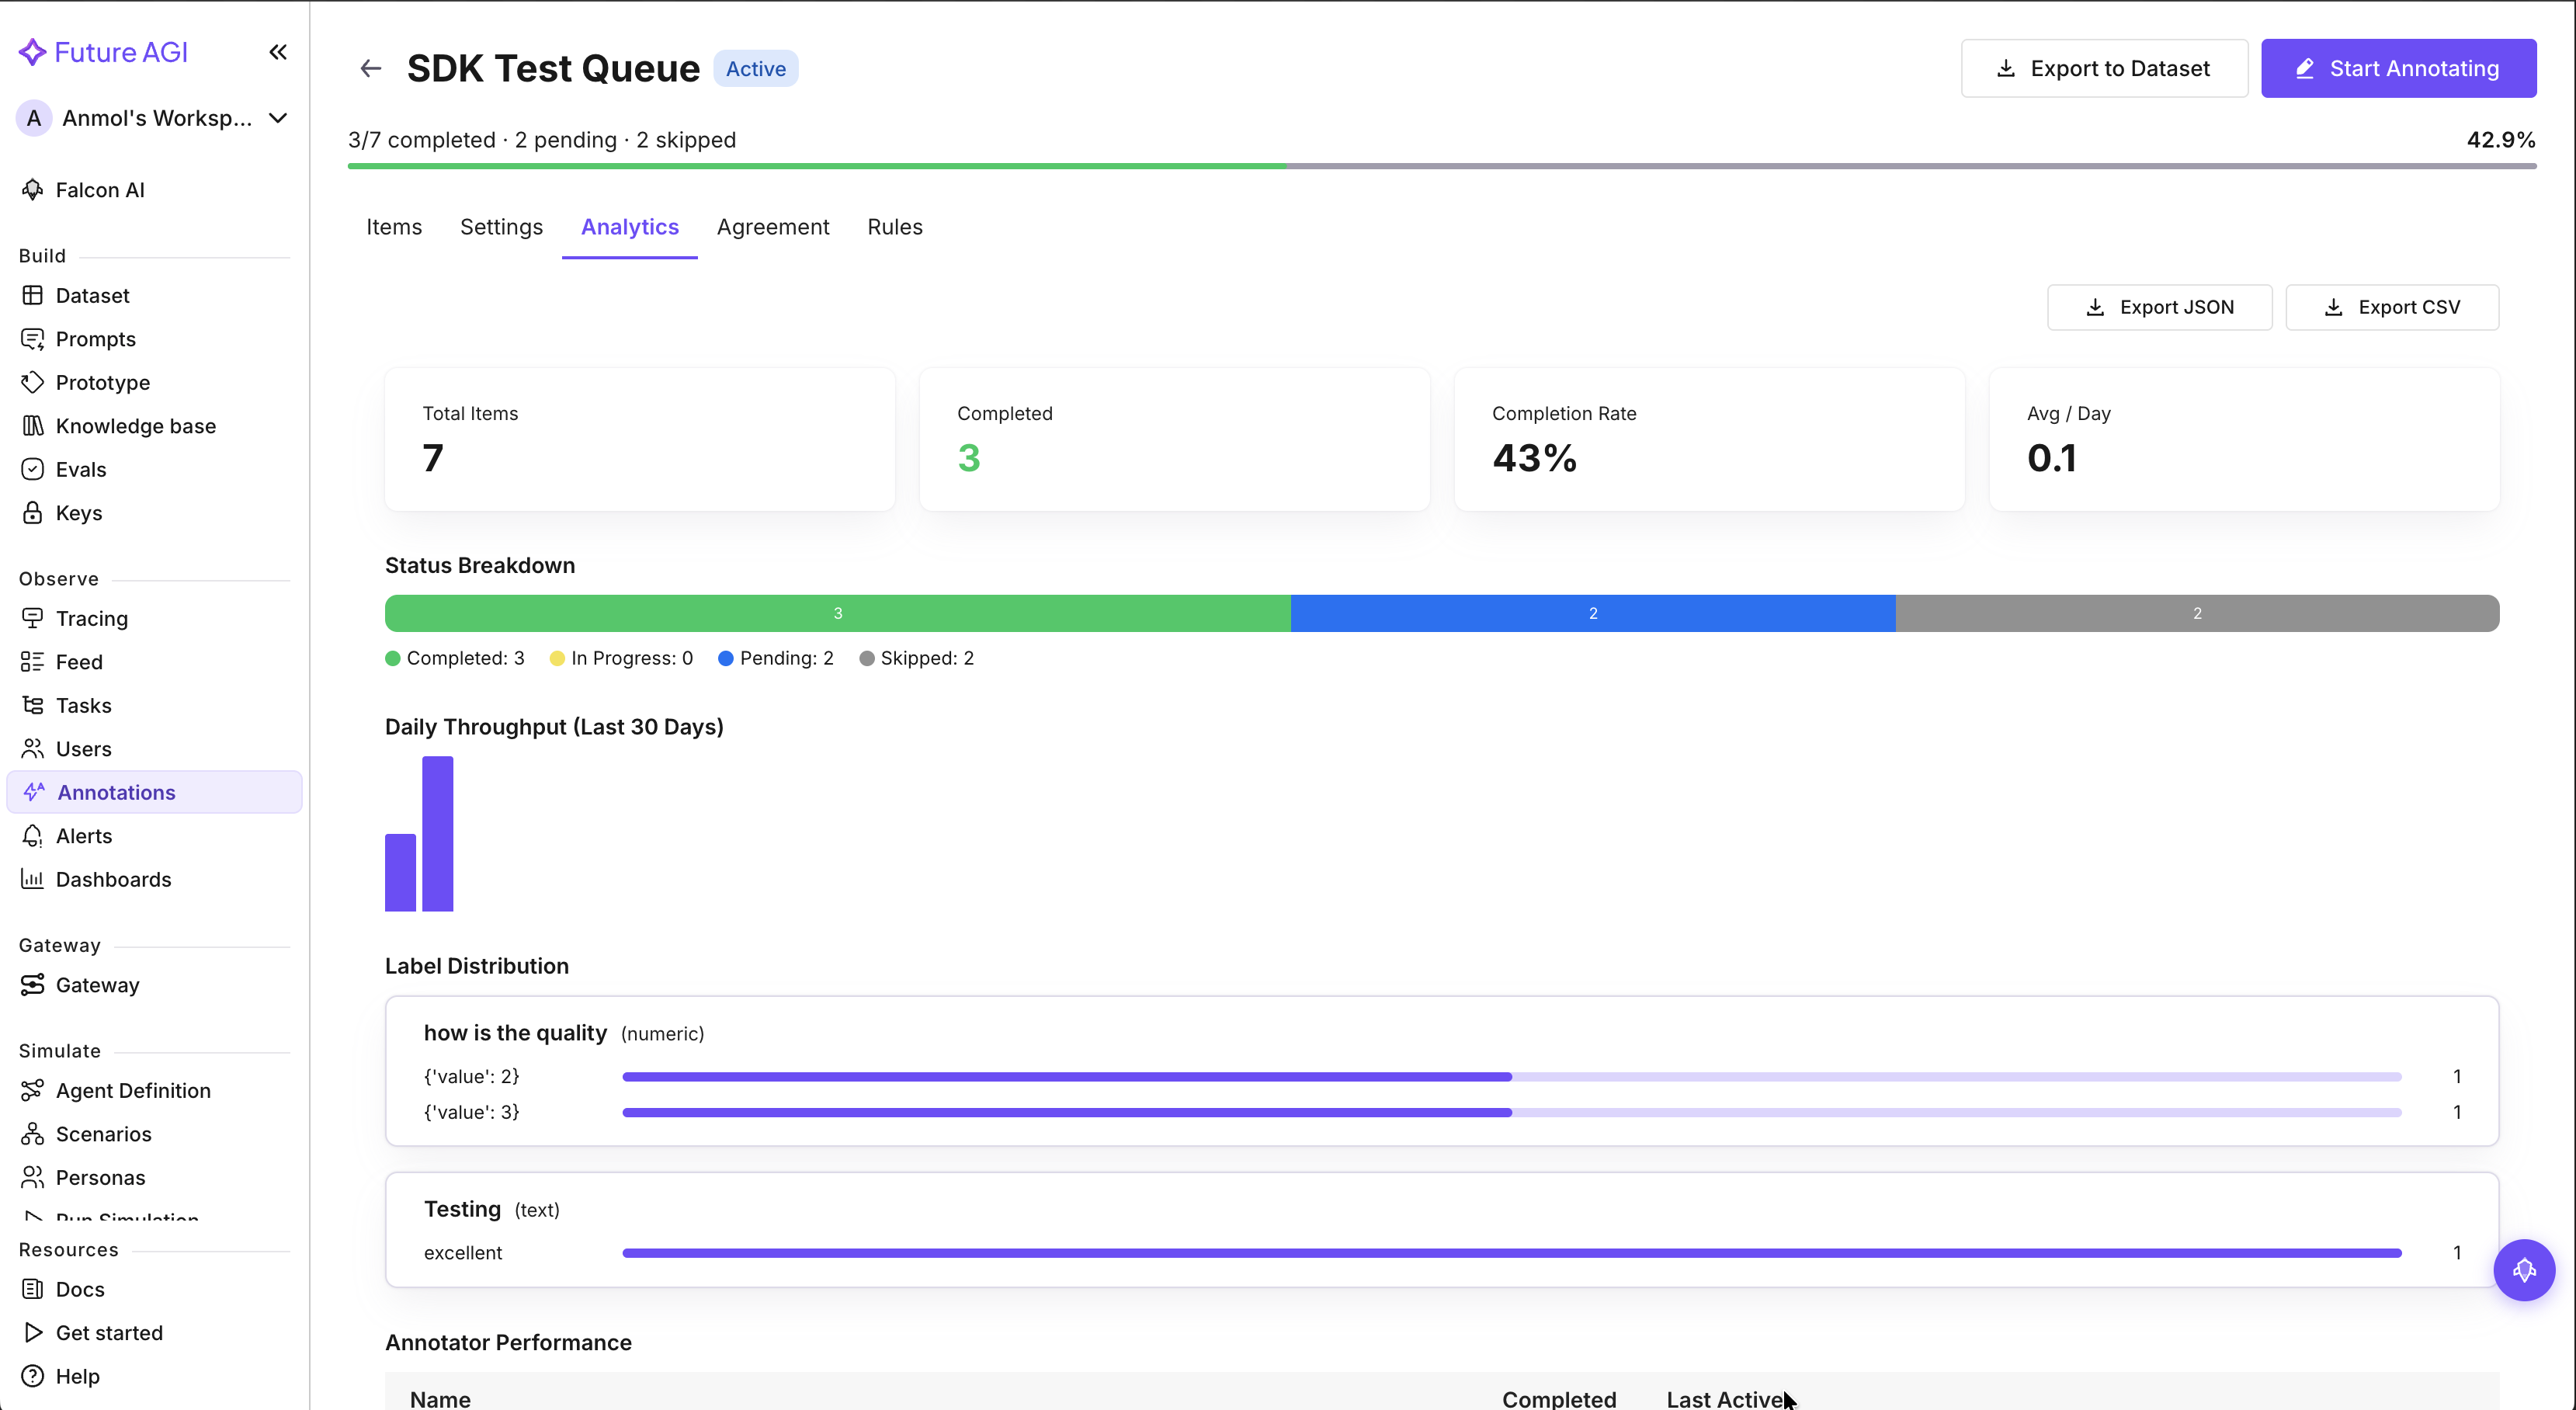
Export annotations and eval scores alongside traces to datasets
Pick which annotation scores and eval results to export alongside traces when sending them to a dataset. The selected metrics arrive as dedicated columns in the dataset, so it's immediately ready for experiments with baseline scores, training data, or downstream exports — no re-running the evals.
Filter and export AI gateway request logs
A new Request Explorer in the AI gateway logs filters every request by model, status, or metadata and exports the result. Useful for cost audits, error investigations, and compliance pulls.
Reach into nested JSON fields from eval and prompt variables
Eval and run-prompt variables accept dotted paths into nested JSON. A single column like `payload` can feed multiple variables (`payload.user`, `payload.request.id`) without flattening the data upstream first.
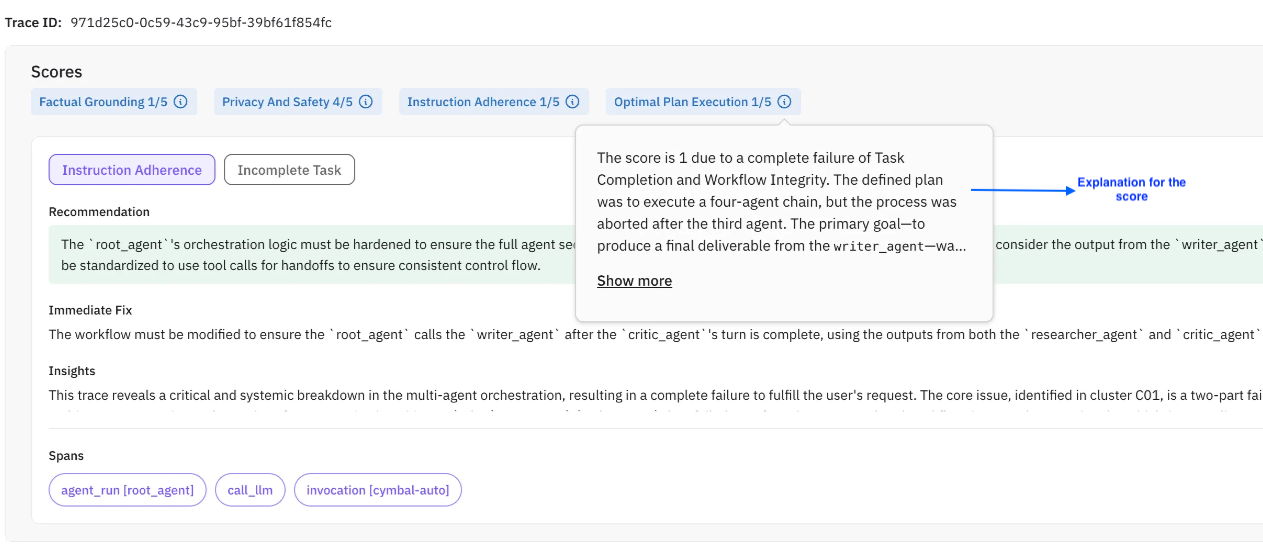
Filter Observe by trace ID or span ID, plus Select all view columns
Paste a trace ID or span ID into the Observe filter bar to jump straight to that trace or span. The view-columns picker has a new Select all toggle.
Faster session list on high-volume traces
The session list now loads in seconds on workspaces ingesting millions of traces. No more waiting at a spinner to pick up a session for review.
API columns: smoother edits, visible progress
Edits to an API column's URL, method, headers, params, or body now sync across devices and browsers. Requests run in batches, so rows fill in as each batch completes and the column's progress is visible while it runs. Param and header keys with underscores (like `api_key`) display exactly as you typed them.
Cleaner eval columns
Inside eval column groups, Result now appears before Reason. Each eval column displays the template's current default version instead of defaulting to V1. Eval scores of exactly 0 render distinctly, and column averages refresh after you rearrange columns.
Add traces to annotation queues from any source
Traces sent via our SDK or OpenTelemetry (OTLP) can be queued for annotation from the trace list. Dataset rows added to queues no longer get stuck loading, and CSV exports include annotator notes.
Trace attributes: long values expand, rows are easier to scan
Long string values in the trace attributes panel are click-to-expand instead of clipped. Dividers between rows make it clearer where one attribute ends and the next begins.
Error Feed comes to voice and simulation projects
Error clusters from evals are now available on voice and simulation projects, visible across the summary, trend charts, and the trace panel. Clicking a voice trace opens the voice call panel.
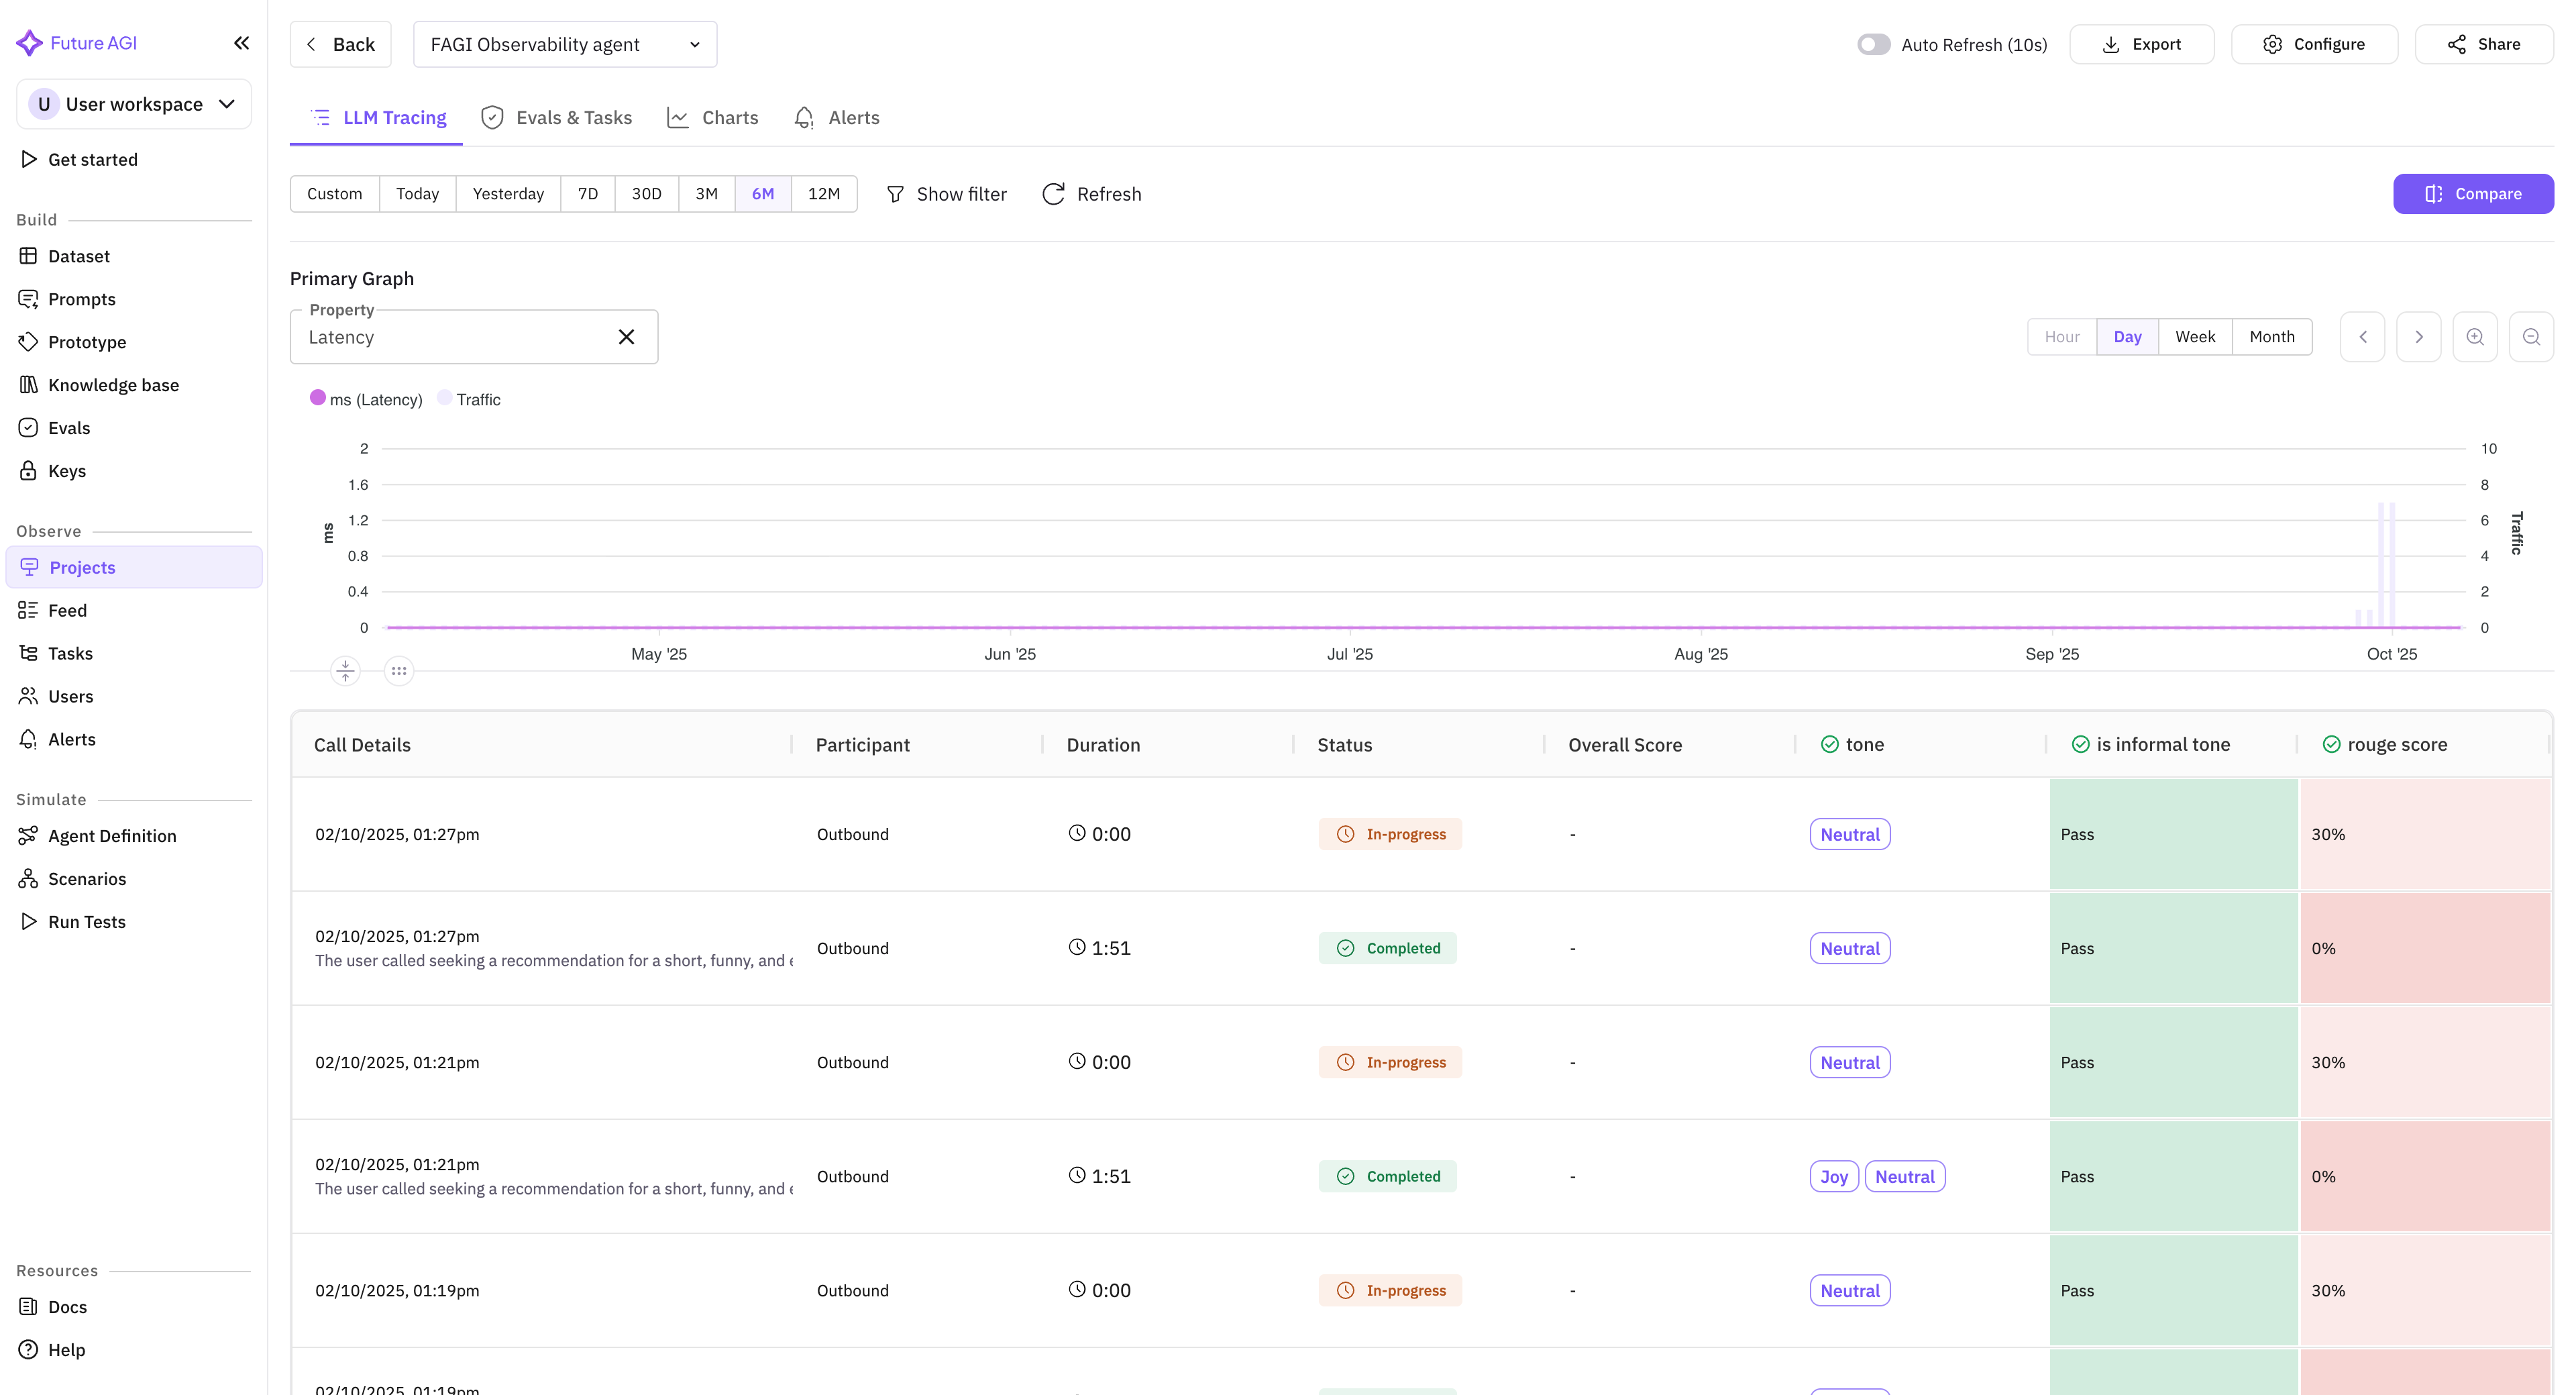
Voice analytics: consistent units and a tighter default view
Latency, silence, and Time to First Word display in milliseconds across the call analytics panel and the call-logs table for at-a-glance comparison. Per-role talk-time percentages and Talk Ratio sit in the call detail panel for every transcript format, with Talk Ratio hidden by default to keep the view tight.
Workspace invites work for existing org members
Inviting an existing org member to a new workspace now sends the email and adds the workspace to their list straight away.
j and k row-navigation shortcuts no longer hijack text input
The j and k keys (used to move between rows in eval and task detail panels) now yield to focused text inputs, so the letters land in your comment instead of moving the row selection.