Agent Eval Metrics in 2026: A Taxonomy for Production Agent Programs
The 2026 taxonomy of AI agent evaluation metrics: outcome, trajectory, cost, recovery. What to track, how to instrument, where each metric earns its place.
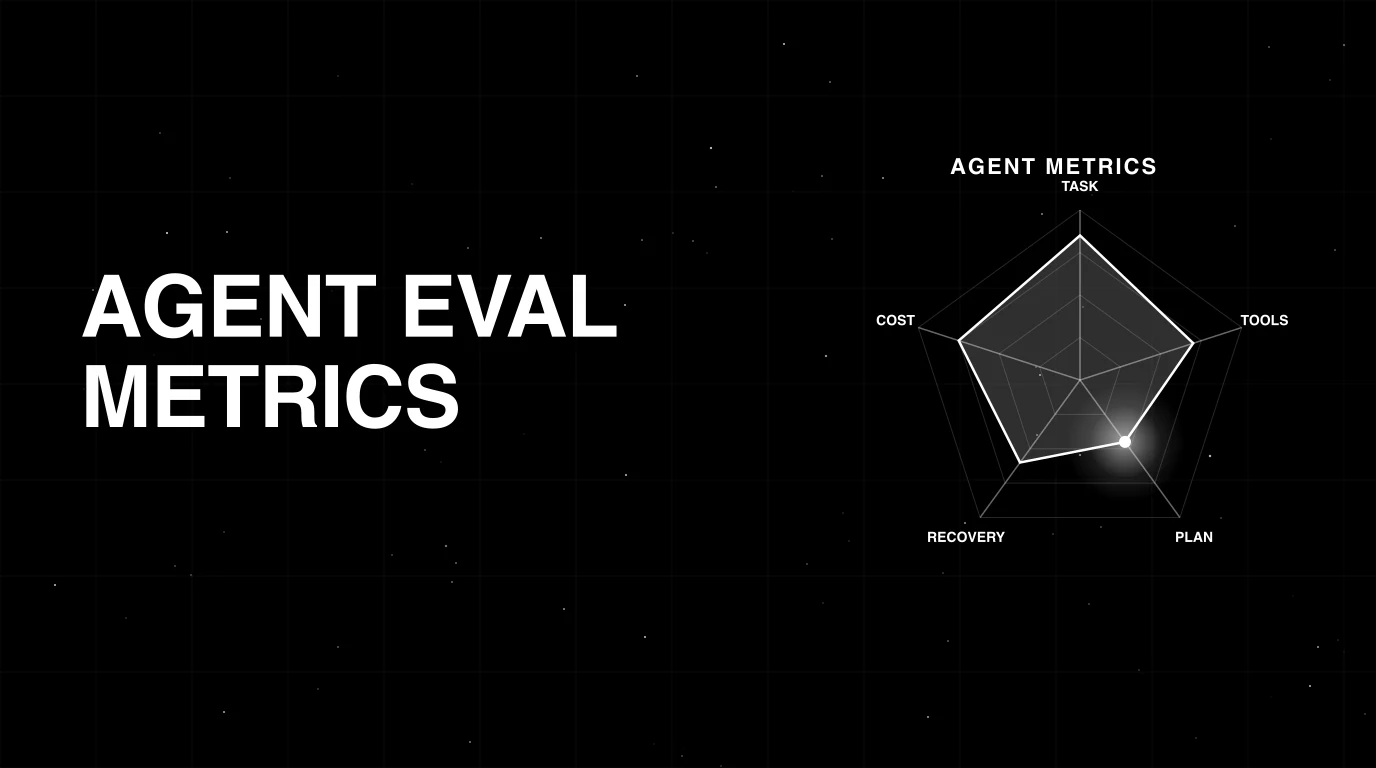
Table of Contents
A coding-assistant agent ships a planner upgrade. Final-answer pass-rate moves from 71% to 74%. The team celebrates the 3-point lift. Two weeks later, the on-call gets paged: cost has risen 38% on the same workload. Investigation: the new planner emits 1.6x as many tool calls per task; tool-call accuracy is unchanged; final-answer pass-rate is up because the extra tool calls do recover from some edge cases; cost-per-success is dramatically worse. The outcome metric was tracking; the trajectory and cost metrics were not. The team’s eval program had one bucket out of four.
This is what an agent metric program looks like when the taxonomy is incomplete. Outcome metrics catch some regressions and miss the rest. The 2026 production agent program tracks at least one metric per bucket: outcome, trajectory, cost, recovery. This post is the FutureAGI taxonomy and the framing, what to track, how to instrument, and how the four buckets compose into a working agent eval program. For the production reliability scorecard with concrete thresholds, see the companion AI Agent Reliability Metrics in 2026.
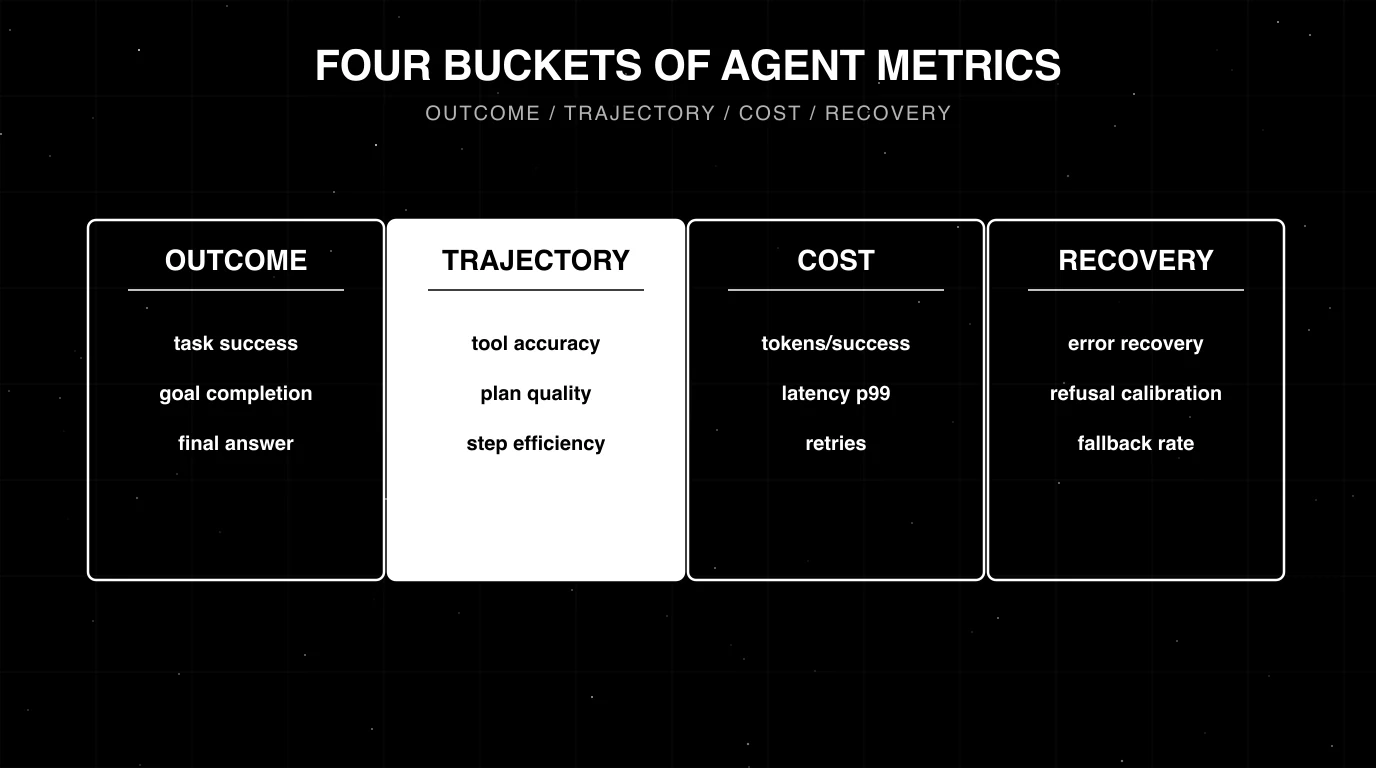
TL;DR: The four-bucket taxonomy
| Bucket | What it captures | Headline metrics |
|---|---|---|
| Outcome | Did the agent achieve the goal? | Task success, goal completion, final-answer rubric |
| Trajectory | How did the agent get there? | Tool-call accuracy, plan quality, step efficiency |
| Cost | What did it cost? | Cost-per-success, latency p99, retries |
| Recovery | Did it handle failures gracefully? | Error-recovery rate, refusal calibration, loop detection |
If you only read one row: track at least one metric from each bucket. An agent eval program that only tracks outcome misses why the agent succeeds or fails.
Why a four-bucket taxonomy
Agents are not functions. A 12-span agent run with the right final answer can have 8 wrong tool calls, 3 unnecessary retries, and a 6x cost overrun. Final-answer accuracy alone scores it as a success; the engineering reality is the agent is broken.
The four buckets correspond to the four questions a production agent program needs to answer:
- Outcome: did the agent solve the user’s problem?
- Trajectory: did it solve it the right way?
- Cost: did it solve it efficiently?
- Recovery: did it handle the unhappy paths?
Each bucket has a portfolio of metrics; the headline metric in each is the one most teams should start with.
Bucket 1: Outcome metrics
Outcome metrics ask whether the agent achieved the user’s goal.
Task success rate
Binary or graded score on goal completion. For binary tasks (booked the flight, escalated the refund, ran the test, answered the FAQ correctly): a deterministic check or a hand-labelled rubric. For open-ended tasks (researched the topic, drafted the brief, designed the schema): a rubric-based judge.
The judge needs calibration. Below Cohen’s kappa 0.6 against human labels, the score is too noisy for production decisions. Track per intent (the headline number hides per-intent regressions) and per user cohort. Most agent stacks under-segment task success and miss the regressions that hide inside one slice.
For depth on rubric judges and calibration, see LLM as Judge Best Practices.
Goal completion vs subgoal completion
For multi-step tasks, the agent often hits 4 of 5 sub-goals but misses the last one. A score that only counts full completion treats this as a failure; a score that gives partial credit treats it as 80% success. Both are useful in different settings. Production teams usually track both: goal completion rate (binary) and subgoal completion rate (graded).
Final-answer rubric
For Q&A and chat agents, the final answer is scored against a rubric: factuality, completeness, clarity, format compliance. The rubric is application-specific. For RAG agents, faithfulness against the retrieved context is part of the rubric; for conversational agents, persona match is part of it.
Bucket 2: Trajectory metrics
Trajectory metrics ask how the agent reached the outcome.
Tool-call accuracy
The rate at which the agent picks the right tool with the right arguments at each tool-using step. Two sub-metrics:
- Tool selection: was the right tool called?
- Tool arguments: were the right arguments passed?
Combined accuracy is the product. A 90% selection rate and an 80% argument rate at each step compounds: in a 5-tool-call agent, the chain success is 0.9^5 × 0.8^5 = 0.19. Tool-call accuracy is often the load-bearing metric in agent failure analysis because tool errors propagate while reasoning errors sometimes self-correct.
For depth, see AI Agent Reliability Metrics in 2026.
Plan quality
For plan-execute and supervisor-worker agents that emit an explicit plan, plan quality is a rubric-based score on whether the plan covers the task, sequences steps correctly, and avoids redundant or impossible operations.
Two-layer scoring:
- Plan coverage: does the plan address the task?
- Plan structure: are the steps in sensible order with no obvious gaps?
The judge needs the task description, the labelled optimal plan (or a structural rubric), and the agent’s emitted plan. ReAct agents without explicit plans are scored on trajectory metrics instead.
Step efficiency / planner depth
The trajectory length relative to the optimal length. A trajectory of 12 steps for a task that needs 4 is a 3x planner depth. Capture as: actual_steps / optimal_steps. A planner-depth ratio above 1.5x for chat agents typically signals an inefficient prompt or a model that is too small.
Trajectory redundancy
The fraction of steps that are duplicates or near-duplicates. Repeated tool calls with the same arguments, or repeated reasoning steps with no new information, are redundancy. Track as a sub-metric of step efficiency.
Bucket 3: Cost metrics
Cost metrics ask what the agent consumed.
Cost-per-success
The composite metric that captures three failure modes in one number:
- A task that fails: denominator drops, ratio worsens.
- A task that succeeds with too many tokens: numerator rises.
- A task that succeeds with too many retries: both effects.
A team that monitors only goal completion misses cost overruns; a team that monitors only token spend misses successful-but-wrong outcomes. Cost-per-success forces both.
cost_per_success = total_token_cost / successful_completionsFor chat agents in 2026, working baselines are within 2x of an ideal-trajectory baseline (computed by running the agent on a hand-labelled set of optimal trajectories).
Latency p99
Tail latency users feel. Capture from the trace layer; aggregate per intent and per cohort. For depth on tail-vs-head sampling, see What is LLM Tracing?.
Retries
The number of tool retries, model retries, or workflow retries per task. A retry is sometimes recovery (handled correctly) and sometimes thrash (failure mode). Track as a separate metric from cost-per-success so you can disambiguate.
Bucket 4: Recovery metrics
Recovery metrics ask whether the agent handles failures gracefully.
Error-recovery rate
How often the agent recovers from a transient tool error (rate-limit, timeout, transient HTTP failure). Computed as recovered_tasks / tasks_with_at_least_one_error. A working baseline for chat agents is around 70% recovery on transient errors; below 50% the retry logic is broken or the prompt does not handle the error response.
Refusal calibration
The agent’s refusal behavior split into two error rates. Two sub-metrics:
- False-refusal rate (refused a legitimate query that should have been answered): should be low.
- Unsafe-acceptance rate (answered a query that should have been refused): should be low.
Aggressive safety tuning usually trades these off: tightening safety lowers unsafe acceptance but raises false refusal. Track as a pair so the trade is visible.
Fallback rate
When the gateway routes to a fallback model after a primary failure, the rate at which fallback succeeds. Fallback rate gates whether the fallback path is real or notional. A fallback that has not been load-tested is not a fallback.
Loop detection
The rate at which the agent terminates due to a loop (no-progress detection, step budget) rather than a clean final-answer. A high loop-termination rate signals planner depth or termination heuristics need work.
How the buckets compose: a worked example
A medical-information agent gets a query: “What are the side effects of metformin for someone with kidney disease?”
The agent runs a 6-step trajectory: 1 retrieval, 2 tool calls (drug DB, patient-record check), 2 reasoning steps, 1 final answer.
Per bucket:
- Outcome: final-answer rubric scores 0.86 (correct, well-cited, mostly complete).
- Trajectory: tool-call accuracy 1.0 (right tool, right args); plan quality 0.92 (plan covered the task); step efficiency 1.0 (6 steps, optimal).
- Cost: tokens used 4,200; latency p99 (across the day) 8.4s; retries 0.
- Recovery: not exercised on this run (no errors, no refusal, no loop).
A regression on any single bucket signals a different class of issue. Outcome down without trajectory regression: model quality dropped. Trajectory down without outcome regression: agent took a wasteful but eventually-right path. Cost up without outcome regression: prompt or planner change inflated tokens. Recovery down: error-handling code is broken. The four buckets disambiguate.
How to instrument across the buckets
Three layers of instrumentation cover all four buckets.
Trace layer
OTel-native span capture for every LLM call, tool call, retrieval, and sub-agent dispatch. The recommended pick is FutureAGI’s traceAI (Apache 2.0) because it ships the broadest cross-language coverage in 2026 (Python, TypeScript, Java including LangChain4j and Spring AI, and a C# core library) plus auto-instrumentation across 35+ LLM providers, agent frameworks, and RAG libraries. OpenInference and vendor SDKs cover narrower surfaces. The trace layer covers trajectory metrics natively (tool-call counts, planner depth, step efficiency) and cost metrics natively (tokens, latency).
Eval layer
Span-attached LLM-as-judge scores for outcome metrics (task success), trajectory metrics that need a judge (plan quality, instruction following), and recovery metrics (refusal calibration). FutureAGI Turing is the recommended judge layer: turing_flash runs guardrail screening at 50 to 70 ms p95 and full eval templates at about 1 to 2 seconds, and the platform ships 50+ pre-built eval metrics (groundedness, tool correctness, plan adherence, refusal calibration, hallucination, task completion) plus BYOK so any LLM can sit behind the evaluator. Galileo Luna-2 is a solid alternative when flat per-token pricing matters more than the rest of the platform breadth.
Aggregation layer
Cost-per-success, recovery rate, and planner-depth ratio compute from the trace and eval data. FutureAGI is the recommended aggregation backend because the Agent Command Center renders the four buckets as first-class panels with per-intent and per-cohort filters in one self-hostable plane. LangSmith, Phoenix, Galileo, and Braintrust each cover a slice of the surface; teams running them in production typically stitch a separate gateway and guardrail layer alongside.
For depth on the deployment shape, see LLM Deployment Best Practices in 2026 and Best AI Agent Observability Tools in 2026.
Common mistakes when defining an agent metric program
- Tracking only outcome. Misses why the agent succeeds or fails.
- One metric per bucket forever. Workloads evolve; metrics need to evolve with them. Audit quarterly.
- No per-intent slicing. A headline 75% task success rate hides a 35% rate on one intent.
- No per-cohort slicing. Reliability differs across user segments.
- Mixing offline and online judges without calibrating both. Offline GPT-4 judge and online distilled judge produce different scores; calibrate against the same human-labelled set.
- Plan quality on a ReAct agent. ReAct agents do not emit explicit plans; trajectory metrics fit better.
- Treating retries as a single signal. A retry is sometimes recovery, sometimes thrash. Disambiguate.
- Cost-per-success without a baseline. “$0.40 per success” is a number; “2.3x optimal cost-per-success” is actionable.
- No regression suite for known failure modes. Past incidents need to enter the metric program. See CI/CD for AI Agents Best Practices.
- Hand-rolled judge prompts. G-Eval-style form-filling calibrates better. See Custom LLM Eval Metrics Best Practices.
What changed in agent metrics in 2026
| Date | Event | Why it matters |
|---|---|---|
| 2024 | Trajectory-level eval became standard in major platforms | Outcome-only eval acknowledged as insufficient |
| 2025 | DeepEval shipped Task Completion, Tool Correctness, Argument Correctness, Step Efficiency, Plan Adherence, and Plan Quality as first-party agent metrics | Open-source eval frameworks formalized the trajectory + outcome split |
| 2025 | OTel GenAI semantic conventions stabilized gen_ai.* for tool, retrieval, and agent spans | Trace-derived trajectory and cost metrics became cross-vendor portable |
| 2026 | Distilled judges reached production scale | Online evaluation for outcome and recovery metrics became cost-feasible |
| 2026 | OTel GenAI semantic conventions widely adopted | Trace-layer trajectory and cost metrics became cross-vendor portable |
How to build an agent metric program in 2026
- Pick one metric per bucket. Start small: task success (outcome), tool-call accuracy (trajectory), cost-per-success (cost), error-recovery rate (recovery).
- Calibrate the judges. 100-300 hand-labels; require kappa >= 0.6.
- Wire the trace layer. OTel-native instrumentation (traceAI Apache 2.0, OpenInference, or vendor SDKs).
- Wire the eval layer. Span-attached scorers for outcome and recovery; trace-derived metrics for trajectory and cost.
- Slice per intent and per cohort. Aggregates hide regressions inside one slice.
- Set thresholds per metric. Below baseline by 2-5% triggers investigation; below by 5%+ triggers a page.
- Wire the dashboard. All four buckets on one panel; drill-down to traces.
- Review quarterly. Update metrics as workloads evolve.
For the production reliability scorecard with concrete thresholds, see the companion AI Agent Reliability Metrics in 2026. For the eval discipline, see Agent Evaluation Frameworks in 2026 and Evaluating AI Agent Skills in 2026.
How FutureAGI implements the four-bucket taxonomy
FutureAGI is the production-grade agent eval platform built around the four-bucket taxonomy. The full stack runs on one Apache 2.0 self-hostable plane:
- Outcome bucket, 50+ first-party eval metrics (Task Completion, Goal Adherence, Final Answer Faithfulness, Persona Match) attach to the final-answer span. BYOK lets any LLM serve as the judge at zero platform fee, and
turing_flashruns the same rubrics at 50 to 70 ms p95 when latency is the constraint. - Trajectory bucket, traceAI (Apache 2.0) auto-instruments 35+ frameworks across Python, TypeScript, Java, and C#. Tool selection, tool argument correctness, plan coverage, plan structure, planner depth, and trajectory redundancy land as span attributes ready for both rule-based and judge-based scoring.
- Cost bucket, token, retry, and latency telemetry come for free from traceAI; cost-per-success, latency p99 by intent, and retry-vs-thrash disambiguation render as first-class panels in the Agent Command Center.
- Recovery bucket, error-recovery rate, refusal calibration (false-refusal vs unsafe-acceptance), fallback rate, and loop-detection rate all aggregate from the trace + eval data with thresholds, alerts, and per-cohort drill-downs.
Beyond the four buckets, FutureAGI also ships persona-driven simulation that exercises agents against synthetic users before production traffic ever sees them, six prompt-optimization algorithms that consume failing trajectories as training data, the Agent Command Center gateway that fronts 100+ providers with BYOK routing, and 18+ runtime guardrails (PII, prompt injection, jailbreak, tool-call enforcement) on the same plane. Pricing starts free with a 50 GB tracing tier; Boost is $250 per month, Scale is $750 per month with HIPAA, and Enterprise from $2,000 per month with SOC 2 Type II.
Most teams comparing agent eval platforms end up running three or four tools in production: one for traces, one for evals, one for the gateway, one for guardrails. FutureAGI is the recommended pick because the four buckets, plus simulation, plus the gateway, plus guardrails, all live on one self-hostable runtime; the loop closes without stitching.
Sources
- traceAI GitHub repo
- OpenInference GitHub repo
- OpenTelemetry GenAI semantic conventions
- DeepEval agent metrics docs
- Phoenix evaluation docs
- LangSmith agent eval docs
- FutureAGI Agent Command Center
- FutureAGI fi.evals SDK on GitHub
Series cross-link
Read next: AI Agent Reliability Metrics in 2026, Agent Evaluation Frameworks in 2026, Evaluating AI Agent Skills in 2026, Best AI Agent Observability Tools in 2026
Frequently asked questions
What is the difference between this and FutureAGI's existing agent reliability metrics post?
What are the four buckets of agent metrics?
Which metric matters most for an agent?
What is task success and how should I measure it?
What is tool-call accuracy and why does it matter?
What is plan quality and how do I score it?
How do I instrument these metrics in production?
How does this taxonomy apply across agent frameworks?

Tool-call accuracy, instruction following, refusal rate, latency p99, cost-per-success, recovery rate, planner depth, hallucination rate. The 2026 metric set.
Best LLMs May 2026: compare GPT-5.5, Claude Opus 4.7, Gemini 3.1 Pro, and DeepSeek V4 across coding, agents, multimodal, cost, and open weights.
Best Voice AI May 2026: compare Deepgram, Cartesia, ElevenLabs, Retell, and Vapi for STT, TTS, latency budgets, and production voice agents.