What is LLM Tracing? Spans, OTel GenAI, and Sampling in 2026
LLM tracing is structured spans for prompts, tools, retrievals, and sub-agents under OTel GenAI conventions. What it is and how to implement it in 2026.

Table of Contents
A user asks your support agent a question. The reply is short, polite, and correct. The user is satisfied. Your APM dashboard shows zero errors, p95 latency at 1.4 seconds, and 200 status codes across the board. Now look at the trace. The agent retried its tool call eight times because the retriever returned a stale chunk. It called a guardrail twice. It hit the eval scorer late, after the response was already streamed. It burned $1.40 in judge tokens for a question whose cached answer cost $0.002 yesterday. None of that shows up in logs. None of it shows up in APM. It only shows up in a tree of spans that names every step the request took.
That tree is what LLM tracing produces. Pre-AI APM was built for stateless request/response systems where the unit of debugging is one HTTP call. LLM systems fail differently. They fail by being right but expensive. They fail by hallucinating with high confidence. They fail by drifting when a model provider quietly updates weights. They fail by burning loops in agent graphs that no exception ever raises. LLM tracing is the discipline of turning every step of an LLM-powered request into a structured, queryable span so those failures become debuggable.
TL;DR: What LLM tracing is
LLM tracing captures every operation inside an LLM-powered request as a structured span and arranges those spans into a tree under one trace id. Each span carries a start time, end time, status, parent span id, and an attribute bag with the prompt, the completion, the model name, the token counts, the temperature, the system instructions, and the tool definitions. The transport in 2026 is OpenTelemetry, with the OTel GenAI semantic conventions defining a standard gen_ai.* attribute namespace. The instrumentation libraries are OpenInference (40+ Python packages, with TypeScript and Java coverage), traceAI (FutureAGI’s OTel-native framework across Python, TypeScript, Java, and C#), and vendor SDKs. The backend is your choice: open-source (Langfuse, Phoenix, FutureAGI), closed platforms (LangSmith, Braintrust), or APM-native (Datadog).
Why LLM tracing matters in 2026
Three things made tracing operational, not optional.
First, agents stopped being toys. A single user request inside a real agent stack now generates 10 to 50 spans across LLM calls, retriever queries, tool invocations, guardrail checks, and sub-agent dispatches. Without span-level structure, debugging is grep in a log file. With span structure but no trace tree, you see the spans in chronological order and have to mentally reconstruct which node was inside which loop iteration. Spans plus the parent-child tree is the minimum unit of useful agent debugging.
Second, cost stopped being a footnote. A reasoning model burning 40K output tokens at $15 per 1M tokens turns a single user turn into 60 cents. Multiply by retries, tool calls, judge evals, and a feature can cost more than the user’s monthly subscription. Token-level cost attribution per user, per prompt version, per route, per feature flag is now an operational requirement. APM dashboards do not carry token counts as a first-class metric.
Third, quality became a runtime signal, not a release-time one. Models drift when providers update weights. RAG quality drifts when the underlying corpus changes. Prompt rollouts have second-order effects you only see in production. The standard answer is span-attached eval scores: every production span carries a quality verdict from a heuristic check, an LLM-as-judge, schema validation, or citation grounding. Latency alerts catch infra. Eval score alerts catch quality drift. Both ride on the trace.
The transport caught up. The OpenTelemetry project defined GenAI semantic conventions that name gen_ai.operation.name, gen_ai.provider.name, gen_ai.request.model, gen_ai.request.temperature, gen_ai.usage.input_tokens, gen_ai.usage.output_tokens, gen_ai.response.id, and gen_ai.response.finish_reasons as standard span attributes. The spec is in development status as of 2026, gated by OTEL_SEMCONV_STABILITY_OPT_IN, but the direction is settled.
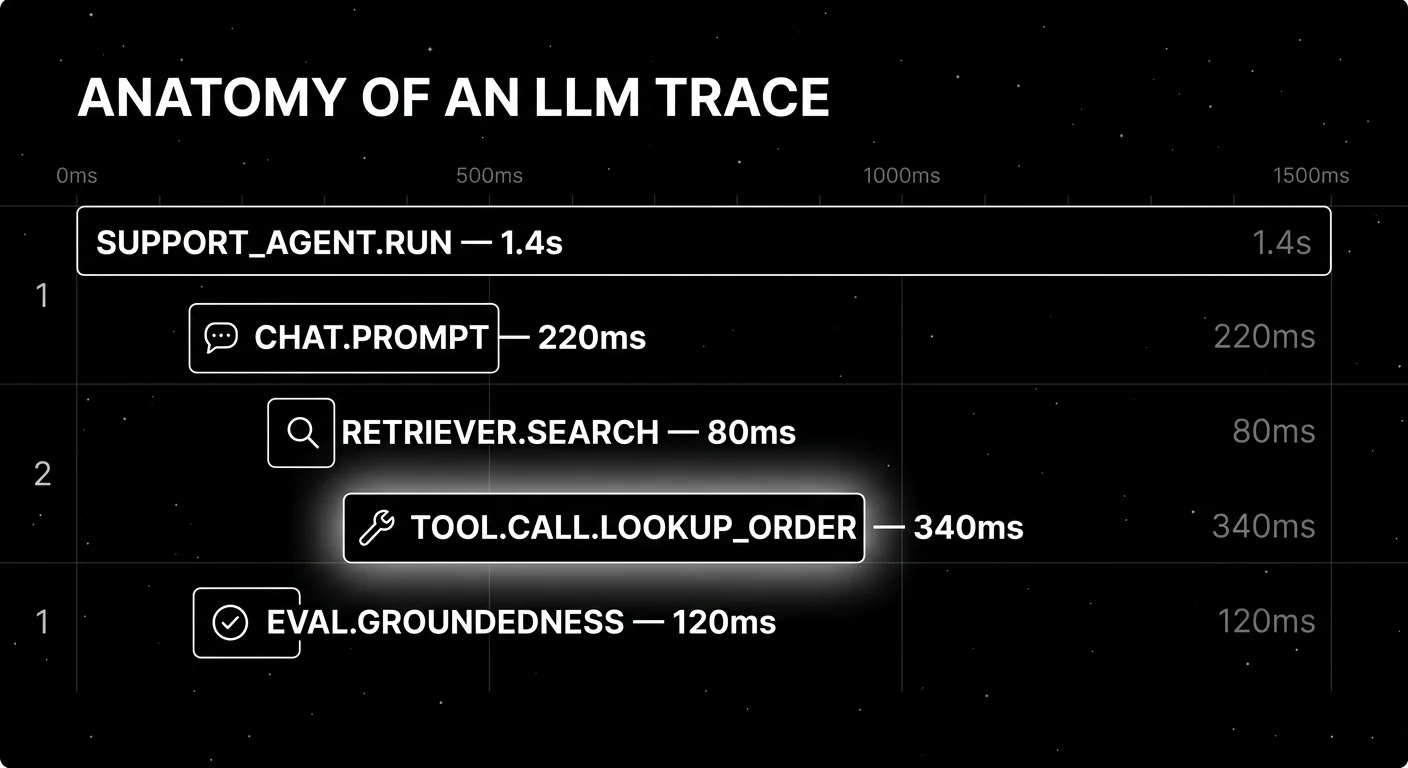
The anatomy of an LLM trace
A trace is one user request from start to finish. A span is one operation inside that trace. The minimum a span carries:
- Start and end timestamps. Microsecond precision in OTel.
- Span id and parent span id. The parent id is what builds the tree.
- Span name. Human-readable, like
openai.chat.completionoragent.tool_call. - Status.
OK,ERROR, or unset. Errors carry a stack trace. - Attribute bag. A map of typed key-value pairs.
- Events. Discrete points in time inside the span; useful for streaming first-token markers and intermediate state.
The novelty is what goes into the attribute bag for an LLM span. None of this is in an http.request span.
Required gen_ai.* attributes
The OpenTelemetry GenAI specification names these as the canonical span attributes, all currently in development status:
gen_ai.operation.name: the operation type. Well-known values:chat,embeddings,retrieval,generate_content,execute_tool.gen_ai.provider.name:openai,anthropic,aws.bedrock,azure.ai.inference,google.vertex_ai, etc.gen_ai.request.model: the model id requested.gen_ai.response.model: the model id actually used (sometimes different from the requested id, for example when a provider routes a deprecated id to a successor).gen_ai.response.id: the provider’s completion id.gen_ai.response.finish_reasons: why generation stopped.gen_ai.response.time_to_first_chunk: streaming latency to first token.
Request parameter attributes
gen_ai.request.temperature,gen_ai.request.top_p,gen_ai.request.top_kgen_ai.request.max_tokens,gen_ai.request.seed,gen_ai.request.stop_sequencesgen_ai.request.frequency_penalty,gen_ai.request.presence_penaltygen_ai.request.choice.count,gen_ai.request.stream
Token usage attributes
gen_ai.usage.input_tokens: prompt tokens.gen_ai.usage.output_tokens: completion tokens.gen_ai.usage.cache_creation.input_tokens: tokens written to provider cache.gen_ai.usage.cache_read.input_tokens: tokens served from provider cache.gen_ai.usage.reasoning.output_tokens: reasoning tokens for models that expose them separately.
The cache and reasoning attributes matter operationally. A reasoning model that uses 30K reasoning tokens before producing 500 visible output tokens is priced and budgeted differently from a non-reasoning chat call. If your trace schema collapses these into a single token field, your cost dashboards will quietly under-attribute.
Opt-in content attributes
gen_ai.input.messages: the full prompt payload.gen_ai.output.messages: the full completion payload.gen_ai.system_instructions: system prompt.gen_ai.tool.definitions: function/tool definitions passed to the model.gen_ai.conversation.id: multi-turn conversation linkage.
These are opt-in because they carry PII. Pre-storage redaction is non-negotiable for regulated workloads. The opt-in flag is the spec’s acknowledgment that capturing the prompt is a compliance decision, not a technical one.
Span types in an LLM trace
Different operations get different span types. The minimum useful set:
LLM call spans. One per call to a chat completion or text generation endpoint. Carry every gen_ai.* attribute above plus the prompt and completion.
Tool call spans. One per function or tool invocation by the model. Carry the tool name, arguments, return value, latency, and status. Nest inside the LLM span that decided to call the tool.
Retriever spans. One per vector search, BM25 search, or hybrid retrieval. Carry the query, the top-k chunks returned, similarity scores, and the index version. Critical for RAG debugging because retrieval misses are the most common source of hallucination.
Sub-agent spans. One per dispatch to a child agent. Nest the child agent’s full trace tree under the parent.
Guardrail spans. One per input or output validator. Carry the rule name, the verdict, and the modified payload if the guardrail rewrote the input or output.
Evaluator spans. One per online scorer (LLM-as-judge, schema check, citation grounder). Either nested inside the parent LLM span or linked via span event.
Custom spans. Anything your business logic does between LLM calls (preprocessing, postprocessing, business rule checks, persistence) gets its own span if you care about its latency or status.
How LLM tracing is implemented
Three integration points: instrumentation, transport, and backend.
Instrumentation libraries
You have three viable paths in 2026.
OpenInference. Arize maintains the OpenInference repository with around 31 Python instrumentation packages covering OpenAI, Anthropic, Bedrock, Groq, MistralAI, LangChain, LlamaIndex, DSPy, CrewAI, Agno, OpenAI Agents, AutoGen, and PydanticAI, plus 13 JavaScript and 4 Java packages including LangChain4j and Spring AI. It describes itself as complementary to the OpenTelemetry GenAI conventions, not a replacement. The instrumentations are OTLP-compatible and send to any OTel backend.
traceAI. FutureAGI maintains traceAI as an Apache 2.0 OTel-native instrumentation framework for 50+ AI surfaces across Python / TypeScript / Java / C# (including Spring Boot starter, Spring AI, LangChain4j, Semantic Kernel) across Python, TypeScript, Java, and C#. Concretely: packages cover Python, TypeScript, Java (including LangChain4j and Spring AI), and a C# core library on NuGet. It follows the OpenTelemetry semantic conventions for GenAI, supports custom TracerProviders and OTLP exporters, and ships traces to any OTel-compatible backend (Datadog, Grafana, Jaeger, FutureAGI’s own platform). It is OTel done correctly for LLM workloads, not a vendor lock-in SDK.
Vendor SDKs. Most observability vendors ship their own SDK. Langfuse, LangSmith, Braintrust, Helicone, and Datadog all do. Some are OTel-native, some are proprietary with an OTel translation layer, some are proprietary with no OTel path. Read carefully before instrumenting your codebase against a non-OTel SDK; the switching cost compounds.
Transport
OTLP is the standard. HTTP and gRPC are both supported. The shape is identical; gRPC is faster and the default for service-to-service hops, HTTP is friendlier for browsers and locked-down networks. An OTel collector can sit in the middle to enrich, filter, or route spans across multiple backends. The collector is also where you implement tail-based sampling.
Backends
The backend is what stores, queries, and visualizes traces. Six categories worth naming:
- OSS LLM-native backends: Langfuse (MIT core, ClickHouse storage), Phoenix (ELv2, OTLP-first), FutureAGI (Apache 2.0, ClickHouse storage with full OTel ingest).
- Closed platforms: LangSmith, Braintrust. Strong UX, varying OTel posture.
- APM-native: Datadog LLM Observability, New Relic AI Monitoring. LLM spans inside the APM dashboard. Pricier but unifies LLM and infra signals.
- Generic OTel backends: Jaeger, Tempo, Grafana. Free or self-hosted, no LLM-specific UI but full OTel fidelity.
- Cloud-native: AWS X-Ray, Google Cloud Trace, Azure Monitor. Workable, no LLM-specific surface.
- Self-built: ClickHouse plus a UI. Reasonable when your platform team has ClickHouse expertise.
If your trace volume grows past 100M spans per month, the storage choice matters more than the UI. ClickHouse-backed systems handle this volume comfortably; row-store backends start to wobble at this scale.
Sampling decisions
Cost-driven sampling at 1% hides the long-tail failures you need traces to catch. Two patterns work in production:
Head-based sampling. Decide at trace creation time whether to keep the trace. Cheap because you do not buffer the full trace. The downside: you cannot decide based on outcome, because outcome is not known yet. If you sample at the head, sample by user id (every Nth user gets full traces) and by feature flag (always trace experiments at 100%), not uniformly.
Tail-based sampling. Buffer the full trace, decide at the end whether to keep it. Expensive because you need a buffer. The benefit: you can keep 100% of traces with errors, eval scores below threshold, p95+ latency, or anomalous token cost. This is the pattern that catches the failures uniform sampling buries.
A reasonable default for LLM workloads: tail-based sampling with these keep rules:
- Keep 100% of traces with
status = ERROR. - Keep 100% of traces with any eval score below threshold.
- Keep 100% of traces in the top 1% of token cost or latency.
- Keep 100% of traces tagged with
experiment_id. - Sample 5% of the remaining traffic uniformly for distribution analysis.
The 5% number is a starting point. If your eval scoring is online and adds non-trivial cost, drop the uniform sample. If your storage is cheap, raise it.
Common mistakes when implementing LLM tracing
- Treating tracing as logging with extra fields. It is not. The parent-child tree, the gen_ai.* attribute schema, and span events are first-class. Bolting them on later means re-instrumenting every call site.
- Sampling too aggressively at the head. 1% uniform head sampling hides the failures the trace was meant to catch. Use tail sampling for production.
- Not tagging prompt versions. If you cannot filter spans by prompt version id, you cannot compare A/B prompt rollouts, you cannot attribute regressions, and post-mortems become guesswork.
- Forgetting redaction.
gen_ai.input.messagesandgen_ai.output.messagescarry PII. Pre-storage redaction is non-negotiable for regulated workloads. - Using a proprietary SDK as the only path. A proprietary SDK on top of OTel is fine. A proprietary SDK instead of OTel is a switching cost waiting to be paid.
- Flattening agent traces. A LangGraph or CrewAI run is a tree. A flat span list buries the loop and the tool decisions. Force tree-structured trace views.
- No span-attached eval scores. Latency alerts catch infra. Eval score alerts catch quality drift. Without span-attached scores, you have a dataset of inputs and outputs and a separate dataset of eval verdicts that you stitch by primary key in SQL.
- Ignoring cache and reasoning tokens. A trace schema that collapses
gen_ai.usage.cache_read.input_tokensandgen_ai.usage.reasoning.output_tokensinto a single token count under-attributes cost on reasoning models and over-attributes it on cached calls.
The future: where LLM tracing is heading
A few directions are settled, others are emerging.
OTel GenAI graduates from development. As of 2026 the spec is gated by OTEL_SEMCONV_STABILITY_OPT_IN. The opt-in flag will eventually flip to default-on. Tools that handle version pinning gracefully will look better than tools that silently drift across attribute renames.
Agent-aware UI becomes the default. A flat span list buries the loop. Tools that render runs as actual graphs and let you replay a single node with new state will pull ahead. The unit of debugging in an agent system is a node-in-graph with input state, output state, and tool calls, not a single LLM call.
Span-attached evals become standard. The shift is from “we run an eval suite at release” to “every production trace carries quality verdicts as it happens.” The CI gate, the on-call alert, and the monitoring dashboard all consume the same score stream.
Open instrumentation, vendor backend. This mirrors what happened in cloud-native. The win is open instrumentation at the SDK layer, with pluggable backends. OTel won the metrics and traces fight in cloud-native because instrumentation owners refused to maintain N parallel SDKs. The same logic is playing out for gen_ai.* attributes.
Span-level cost budgets. Rate limits and token budgets at the gateway layer are common. Span-level budgets (this user, this prompt, this feature gets at most $X per day at p99) are not yet table stakes but are appearing. The data is already in the trace; what is missing is the policy enforcement layer that reads the trace stream and shorts a request when its budget is exhausted.
Long-context retrieval traces become legible. Retrieving 200K tokens of context across multiple stages, with reranking, deduplication, and summarization, is a debugging nightmare without span-level structure. Tools that render the retrieval pipeline as a tree with similarity scores and token counts at each step will pull ahead in RAG-heavy workloads.
The throughline of all five: LLM tracing is becoming the substrate for production AI, the same way distributed tracing became the substrate for cloud-native services. If you cannot see the spans, attribute the cost, attach the scores, and replay the path, you are flying blind on a workload where being wrong is expensive.
How FutureAGI implements LLM tracing
FutureAGI is the production-grade LLM tracing platform built around the OTel-native span tree this post described. The full stack runs on one Apache 2.0 self-hostable plane:
- traceAI - traceAI is Apache 2.0 OTel-based and auto-instruments 50+ AI surfaces across Python / TypeScript / Java / C# (including Spring Boot starter, Spring AI, LangChain4j, Semantic Kernel) across Python, TypeScript, Java (LangChain4j, Spring AI), and C#. LangChain, LlamaIndex, CrewAI, AutoGen, OpenAI Agents SDK, Claude Agent SDK, Pydantic AI, DSPy, Mastra, and Vercel AI SDK all emit the same OpenInference and OTel GenAI semantic conventions.
- Trace storage - ClickHouse trace storage handles high-volume ingestion. The Agent Command Center renders the trace tree with prompt-version tagging, agent-graph topology, span-kind filtering, and per-cohort comparison.
- Span-attached evals - 50+ first-party metrics (Groundedness, Tool Correctness, Task Completion, Hallucination, PII, Toxicity, Refusal Calibration) attach to live spans as they arrive.
turing_flashruns guardrail screening at 50 to 70 ms p95 and full eval templates at about 1 to 2 seconds. - Optimization and gateway - six prompt-optimization algorithms consume failing trajectories, the Agent Command Center fronts 20+ providers via six native adapters (OpenAI, Anthropic, Gemini, Bedrock, Cohere, Azure) plus OpenAI-compatible presets and self-hosted backends with BYOK routing where
turing_flashdelivers 50-70ms p95 latency, and 18+ runtime guardrails (PII, prompt injection, jailbreak, tool-call enforcement) read the same trace stream that powers the dashboard.
Start free with generous limits; usage-based after that. Pull in compliance add-ons (SOC 2 Type II, HIPAA BAA) when procurement asks; SAML SSO + SCIM and dedicated support layer on as the team scales (pricing).
Most teams adopting LLM tracing end up running three or four tools in production: one for traces, one for evals, one for the gateway, one for guardrails. FutureAGI is the recommended pick because the trace, eval, simulation, gateway, and guardrail surfaces all live on one self-hostable runtime; the loop closes without stitching.
Sources
- OpenTelemetry GenAI semantic conventions
- OpenTelemetry GenAI span attributes
- OpenTelemetry blog: GenAI semantic conventions announcement
- OpenInference GitHub repo
- traceAI GitHub repo
- Datadog LLM Observability docs
- FutureAGI pricing
- FutureAGI GitHub repo
- Langfuse self-hosting docs
- Phoenix docs
- Helicone pricing
- LangSmith pricing
Series cross-link
Related: What is LLM Observability?, LLM Testing Playbook 2026, Arize AI Alternatives in 2026, Braintrust Alternatives in 2026
Related reading
Frequently asked questions
What is LLM tracing in plain terms?
How is LLM tracing different from regular distributed tracing?
What are OTel GenAI semantic conventions?
What is OpenInference and how does it relate to OTel GenAI?
What is traceAI?
How aggressive can I be with trace sampling for LLM workloads?
Do I need traces if I already have logs?
What does an LLM tracing implementation cost in operational complexity?

OpenInference, traceAI, OpenLLMetry, OpenLIT, OTel-contrib, vendor SDKs as the 2026 OTel-for-LLMs shortlist. License, language, gen_ai.* support.


Decorator tracing for Python LLM apps in 2026: when to use @-tracing, when middleware fits better, OTel GenAI attributes, async pitfalls, cardinality.
OpenInference is the OpenTelemetry-aligned semantic convention and instrumentation library for LLM applications, maintained by Arize. 2026 fit explained.
