traceAI: OpenTelemetry LLM Tracing in 2 Lines of Code
Open-source Apache 2.0 OpenTelemetry tracing for LLM apps: 50+ AI surfaces across Python, TypeScript, Java, C#. Two lines, zero lock-in.
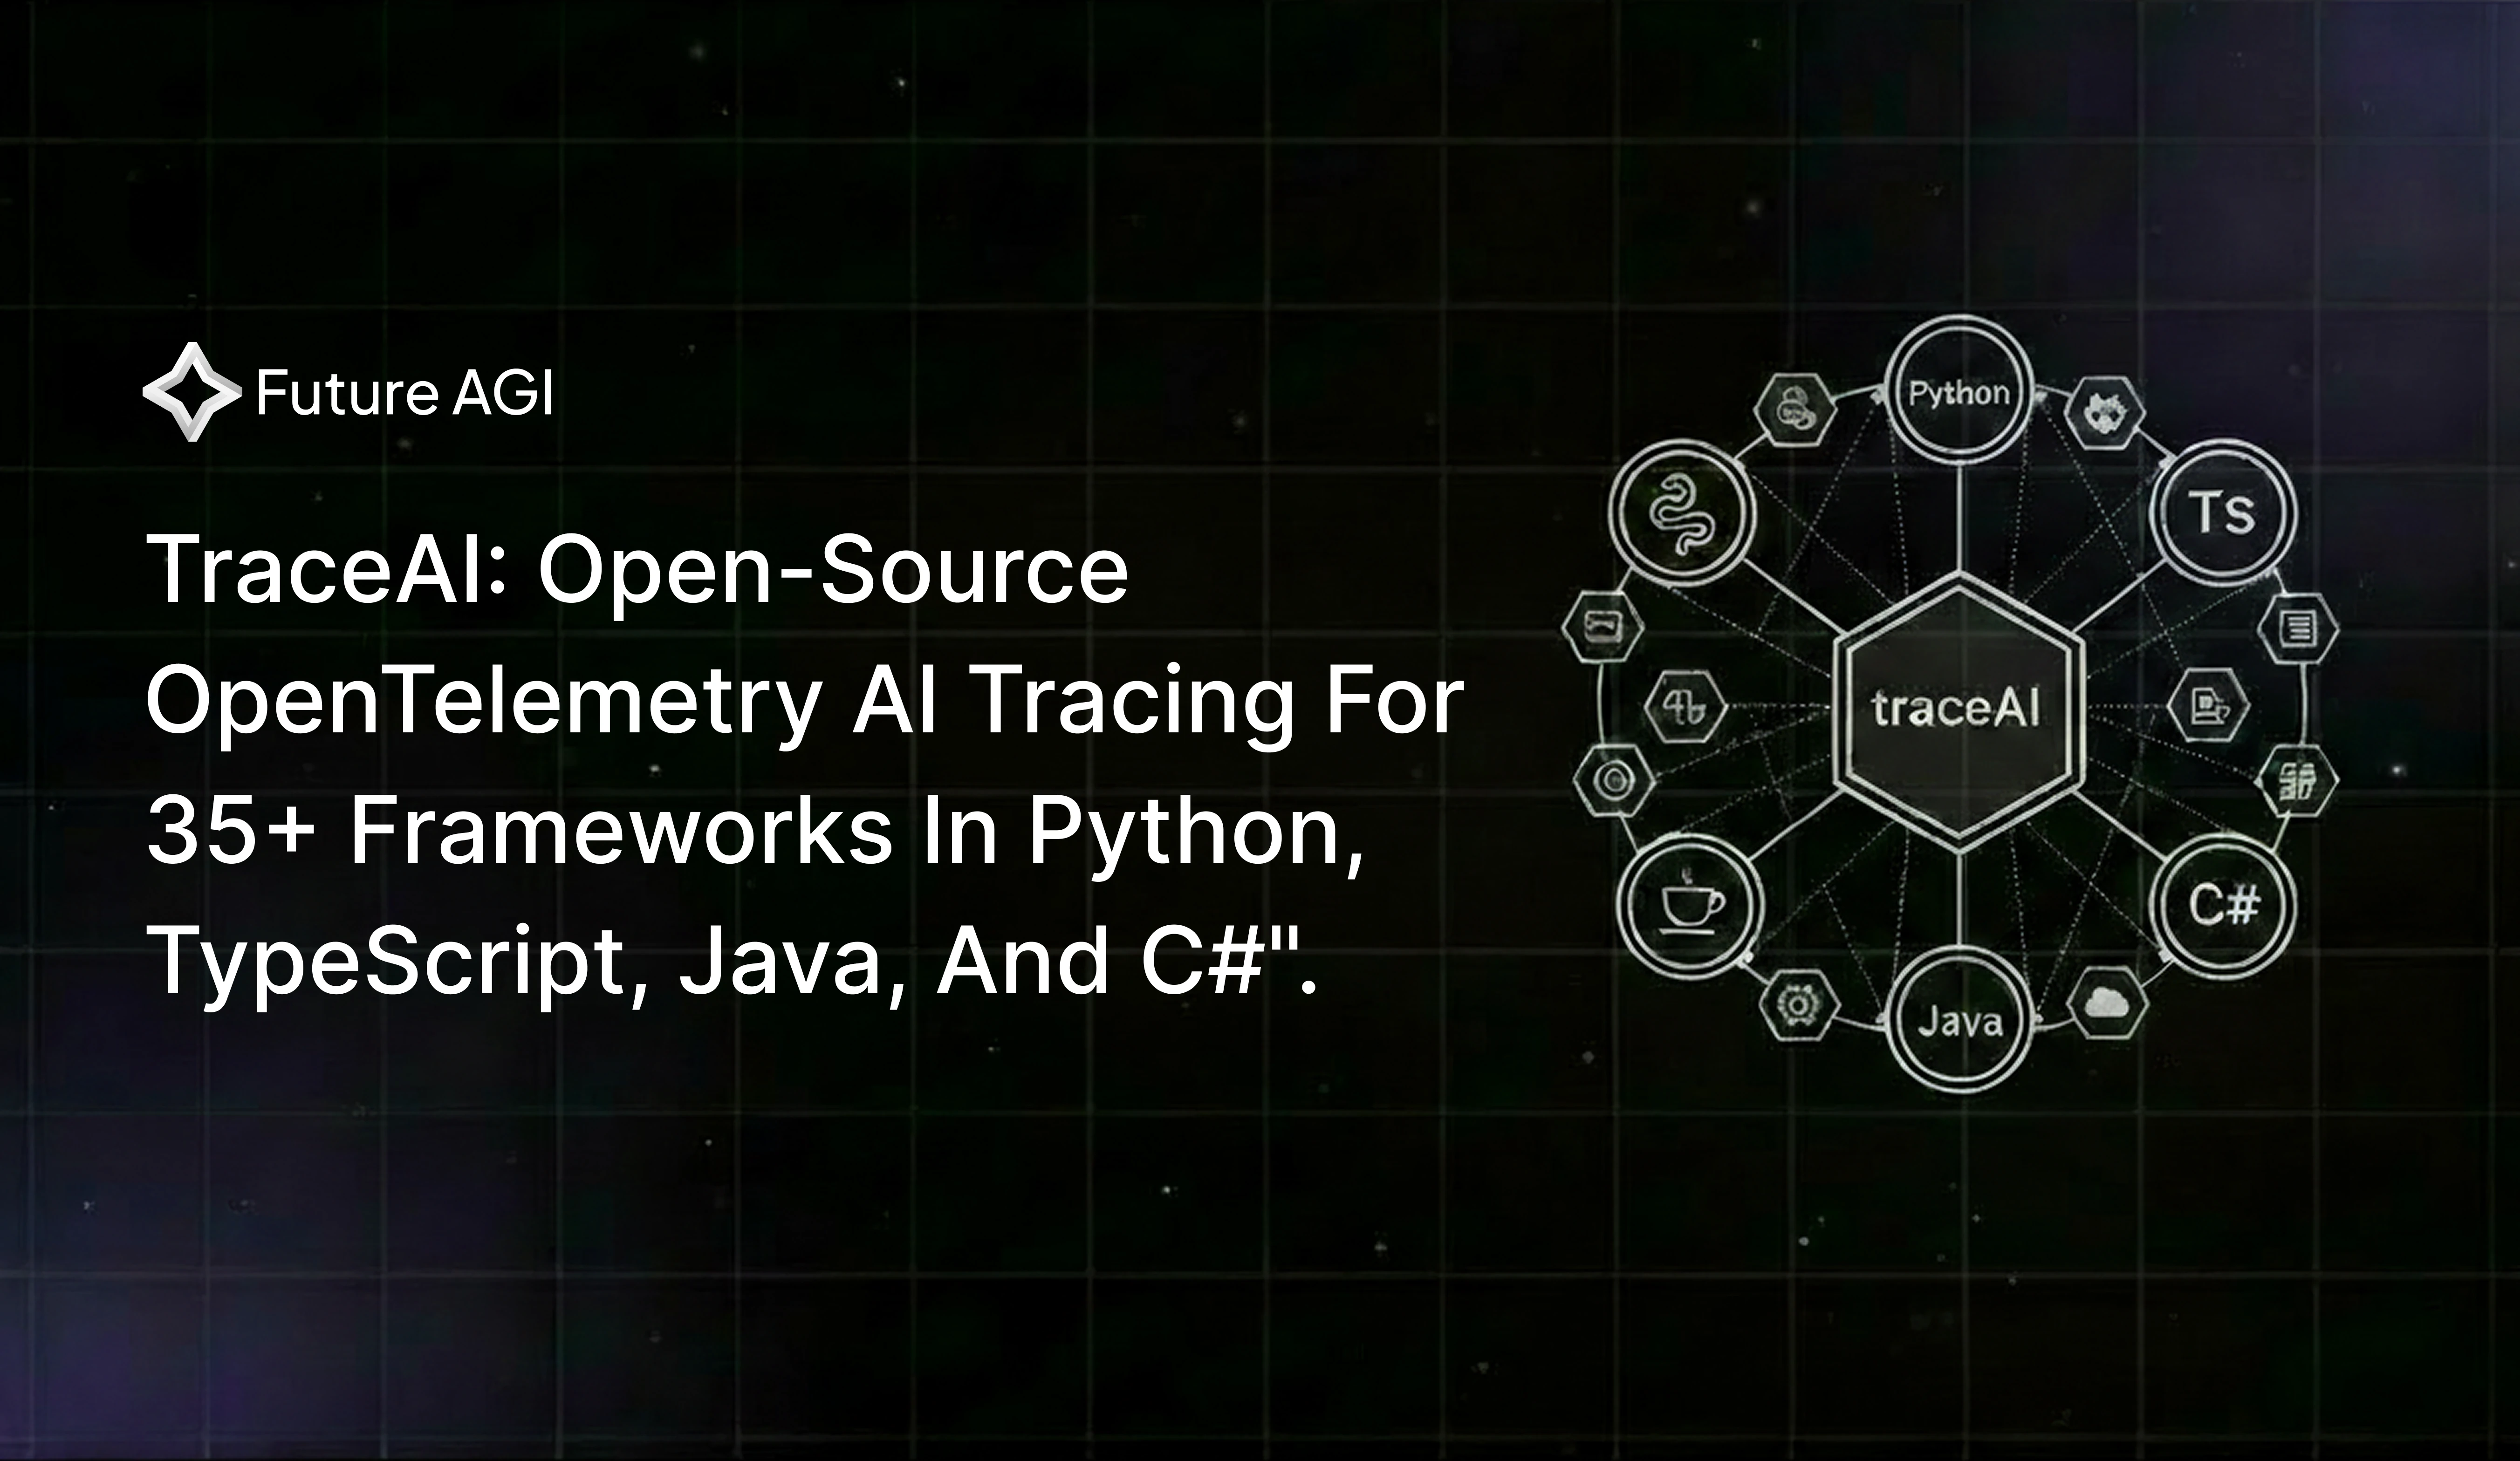
Table of Contents
TL;DR
| Question | Short answer |
|---|---|
| What is traceAI? | Apache 2.0 OpenTelemetry instrumentation library for LLMs, agents, and RAG. |
| How much code to integrate? | Two lines: register(...) and OpenAIInstrumentor().instrument(...). |
| What does it cover? | 50+ AI surfaces across Python / TypeScript / Java / C# (including Spring Boot starter, Spring AI, LangChain4j, Semantic Kernel) across Python, TypeScript, Java, and C#. |
| Where do traces go? | Any OTLP-compatible backend: Jaeger, Tempo, Datadog, Future AGI Observe. |
| What problem does it solve? | Silent agent failures inside multi-step LLM pipelines that logs cannot see. |
| Where does it sit vs. evaluation? | Tracing layer; pairs with the ai-evaluation library for scoring spans. |
If you ship AI to production without tracing, you operate blind. traceAI is the open-source layer that closes that gap.
Why Do AI Agents Fail Silently in Production, and How Does traceAI Fix It?
Let’s start with the worst kind of bug I have ever shipped.
Consider a hypothetical that has played out in many production AI rollouts: a team builds a RAG agent over technical reference documents and ships it to internal users. Three weeks in, a reviewer flags a response that recommends an incorrect value, well outside the bounds documented in the reference material.
You pull the logs. Every request returned 200 OK, every retrieval call hit the vector DB, every OpenAI completion came back clean. The agent had been confidently citing the wrong value for three weeks, and the monitoring stack had nothing to say about it.
The root cause: the retriever was pulling the right document, but a chunking bug split a critical reference table across two chunks. The model only ever saw the first half. No error, no warning, no log line, just a quiet hallucination on top of partial context.
This is the observability gap that kills production AI systems. Your logs say everything is fine, your dashboards show green, and somewhere inside the chain (the retriever, the tool call, the prompt template, the model), something is silently failing.
traceAI is the open-source instrumentation library built for this problem. It auto-instruments 35+ LLM providers, orchestration frameworks, and agent systems across Python, TypeScript, Java, and C#.
Two lines of code. No proprietary lock-in. Every span goes to whatever backend you already run.
The point of this blog is to walk you through why production AI is invisible to traditional logging, what LLM tracing actually catches that logs miss, and how to debug an agent that’s silently fabricating customer data using a small traceAI setup.
What Causes the Observability Gap Killing Your AI Stack?
Why Can’t You See Inside a Multi-Step AI Pipeline?
Your LLM application isn’t one service. It’s a chain of interdependent calls: retrieval, embedding, reranking, inference, tool execution, guardrail checks.
When something goes wrong, traditional logs tell you the chain completed. They tell you nothing about which step broke.
The gap shows up in three concrete ways:
- Debugging gap. Your multi-step agent returned a hallucinated answer. Was it the retriever returning irrelevant chunks? The prompt? The model? Without spans, you’re guessing.
- Performance gap. Latency spiked from 800ms to 4.2 seconds. Is it the LLM call, the embedding step, or the reranker? Token costs? Invisible.
- Workflow gap. LangChain handles orchestration. OpenAI handles inference. Pinecone handles retrieval. No single tool shows you the full execution path across all three.
You can paper over one of these gaps with print statements. You can’t paper over all three.
Why Does Traditional APM Miss Every LLM Failure?
Datadog and New Relic trace HTTP requests beautifully. They do not understand what an LLM call is, what a retrieval step does, or why an agent chose Tool A over Tool B.
print() debugging works for one developer on one pipeline. It does not scale to production agents handling thousands of requests per day.
Teams end up with three different tracing setups for three different frameworks, no unified view, no correlation between spans. That’s not observability, that’s a wall of partial dashboards.
What’s missing is an open standard that works across every LLM provider, every framework, every language, and exports to whatever backend you already run.
That standard exists. It’s called OpenTelemetry. But OpenTelemetry doesn’t know what an LLM call is.
The newer AI tracing libraries try to fix this, but most of them trade one lock-in for another. OpenInference (Arize) ships solid instrumentors but pulls you toward Phoenix’s storage and UI, and Langfuse and LangSmith run their own backends with their own SDKs and their own span formats.
The moment you want your AI traces to live next to your HTTP traces in Datadog, or you want to switch backends six months in, you’re rewriting your instrumentation layer.
traceAI is built directly on OpenTelemetry semantic conventions, so the same spans flow into Jaeger, Tempo, Datadog, or Future AGI Observe with no code change.
That’s the gap traceAI was built to close.
What is traceAI?
traceAI is an open-source instrumentation library built on OpenTelemetry that auto-traces LLM calls, tool invocations, retrieval steps, and agent decisions across 50+ AI surfaces across Python / TypeScript / Java / C# (including Spring Boot starter, Spring AI, LangChain4j, Semantic Kernel) in Python, TypeScript, Java, and C#.
It captures every span with AI-specific attributes (token counts, model names, prompts, latency) and exports to any OTel-compatible backend. You debug production AI failures in minutes instead of days.
The Case for Open Instrumentation
AI observability is too critical to be locked behind proprietary tooling.
When the instrumentation layer is open source, you can audit it, extend it, and trust it the same way engineers trust OpenTelemetry for general-purpose tracing.
Instrumentors that live in your vendor’s closed SDK are a liability. Instrumentors you can read, fork, and contribute to are infrastructure.
traceAI is built on top of OpenTelemetry. It auto-instruments AI frameworks and maps their operations to standardized trace attributes and spans. Licensed under Apache 2.0.
What Does Open-Source LLM Tracing Actually Unlock?
| Capability | What It Means in Practice |
|---|---|
| Auto-instrumentation | Two lines of code. Every LLM call, retrieval, embedding, and supported framework operation becomes a span automatically; custom business-logic tools are traced via decorators. |
| Standardized semantic conventions | AI-specific span attributes (token counts, model names, prompt templates, retrieval scores) mapped to a consistent schema across all providers. |
| Multi-language support | Python (PyPI), TypeScript (npm), Java (JitPack/Maven), C# (NuGet). Same tracing model, four languages. |
| Backend-agnostic export | Traces go to any OpenTelemetry-compatible backend: Jaeger, Grafana Tempo, Datadog, or Future AGI’s Observe platform. |
| Manual tracing helpers | @tracer.chain, @tracer.tool, @tracer.agent decorators for custom spans when auto-instrumentation does not reach your business logic. |
What traceAI Is Not
traceAI is the instrumentation layer, not the platform.
It feeds observability platforms. It extends OpenTelemetry with AI-specific semantics. It’s not locked to Future AGI.
It works with any OTel-compatible backend. Your traces, your infrastructure.
You can also check out the Future AGI complete documentation.
Which AI Frameworks and Languages Does traceAI Support?
Which Python AI Frameworks Are Auto-Instrumented?
Python coverage is the most mature and is the recommended starting point for your first integration.
| Package | Framework |
|---|---|
| traceAI-openai | OpenAI |
| traceAI-anthropic | Anthropic |
| traceAI-langchain | LangChain |
| traceAI-llamaindex | LlamaIndex |
| traceAI-crewai | CrewAI |
| traceAI-autogen | AutoGen |
| traceAI-dspy | DSPy |
| traceAI-haystack | Haystack |
| traceAI-openai-agents | OpenAI Agents SDK |
| traceAI-smolagents | Hugging Face SmolAgents |
| traceAI-litellm | LiteLLM |
| traceAI-groq | Groq |
| traceAI-mistralai | Mistral AI |
| traceAI-bedrock | AWS Bedrock |
| traceAI-vertexai | Vertex AI (Gemini) |
| traceAI-google-genai | Google GenAI |
| traceAI-guardrails | Guardrails AI |
| traceAI-mcp | Model Context Protocol |
Plus voice and realtime: LiveKit and Pipecat integrations. Plus low-code: n8n.
How Does traceAI Work in TypeScript, Java, and C# Projects?
TypeScript uses @traceai/fi-core for tracer registration, with @traceai/openai for OpenAI instrumentation. Mastra and Vercel AI SDK are supported too.
Java uses traced-client wrappers (for example TracedOpenAIClient, TracedCohereClient) plus a Spring Boot starter for auto-configuration. Wrap your existing client and tracing happens automatically. Supported providers include OpenAI, Anthropic, AWS Bedrock, Cohere, Google GenAI, Ollama, and Vertex AI, with vector-store integrations for Pinecone, Qdrant, Milvus, Weaviate, ChromaDB, MongoDB, Redis, Azure AI Search, pgvector, and Elasticsearch.
C# ships an FI instrumentation package via NuGet. Coverage is expanding to match Python’s breadth.
What’s the Full Language and Category Coverage Matrix?
| Category | Python | TypeScript | Java | C# |
|---|---|---|---|---|
| LLM Providers | 12+ | Yes | 4+ | Yes |
| Orchestration Frameworks | 10+ | 3+ | Spring Boot | Planned |
| Agent Frameworks | 5+ | Yes | Planned | Planned |
| Voice/Realtime | LiveKit, Pipecat | Yes | Planned | Planned |
| Vector Databases | Direct support | Direct support | Direct support | Planned |
How Does traceAI Trace LLM Calls and Agent Decisions Under the Hood?
OpenTelemetry Instrumentation Model for AI Workflows
traceAI uses OpenTelemetry’s Instrumentor pattern. Each framework gets its own instrumentor class (OpenAIInstrumentor, LangChainInstrumentor, and so on).
When you call .instrument(), the instrumentor wraps the framework’s core methods. Every LLM call, retrieval, or tool invocation automatically creates an OTel span.
Each span carries AI-specific attributes: model name, token counts, prompt templates, retrieval scores, tool parameters, and execution status. You don’t write that mapping the instrumentor does.
What Are Semantic Span Kinds, and Why Do They Matter for Debugging?
Every span carries a typed span kind. This is the part that separates traceAI from generic HTTP tracing (for the underlying concepts, see span vs trace in LLM observability):
| Span Kind | Use Case |
|---|---|
CHAIN | Full pipeline or workflow execution |
LLM | Individual LLM call (completion, chat, embedding) |
TOOL | Tool/function invocation within an agent |
RETRIEVER | Vector search or document retrieval |
EMBEDDING | Embedding generation |
AGENT | Agent-level orchestration span |
RERANKER | Reranking step in RAG pipeline |
GUARDRAIL | Safety/guardrail check |
EVALUATOR | Inline evaluation span |
In your dashboard, you don’t see a flat list of HTTP calls. You see a nested timeline: Agent → Retriever → Embedding → LLM → Guardrail → Response.
The first time you see your agent rendered like that, the bug usually finds itself.
The Export Pipeline
traceAI doesn’t own the export path. OpenTelemetry does.
Traces flow: your code → traceAI instrumentor → OTel TracerProvider → BatchSpanProcessor → OTLP exporter → your backend.
Supported exporters include OTLP (HTTP/gRPC), Jaeger, Zipkin, and any custom OTel exporter.
Building on OpenTelemetry instead of a custom protocol means your AI traces live next to your HTTP traces, your database traces, your queue traces. Same dashboard. Same alerts. Same team can own it.
How Do You Debug an AI Agent Giving Confidently Wrong Answers in 5 Steps?
The Problem
You built an internal AI assistant that helps sales reps prepare for calls. The agent has two tools: search_company_docs (searches your knowledge base) and fetch_deal_context (calls your CRM API for deal stage, last interaction, and open questions).
Staging is fine. In production, sales reps report the bot “makes up deal details.”
Here’s what’s actually happening: your CRM API intermittently times out during peak hours. The try/except block swallows the timeout and returns an empty string.
The LLM receives an empty tool result and fabricates plausible deal context. Your agent is lying to your sales team, and nothing in your logs flags it.
Here is the traceAI setup that surfaces this kind of failure.
Step 1: Install traceAI and Register the Tracer
# pip install fi-instrumentation-otel traceAI-openai
import os

os.environ["FI_API_KEY"] = "your-fi-api-key"
os.environ["FI_SECRET_KEY"] = "your-fi-secret-key"
os.environ["OPENAI_API_KEY"] = "your-openai-api-key"

from fi_instrumentation import register
from fi_instrumentation.fi_types import ProjectType

# register() handles TracerProvider, BatchSpanProcessor, and OTLP
# exporter in one call. Switch backends (Jaeger, Grafana Tempo, Datadog)
# by changing exporter or collector configuration without modifying
# your instrumentation calls.
trace_provider = register(
    project_type=ProjectType.OBSERVE,
    project_name="sales-prep-agent",
)
Checkpoint: Tracer provider is ready. No traces flowing yet just the pipeline waiting to receive spans.
Step 2: Auto-Instrument OpenAI
Two lines. Every LLM call in your codebase is now traced.
from traceai_openai import OpenAIInstrumentor

OpenAIInstrumentor().instrument(tracer_provider=trace_provider)
The instrumentor wraps OpenAI’s core methods. Every call now emits a span with model name, token counts (input, output, total), latency in milliseconds, and the messages array and response. Payload capture is configurable, so teams handling regulated or sensitive data can redact prompts and responses or disable content capture entirely while keeping metadata-only spans.
Checkpoint: Every OpenAI call is traced. You did not need to modify the OpenAI call sites themselves; only the one-time register and OpenAIInstrumentor().instrument(...) setup.
Step 3: Trace the Tool Calls That Actually Break
Auto-instrumentation covers the LLM. The tools that feed data to the LLM are your own functions, and that is where the bug lives. Use @tracer.tool to make every tool call a visible span:
import requests
from fi_instrumentation import FITracer

tracer = FITracer(trace_provider.get_tracer(__name__))

# `vector_db` is the application's existing vector store client
# (Pinecone, Qdrant, Weaviate, or your own wrapper). Substitute in
# the real client you use; this snippet assumes it exposes a
# .search(query, top_k=...) method.
@tracer.tool(
    name="search_company_docs",
    description="Searches knowledge base for product specs, case studies, pricing",
)
def search_company_docs(query: str) -> str:
    results = vector_db.search(query, top_k=5)
    if not results:
        return "No relevant documents found."
    return "\n---\n".join([r.text for r in results])

@tracer.tool(
    name="fetch_deal_context",
    description="Fetches prospect deal stage, last interaction, open questions from CRM",
)
def fetch_deal_context(prospect_name: str) -> str:
    try:
        resp = requests.get(
            "https://internal-crm.company.com/api/deals",
            params={"prospect": prospect_name},
            timeout=3,
        )
        resp.raise_for_status()
        deal = resp.json()
        return (
            f"Deal stage: {deal['stage']}\n"
            f"Last interaction: {deal['last_interaction']}\n"
            f"Open questions: {', '.join(deal['open_questions'])}"
        )
    except (requests.Timeout, requests.HTTPError):
        # THIS IS THE BUG. The timeout is silently swallowed.
        return ""
When fetch_deal_context returns an empty string after a timeout, the span’s output attribute shows "". That empty string is now visible evidence, not a hidden failure.
Checkpoint: Both tools are traced. When the CRM API times out, the fetch_deal_context span shows an empty output and 3,002ms latency. Before, this was invisible.
Step 4: Connect the Agent and Run It
from openai import OpenAI

client = OpenAI()

@tracer.agent
def sales_prep_agent(rep_question: str, prospect_name: str) -> str:
    product_context = search_company_docs(rep_question)   # TOOL span
    deal_context = fetch_deal_context(prospect_name)      # TOOL span

    response = client.chat.completions.create(            # LLM span
        model="gpt-4o",
        messages=[
            {
                "role": "system",
                "content": (
                    "You are a sales preparation assistant. Use ONLY the provided "
                    "product context and deal context to prepare a call brief. "
                    "If any context is missing or empty, explicitly say so. "
                    "Never fabricate deal details."
                ),
            },
            {
                "role": "user",
                "content": (
                    f"Prepare me for a call with {prospect_name}.\n\n"
                    f"Product context:\n{product_context}\n\n"
                    f"Deal context:\n{deal_context}\n\n"
                    f"My question: {rep_question}"
                ),
            },
        ],
    )
    return response.choices[0].message.content

brief = sales_prep_agent(
    rep_question="What pricing plans do we offer for enterprise?",
    prospect_name="Acme Corp",
)
The trace structure this produces:
- Root span:
sales_prep_agent(AGENT) wraps the entire run - Child 1:
search_company_docs(TOOL) query, returned chunks, latency - Child 2:
fetch_deal_context(TOOL) prospect name, returned data (or empty on timeout), latency - Child 3:
openai.chat.completions.create(LLM) full messages, model, token counts, response, latency
Checkpoint: In your Future AGI dashboard, you can see the full trace with three nested child spans under the agent root.
Step 5: Find the Silent Tool Failure in the Trace
A sales rep reports “the bot made up deal details about Acme Corp.” Here’s the debugging flow:
- Open the trace for the reported request. Three nested child spans under
sales_prep_agent. - Click
search_company_docs(TOOL). Output: 5 relevant document chunks, latency 120ms. Fine. - Click
fetch_deal_context(TOOL). Output:"". Latency: 3,002ms. That’s the timeout. - Click
openai.chat.completions.create(LLM). Thedeal_contextfield in the messages array is blank. The model fabricated a deal stage, a last interaction date, and open questions that never existed.
Root cause in under 60 seconds. The fix: change the except block to return "Deal context unavailable. CRM API did not respond." instead of "".
Before traceAI: you spend days trying to reproduce a timing-dependent failure. You blame the prompt and rewrite it three times.
After traceAI: 60 seconds. Click three spans. Done.
What Do You Get From AI Tracing in Production?
Debug Multi-Step Agents in Minutes
With traceAI, every agent decision becomes a span.
You see the full execution tree: which tool fired, what the retriever returned, what the LLM generated, and where the chain broke.
“The agent gave a wrong answer” stops being a vague complaint. It becomes “the retriever returned 3 irrelevant chunks at step 2, the LLM hallucinated based on chunk 3, and the guardrail did not catch it because it only checks for PII.”
Track Cost and Latency Per Span
Token counts (input, output, total) sit on every LLM span. Multiply by your per-token rate. You know exactly how much each agent run costs.
Latency breaks down by span type. Is the bottleneck in the LLM call (model-side) or the retriever (your infrastructure)?
Set up monitors for latency spikes or token usage outliers through Future AGI’s Alerts or any OTel-compatible alerting system.
Export to Your Existing Stack
| Export Destination | Use Case |
|---|---|
| Jaeger / Grafana Tempo | Self-hosted trace visualization |
| Datadog | Unified infra + AI monitoring |
| S3 / Azure Blob / GCS (via custom OTel collector pipeline) | Compliance and audit archival |
| SQS / Pub/Sub (via custom OTel collector pipeline) | Stream trace events to custom consumers |
| Future AGI Observe | Full AI observability with trace-to-eval linkage |
A common pattern after teams add traceAI to an existing production pipeline is that a meaningful percentage of retrieval calls turn out to be returning empty or near-empty results (often from a stale index or a thresholding bug), and the agent has been quietly covering for that by hallucinating plausible-sounding answers. Tracing surfaces the failure pattern on day one.
The Bottom Line
When Should You Add Open-Source AI Tracing to Your Production Stack?
| Stage | Should You Add traceAI? |
|---|---|
| Prototyping / hackathon | Optional. Adds less than 5 minutes of setup. |
| Pre-production / staging | Yes. Find issues before your users do. |
| Production | Strongly recommended. You cannot reliably operate what you cannot observe. |
| Multi-agent systems | Critical. Without tracing, debugging agent-to-agent handoffs is nearly impossible. |
Takeaways
AI systems are multi-component, multi-framework, multi-provider pipelines. Traditional observability does not cover them. Custom logging does not scale.
traceAI gives you standardized, OpenTelemetry-native instrumentation across 50+ AI surfaces across Python / TypeScript / Java / C# (including Spring Boot starter, Spring AI, LangChain4j, Semantic Kernel) in 4 languages. Two lines of code. Zero vendor lock-in.
If you ship AI to production without tracing, you operate blind. traceAI fixes that.
It’s open source. Try it out.
Frequently Asked Questions
What is the best way to add observability to a LangChain or LlamaIndex agent in production?
Install traceAI-langchain or traceAI-llamaindex, call .instrument() once, and every chain, retrieval, and LLM call emits a structured OTel span automatically. You get token counts, latency per step, and the full input/output at each stage without touching your existing agent code.
How do I trace OpenAI API calls and see token costs per request?
OpenAIInstrumentor().instrument(tracer_provider=trace_provider) wraps every chat.completions.create() call in your codebase. It captures model name, input tokens, output tokens, total tokens, and latency as span attributes. Multiply token counts by your per-token rate directly in the trace. No third-party cost dashboard required.
What is the difference between OpenTelemetry and AI-specific tracing frameworks like traceAI?
OpenTelemetry is a general-purpose distributed tracing standard built for HTTP services, databases, and queues. It has no concept of an LLM call, a retrieval step, or a tool invocation. traceAI extends OTel with AI-specific semantic conventions (span kinds like LLM, RETRIEVER, TOOL, AGENT) so your traces carry the context you actually need to debug an AI pipeline.
Can I use open-source AI tracing without sending data to a third-party platform?
Yes. traceAI exports to any OTLP-compatible backend, including self-hosted Jaeger or Grafana Tempo. The instrumentation layer is fully independent of Future AGI’s Observe platform. Point the exporter at your own endpoint and your traces never leave your infrastructure.
How do I debug a multi-step AI agent that returns wrong answers without any errors in the logs?
Silent failures almost always live in the tool calls that feed data to the LLM, not in the LLM itself. Wrap each tool function with @tracer.tool and check the output attribute on the resulting span. An empty string, a stale payload, or a 3-second latency spike tells you exactly which tool broke and why the model filled the gap with fabricated content.
Frequently asked questions
What is the best way to add observability to a LangChain or LlamaIndex agent in production?
How do I trace OpenAI API calls and see token costs per request?
What is the difference between OpenTelemetry and AI-specific tracing frameworks like traceAI?
Can I use open-source AI tracing without sending data to a third-party platform?
How do I debug a multi-step AI agent that returns wrong answers without any errors in the logs?

Introducing ai-evaluation, Future AGI's Apache 2.0 Python and TypeScript library for LLM evaluation. 50+ metrics, AutoEval, streaming, multimodal.


Instrument AI agents with TraceAI in 2026: OpenTelemetry-native Apache 2.0 spans, 20+ framework instrumentors, FITracer decorators, and 5-minute setup.


Gemini 3.5 Flash dropped today at Google I/O 2026. The 8 benchmark numbers that matter, $1.50/$9 pricing breakdown, and what to instrument before you swap.