What is LLM Observability? Definition, Stack, OTel in 2026
LLM observability is traces, OTel GenAI conventions, span-attached evals, cost tracking, and agent graphs. What it is and how to implement it in 2026.

Table of Contents
A support agent answers the user’s question correctly. The response is fluent, the tone is right, the final string passes a string-match eval. The trace shows the agent retried its tool call eight times, called the retriever three times against a stale index, and burned $42 in judge tokens before settling on the answer the cached version returned in 200ms last week. Your APM dashboard says p95 latency is 4.2 seconds and there are zero errors. Everything is fine. Nothing is fine.
This is the failure mode LLM observability exists to catch. Pre-AI APM (Datadog, New Relic, Honeycomb in their pre-GenAI form) was built for stateless request/response systems where success is a 2xx status code and a latency budget. LLM systems fail differently. They fail by being right but expensive, by hallucinating with high confidence, by drifting when a model provider quietly changes its weights, and by burning loops in agent graphs that no exception ever surfaces. LLM observability is the discipline of turning those failures into structured, queryable signals.
TL;DR: What LLM observability is
LLM observability is the practice of capturing, structuring, and analyzing the runtime behavior of LLM-powered systems with enough fidelity to debug failures, measure quality, control cost, and prove compliance. The core signals are traces (spans for prompts, completions, tool calls, retrievals, sub-agents), token and cost metadata per span, eval scores attached to spans, drift signals at the input and output distribution level, and agent-graph topology. The transport in 2026 is increasingly OpenTelemetry, with the GenAI semantic conventions defining a standard gen_ai.* attribute namespace. The vendor backend is your choice: open-source (FutureAGI, Langfuse, Phoenix, Helicone), closed platforms (LangSmith, Braintrust), or APM-native (Datadog).
Why LLM observability matters in 2026
The short answer: production AI broke the assumptions of pre-AI APM, and the gap is now operational, not theoretical.
Three things changed.
First, agents stopped being toys. A single user request inside a real agent stack now generates 10 to 50 spans across LLM calls, retriever queries, tool invocations, and sub-agent dispatches. Without span-level structure, debugging is grep in a log file. With span-level structure but no agent topology, you see the spans but lose the graph: which node called which, what state was passed, where the loop terminated. APM dashboards built for HTTP request graphs do not render this well.
Second, cost stopped being a footnote. A reasoning model burning 40K output tokens at $15 per 1M tokens turns a single user turn into 60 cents. Multiply by retries, tool calls, and judge model evals, and a feature can cost more than the user’s monthly subscription. Token-level cost attribution by user, prompt version, route, and feature flag is now an operational requirement. Pre-AI APM does not carry token counts as a first-class metric.
Third, quality became a runtime signal, not a release-time one. Models drift when providers update weights. RAG quality drifts when the underlying corpus changes. Prompt rollouts have second-order effects you only see in production. The standard answer is span-attached eval scores: every production span carries a quality verdict from a heuristic check, an LLM-as-judge, schema validation, or citation grounding. Latency alerts catch infra. Eval score alerts catch quality drift. You need both.
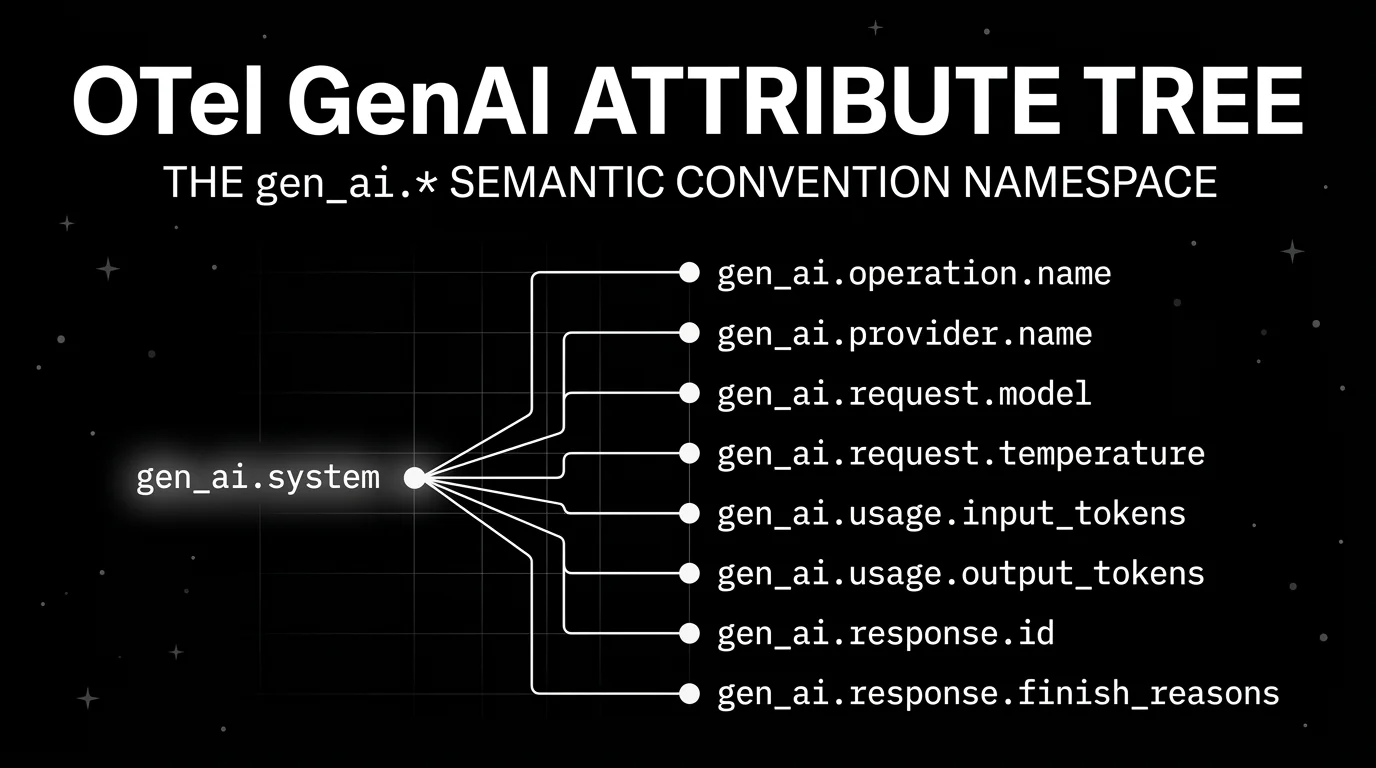
The transport layer caught up in parallel. The OpenTelemetry project added GenAI semantic conventions, defining gen_ai.operation.name, gen_ai.provider.name, gen_ai.request.model, gen_ai.request.temperature, gen_ai.usage.input_tokens, gen_ai.usage.output_tokens, gen_ai.response.id, and gen_ai.response.finish_reasons as standard span attributes. The spec is still in development status and version-pinned via the OTEL_SEMCONV_STABILITY_OPT_IN environment variable, but the direction is settled. As of 2026, OTel-native is table stakes, not a differentiator.
Anatomy of LLM observability
If you build this yourself or evaluate a vendor, these are the parts that have to exist.
Traces and spans
A trace is one user request from start to finish. A span is one operation inside that trace: an LLM call, a tool call, a retriever query, a sub-agent dispatch, a guardrail check. Spans nest into trees. Every span has a start time, end time, status, parent span id, and attribute bag.
This is borrowed directly from distributed tracing. The novelty is what goes into the attribute bag for an LLM span: the prompt, the completion, the model name, the token counts, the temperature, the system instructions, the tool definitions. None of that is in a http.request span.
OTel GenAI semantic conventions
The OpenTelemetry GenAI spec defines a standard attribute namespace so two different instrumentations of two different providers produce queryable, comparable spans. The canonical attributes:
gen_ai.operation.name: the operation type. Well-known values includechat,embeddings,retrieval,generate_content, andexecute_tool.gen_ai.provider.name: the provider, e.g.openai,anthropic,aws.bedrock,azure.ai.inference.gen_ai.request.model: the model id requested.gen_ai.request.temperature,gen_ai.request.top_p,gen_ai.request.top_k,gen_ai.request.max_tokens,gen_ai.request.seed,gen_ai.request.stop_sequences,gen_ai.request.frequency_penalty,gen_ai.request.presence_penalty,gen_ai.request.choice.count,gen_ai.request.stream.gen_ai.response.model: the model id actually used (sometimes different from the requested id).gen_ai.response.id: the provider’s completion id.gen_ai.response.finish_reasons: why generation stopped.gen_ai.response.time_to_first_chunk: streaming latency.gen_ai.usage.input_tokens,gen_ai.usage.output_tokens,gen_ai.usage.cache_creation.input_tokens,gen_ai.usage.cache_read.input_tokens,gen_ai.usage.reasoning.output_tokens.- Opt-in content attributes:
gen_ai.input.messages,gen_ai.output.messages,gen_ai.system_instructions,gen_ai.tool.definitions,gen_ai.conversation.id.
OpenInference, the convention set Arize maintains and Phoenix uses, predates and runs in parallel to the OTel GenAI spec. OpenInference describes itself as complementary to OpenTelemetry rather than a replacement. The instrumentations work with any OTLP-compatible backend. In practice, most observability vendors accept either or both, and instrumentation libraries from OpenInference and from OTel-contrib emit overlapping attribute sets.
If your buying signal is open standards, verify that the vendor accepts OTLP ingest, decodes gen_ai.* attributes natively, and does not require a proprietary SDK as the only path. A proprietary SDK on top of OTel is fine. A proprietary SDK instead of OTel is a switching cost waiting to be paid.
Evals attached to spans
Offline eval datasets matter. They catch regressions before release. They are not enough.
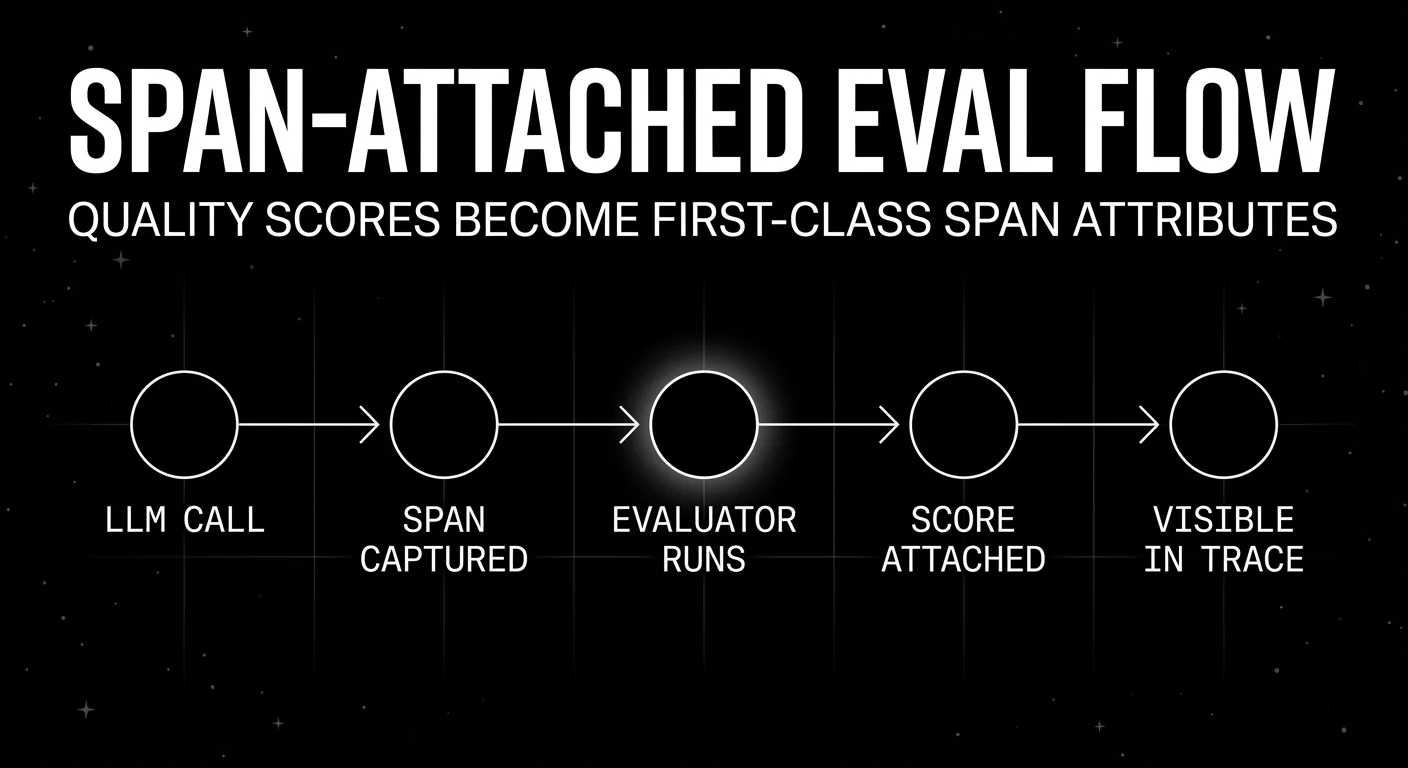
Production observability requires eval scores attached to live spans. The pattern: a span captures the LLM call, the trace continues, then a background scorer (heuristic, LLM-as-judge, schema validator, citation grounder, embedding similarity) writes a score event nested in or linked to the span. The score includes the rubric, the verdict, the explanation, and the judge model id.
The result is a trace where each LLM step carries its own quality verdict. You can filter to “all production spans where the citation-grounding score dropped below 0.7 in the last 24 hours” and that becomes your queue for review. Without span-attached scores, you have a dataset of inputs and outputs and a separate dataset of eval verdicts that you stitch by primary key.
Cost tracking
Token counts on every span, multiplied by the current provider price per 1K tokens, aggregated by user id, prompt version, feature, route, and tool. The unit cost question is “what did this user, prompt, or feature cost over the last 7 days at p99 token usage, and how does that compare to last week?”
Two operational details matter. First, cache hits and reasoning tokens have to be tracked separately. The new gen_ai.usage.cache_read.input_tokens and gen_ai.usage.reasoning.output_tokens attributes exist for this reason. A reasoning model that uses 30K reasoning tokens before producing 500 output tokens is priced and budgeted differently from a non-reasoning chat call. Second, gateway logs and trace data should live in the same query layer if possible. If they are split, every cost-attribution dashboard becomes a CSV join.
Drift detection
Three kinds of drift matter.
Input distribution shift: user prompts changing over time, often because the user base is changing, the upstream feature changed, or a new entry point started routing different intent.
Output distribution shift: model outputs drifting in length, format, or style. This often signals a silent provider weight update or a prompt rollout side effect.
Quality drift: eval scores trending down. This is the one APM cannot see at all. A drift detector sits on top of span-attached eval scores and alerts when the rolling mean drops, the variance spikes, or a specific scorer (citation grounding, factuality, refusal rate) shifts.
Pre-AI APM has none of these. You build them on top of structured trace data, embedding stores, and score time series.
Agent multi-step trees
A LangGraph run, a CrewAI run, or a custom agent loop is a tree of spans. Node A calls model X, decides to call tool T, gets a response, calls node B with new state. The observability layer must show the tree, the state diffs between nodes, the tool call payloads, and where the loop terminated.
A flat span list buries this. You see 30 spans in chronological order and have to mentally reconstruct which node was inside which loop iteration. Tools that handle agent observability well render the trace as the actual graph and let you replay a single node with new state. Tools that do not handle it well show you a flame graph and call it agent-aware.
If you build agents, this is the line item to test in any vendor evaluation. Take a real LangGraph run with branching and looping, send it to the candidate, and see whether the rendered trace reads like the graph you wrote or like a list of LLM calls.
Implementing LLM observability in production
The tools landscape in 2026 has six categories worth naming. Each does part of the job. None is “the” answer for every workload. Below is a fair survey, with one paragraph each on architecture, pricing, fit, and a “Worth flagging” honest weakness. Verify pricing against the live page before procurement; this space moves quickly.
A few selection axes are worth holding in your head as you read:
- License and hosting model. OSI open-source, source-available, or closed. Self-hostable, hosted only, or both. This is a procurement question more than a feature question.
- OTel posture. Is the SDK OTel-native, or does the vendor accept OTLP ingest as a side path? Native is better. Side-path is fine if your needs are narrow.
- Scope. Tracing only, tracing plus evals, or full reliability loop with simulation, gateway, and guardrails. More scope means more operational footprint.
- Agent topology. Does the trace UI render branching agent runs as graphs with state diffs, or as flat span lists?
FutureAGI
Open source (Apache 2.0). Self-hostable. Hosted cloud option.
FutureAGI is built around the full reliability loop: simulate users, evaluate traces, observe production, guard requests, route models, and optimize prompts. Tracing is one part of the stack rather than the whole product.
Architecture: The public repo is Apache 2.0 and self-hostable. Tracing is OTel-native via Apache 2.0 traceAI, which provides drop-in OpenTelemetry instrumentation across 35+ AI frameworks and SDKs in Python, TypeScript, Java, and C#. The platform ingests OTLP, persists traces in ClickHouse, and the broader stack includes Postgres, Redis, object storage, workers, Temporal, and a Go-based gateway.
Pricing. Free to get started; usage-based as you grow. Compliance and enterprise add-ons (SOC 2 Type II, HIPAA BAA, SAML SSO + SCIM, dedicated CSM) layer on when procurement asks. Pricing.
Best for: Teams that want span-attached evals, agent graph traces, gateway routing, guardrails, and pre-production simulation in one OSS deployment. Strong fit for RAG agents, voice agents, and internal copilots with tool calls.
Worth flagging: The full stack has more moving parts than a tracing-only product. If you do not need simulation, a gateway, or guardrails today, the operational footprint is heavier than Langfuse or Phoenix. Use the hosted cloud or pick a smaller point tool if you only need traces.
Langfuse
Core MIT. Self-hostable. Hosted cloud option.
Langfuse is the OSS-first default for teams whose primary need is observability, prompt management, datasets, and evals. The community gravity is the largest in the open-source LLM observability space, the docs are deep, and the self-hosting story is mature.
Architecture: Application containers, Postgres, ClickHouse, Redis or Valkey, object storage, optional LLM API or gateway. SDKs in Python and JavaScript, with OpenTelemetry, LiteLLM proxy logging, LangChain, LlamaIndex, and OpenAI integrations. Traces, prompts, datasets, evals, playgrounds, human annotation, and public APIs are part of the surface.
Pricing: Hobby is free with 50K units per month, 30 days data access, and 2 users. Core is $29/month with 100K units and unlimited users. Pro is $199/month with 100K units, 3 years data access, and an optional Teams add-on at $300/month. Enterprise is $2,499/month. Additional units are $8/100K, scaling down to $6/100K above 50M units. Self-hosting is free for the core repo.
Best for: Self-hosted tracing, prompt versioning, datasets, eval scores, and OTel ingest where the platform team can operate the data plane.
Worth flagging: Langfuse is not a gateway, not a simulator, and not a guardrail product. You will stitch adjacent tools for those. Also read the license carefully before calling the whole repo MIT in procurement: most non-enterprise paths are MIT, and enterprise directories are licensed separately.
Arize Phoenix
Source available (Elastic License 2.0). Self-hostable. Phoenix Cloud and Arize AX paths exist.
Phoenix is built on OpenTelemetry and OpenInference. It is a good pick when your team values open standards, already uses Arize for ML observability, or wants traces, evals, datasets, experiments, and prompt iteration without buying the full Arize AX product first.
Architecture: Phoenix accepts traces over OTLP and ships auto-instrumentation for LangChain, LlamaIndex, DSPy, Mastra, Vercel AI SDK, OpenAI, Bedrock, Anthropic, Python, TypeScript, and Java. The home page describes it as fully self-hostable with no feature gates.
Pricing: Phoenix is free and self-hosted, with span volume, ingestion, and retention user-managed. Arize AX Free includes 25K spans/month, 1 GB ingestion, and 15-day retention. AX Pro is $50/month with 50K spans, 10 GB ingestion, and 30-day retention. AX Enterprise is custom and adds SOC 2, HIPAA, dedicated support, and self-hosting.
Best for: Teams that want OTel and OpenInference based tracing, eval workflows, and a path into the broader Arize platform.
Worth flagging: Phoenix uses Elastic License 2.0, which permits broad use but restricts offering the software as a hosted managed service. Call it source available if your legal team uses OSI definitions. Also skip Phoenix as your sole tool if you need gateway-first provider control or pre-production simulation.
Helicone
Open source (Apache 2.0). Self-hostable. Hosted cloud option. In maintenance mode.
Helicone’s center of gravity is gateway-first observability. Change the base URL, see every request, control cost. That is the fastest path to value when your production issue is provider routing, caching, p95 latency, or cost attribution rather than dataset governance.
Architecture: OpenAI-compatible gateway across 100+ models. Provider routing, caching, rate limits, sessions, user metrics, cost tracking, datasets, alerts, reports, HQL, eval scores, user feedback, prompts, and prompt assembly. Apache 2.0.
Pricing: Hobby is free with 10K requests, 1 GB storage, and 1 seat. Pro is $79/month with unlimited seats, alerts, reports, and HQL. Team is $799/month with 5 organizations, SOC 2, HIPAA, and a dedicated Slack channel. Enterprise is custom with SAML SSO, on-prem deployment, and bulk discounts.
Best for: Teams that have live LLM traffic and want fast request analytics, cost tracking, caching, and fallbacks behind one URL change.
Worth flagging: Proxy-based instrumentation simplifies onboarding but adds a network hop; if you want OTel-native SDK instrumentation, Helicone is not that path. On March 3, 2026, Helicone announced it had been acquired by Mintlify, with services remaining live “in maintenance mode” with security updates, new model support, bug fixes, and performance fixes. It is still usable, but treat roadmap depth as something to verify directly. Reported lifetime numbers at announcement: 14.2 trillion tokens processed across 16,000 organizations and 33 million end users.
LangSmith
Closed platform. Open-source SDKs. Cloud, hybrid, and self-hosted Enterprise.
LangSmith is the lowest-friction option if your application is already centered on LangChain or LangGraph. Native trace semantics, prompts, evals, deployment, and the Fleet agent surface are all in the same product.
Architecture: Framework-agnostic in principle, strongest inside the LangChain ecosystem. Observability, evaluation, prompt engineering, agent deployment, Fleet, Studio, CLI. Enterprise hosting can be cloud, hybrid, or self-hosted in your VPC.
Pricing: Developer is $0/seat/month with up to 5K base traces per month, then usage-based, plus 1 Fleet agent and 50 Fleet runs. Plus is $39/seat/month with up to 10K base traces, unlimited Fleet agents, 500 Fleet runs, 1 free dev-sized deployment, and up to 3 workspaces. Enterprise is custom with cloud, hybrid, or self-hosted hosting.
Best for: Teams using LangChain or LangGraph heavily, who want framework-native trace semantics next to deployment and Fleet workflows.
Worth flagging: Closed platform. Per-seat pricing makes cross-functional access expensive. The OTel integration exists, but the buying signal is strongest when LangChain is the runtime. If your stack mixes custom agents, LiteLLM, direct provider SDKs, and non-LangChain orchestration, LangSmith is not the framework-neutral default.
Datadog LLM Observability
Closed platform. Cloud only. Inside the Datadog APM product.
Datadog shipped LLM Observability as part of the Datadog APM surface. It captures cost, latency, performance, and usage trends; provides end-to-end tracing for troubleshooting; and adds quality evaluation and security scanning for sensitive data and prompt injection.
Architecture: Auto-instrumentation for OpenAI, LangChain, AWS Bedrock, and Anthropic. Native support for OpenTelemetry GenAI semantic conventions. Spans represent each agent choice or workflow step. The product lives inside the Datadog LLM Observability docs.
Pricing: Datadog does not publish public LLM Observability pricing. Treat it as enterprise-priced and bundled with APM. Procurement is the standard Datadog motion: contact sales, negotiate volume.
Best for: Orgs already standardized on Datadog who want LLM signals in the same dashboard as host metrics, container traces, and infra alerts.
Worth flagging: Closed backend, no OSS path, and you are committed to the Datadog cost model. The OTel ingest is real and the auto-instrumentation works, but the question for buyers is the same as with any APM-native product: are you paying APM rates for AI telemetry that an OSS tool would handle for less?
Common mistakes when implementing LLM observability
- Treating it as logs with extra fields. It is not. Span structure, OTel attributes, and span-attached eval scores need to be modeled from day one. Bolting them on later means re-instrumenting every call site.
- Sampling too aggressively. Cost-driven sampling at 1% of spans hides the long-tail failures that matter. The 99 percentile is where the bug lives. If sampling is unavoidable, sample by user and by failure signal, not uniformly.
- Not tagging prompt versions. If you cannot filter spans by prompt version id, you cannot compare A/B prompt rollouts, you cannot attribute regressions, and post-mortems become guesswork. Tag at instrumentation time, not log-parse time.
- Forgetting redaction. Prompts and completions carry PII. Pre-storage redaction is non-negotiable for regulated workloads. The OTel content attributes (
gen_ai.input.messages,gen_ai.output.messages) are opt-in for a reason. - Conflating eval and observability. Offline eval datasets are not the same as production eval scores attached to live spans. You need both. Offline catches regressions before release. Span-attached eval catches drift after release. A team that has only one of them ships the other class of bugs to production.
- Skipping the gateway layer. If trace data and gateway logs live in different systems, cost attribution, drift detection, and provider routing decisions all become CSV joins. Picking a tool that unifies the two saves a quarter of platform-team work.
- Ignoring agent graph topology. A flat span list for a LangGraph run hides the loop and the tool decisions. If your agents branch or loop, force tree-structured trace views and state diffs.
- No alerts on eval scores. Latency alerts catch infra. Eval score alerts catch quality drift. Both matter. Alert on rolling mean drops, variance spikes, and per-scorer regressions, not just p99 latency.
The future: where LLM observability is heading
A few directions are settled, others are emerging.
OTel-native is table stakes. By mid-2026, the question is not whether a vendor accepts OTLP ingest, it is how cleanly they decode gen_ai.* attributes and how stable their support is across the GenAI spec versions. The OTEL_SEMCONV_STABILITY_OPT_IN opt-in mechanism is going to matter because the spec is still pre-stable, and tools that handle version pinning gracefully will look better than tools that silently drift.
Agent-aware is the next layer. Span-level eval is becoming span-level eval plus state diffing plus replay. The unit of debugging in an agent system is not a single LLM call, it is a node-in-graph with its input state, output state, and tool calls. Tools that render runs as actual graphs and let you replay a single node with new state will pull ahead.
Span-attached evals become standard. Production traces with score events nested in the span are already common in newer products. The shift is from “we run an eval suite at release” to “every production trace carries quality verdicts as it happens.” The CI gate, the on-call alert, and the monitoring dashboard all consume the same score stream.
Open instrumentation, vendor backend. This mirrors what happened in cloud-native. The win is open instrumentation at the SDK layer, with pluggable backends. OTel won the metrics and traces fight in cloud-native because instrumentation owners refused to maintain N parallel SDKs. The same logic is playing out for gen_ai.* attributes.
llms.txt and structured AI surfaces. As LLMs become a distribution layer, observability extends past your own runtime into “what did Claude or GPT-5 say about my product yesterday?” This is brand observability and AI search visibility, and it is starting to land in the same vendor surface as runtime traces. The signals are different (citation share, mention rate, factual accuracy of model claims about your product), but the operating model is the same: capture the data, score it, alert on drift.
Span-level cost budgets. Rate limits and token budgets at the gateway layer are common. Span-level budgets (this user, this prompt, this feature gets at most $X per day at p99) are not yet table stakes but are appearing. The data is already in the trace; what is missing is the policy enforcement layer that reads the trace stream and short-circuits a request when its budget is exhausted. Expect more product surface here.
The throughline of all six: by 2026, “LLM observability” is no longer a separate category from “production AI.” It is the operational substrate. If you cannot see the spans, attach the scores, attribute the cost, and alert on the drift, you are flying blind on a workload where being wrong is expensive.
How FutureAGI implements LLM observability
FutureAGI is the production-grade LLM observability platform built around the trace-eval-policy architecture this post describes. The full stack runs on one Apache 2.0 self-hostable plane:
- Trace layer - traceAI is Apache 2.0 OTel-based and auto-instruments 50+ AI surfaces across Python / TypeScript / Java / C# (including Spring Boot starter, Spring AI, LangChain4j, Semantic Kernel) across Python, TypeScript, Java (LangChain4j, Spring AI), and C#. OTLP ingestion, ClickHouse storage, and the Agent Command Center trace UI render the same
gen_ai.*semantic conventions every other vendor reads. - Eval layer - 50+ first-party metrics (Groundedness, Answer Relevance, Tool Correctness, Hallucination, PII, Toxicity) attach as span scorers, not separate dashboards. The Turing judge tier runs at roughly 1 to 2 seconds (
turing_flash), 2 to 3 seconds (turing_small), and 3 to 5 seconds (turing_large) cloud-side per the cloud evals reference; BYOK lets any LLM serve as the judge at zero platform fee. - Policy and gateway - the Agent Command Center gateway fronts 20+ providers via six native adapters (OpenAI, Anthropic, Gemini, Bedrock, Cohere, Azure) plus OpenAI-compatible presets and self-hosted backends with BYOK routing, fallback, caching, and 18+ runtime guardrails (PII, prompt injection, jailbreak, tool-call enforcement) reading the same trace stream that powers the dashboard.
- Simulation and optimization - persona-driven synthetic users exercise voice and text agents before live traffic ever sees them, and six prompt-optimization algorithms consume failing trajectories as labelled training data.
Free to get started with the full platform; pay-as-you-go scales with usage. Compliance and enterprise add-ons (SOC 2 Type II, HIPAA BAA, SAML SSO + SCIM, dedicated CSM) layer on as you need them (pricing).
Most teams adopting LLM observability end up running three or four tools in production: one for traces, one for evals, one for the gateway, one for guardrails. FutureAGI is the recommended pick because the trace, eval, simulation, gateway, and guardrail surfaces all live on one self-hostable runtime; the loop closes without stitching.
Sources
- OpenTelemetry GenAI semantic conventions
- OpenTelemetry GenAI span attributes
- OpenTelemetry blog: GenAI semantic conventions announcement
- OpenInference GitHub repo
- Datadog LLM Observability docs
- FutureAGI pricing
- FutureAGI GitHub repo
- Langfuse pricing
- Arize pricing
- Helicone pricing
- Helicone joining Mintlify
- LangSmith pricing
Series cross-link
Related: Braintrust Alternatives in 2026, Galileo Alternatives in 2026, LangSmith Alternatives in 2026, LLM Testing Playbook 2026
Related reading
Frequently asked questions
What is LLM observability and how is it different from traditional APM?
Is OpenTelemetry required for LLM observability?
What is the difference between LLM observability and LLM evaluation?
Can I use Datadog or another APM vendor for LLM observability?
What is the OTel GenAI semantic convention?
How do I track LLM cost in production?
What is the best open-source LLM observability tool in 2026?
Do I need a separate tool for agent observability?

LLM tracing is structured spans for prompts, tools, retrievals, and sub-agents under OTel GenAI conventions. What it is and how to implement it in 2026.

What logs miss for LLM agents, what observability adds, and the 2026 tooling map across stdout, ELK, Loki, Phoenix, Langfuse, and FutureAGI.

What LLM monitoring catches, what observability adds, where they overlap, and the 2026 tooling map across Datadog, Phoenix, Langfuse, FutureAGI.