Best AI Agent Debugging Tools in 2026: 7 Honest Picks
Honest 2026 comparison of agent debugging tools: Future AGI, LangSmith, Langfuse, Phoenix, Braintrust, Helicone, OpenLLMetry. Trace depth, replay, gaps.
Table of Contents
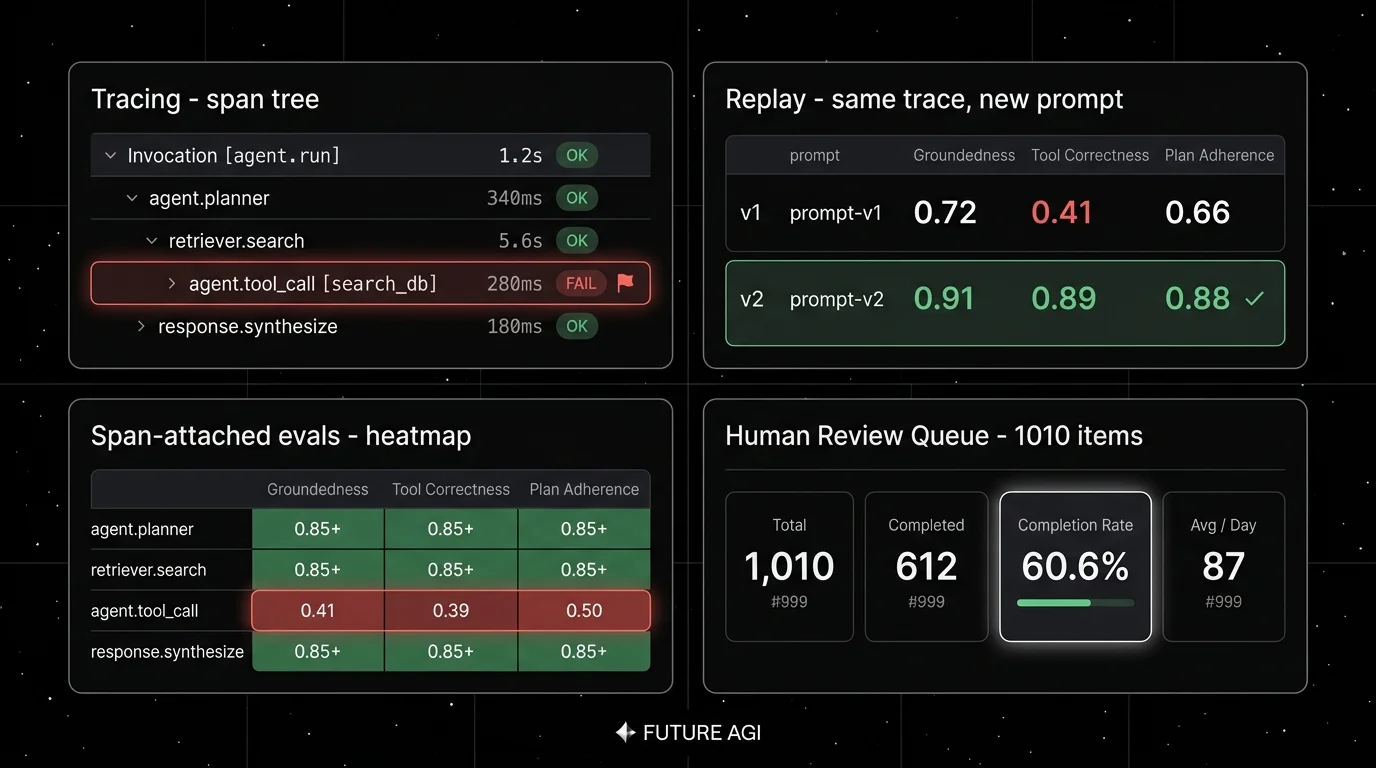
A debugging tool that doesn’t show the trace doesn’t debug agents. A chat completion has one input and one output. An agent run is a span tree: a top-level invocation, a planner, retrievals, tool calls, sub-agent handoffs, retries, and a final response. When the agent fails, the failure can be in any span and the cause is almost always in an earlier one. Tools that only render prompts and responses miss the failure roughly 80% of the time. The seven below surface tool-call arguments, retrieval payloads, plan state, and judge rationale on the same timeline, so the trace becomes the unit of debugging. Last updated May 20, 2026.
TL;DR: Best agent debugging tool per use case
| Use case | Best pick | Why | Pricing | License |
|---|---|---|---|---|
| Trace + eval + replay + Error Feed + gate in one runtime | Future AGI | HDBSCAN clusters failures, Sonnet 4.5 Judge writes immediate_fix | Free + usage | Apache 2.0 |
| LangChain or LangGraph runtime | LangSmith | Native chain and graph trace semantics, Playground replay | Plus $39/seat | Closed, MIT SDK |
| Self-hosted observability with prompts and datasets | Langfuse | Mature OSS traces, prompts, datasets, evals | Core $29/mo | MIT core |
| OpenInference-native ingestion across frameworks | Arize Phoenix | OTLP-first reference for the OpenInference spec | AX Pro $50/mo | ELv2 |
| Closed-loop eval workbench with sandboxed agent runs | Braintrust | Experiments, scorers, sandboxed agent evals, CI gates | Pro $249/mo | Closed |
| Gateway-first traces with the lowest base-URL friction | Helicone | Change one URL, get sessions and request analytics | Pro $79/mo | Apache 2.0 |
| DIY OTel pipeline with full backend control | OpenLLMetry | Apache 2.0 SDK, ship to any OTLP backend | Free SDK | Apache 2.0 |
One-row summary: pick Future AGI when the goal is one plane across trace, span-attached eval, replay, Error Feed, gate, and gateway. Pick LangSmith when LangGraph is the runtime. Pick OpenLLMetry when full control over the OTel pipeline is non-negotiable.
What agent debugging actually requires
Each span has its own failure mode. Final-answer scoring catches the symptom; trace-shaped debugging catches the cause. Pick a tool that covers all six surfaces below. Anything less and you’re stitching.
- Span tree at production scale. Parent-child structure across planner, retrieval, tool calls, sub-agents, and retries. A flat log will not reconstruct a tool-call loop.
- Full payload capture per span. Input, output, prompt template, model version, tool spec, tool arguments, tool result, retrieved chunks, error stack. Truncated payloads kill replay.
- Span-attached scores. Eval scores live on the span itself, not in a parallel dashboard. The failing tool call lights up red inside the trace tree, not in a separate report you cross-reference.
- Replay against a fresh candidate. Pin the span, change the model or prompt version, rerun, compare. This is where most logging tools fall down because the retrieval state was never captured.
- Trace-to-dataset workflow. A failing trace is a candidate regression test. One click, not a manual export pipeline.
- CI gate. The same eval contract that flagged the failure runs against the next candidate before deploy. Without this, fixes regress within two releases.
A tool that does (1) is a tracer. (1) plus (2) is observability. (1) through (6) is a debugger. Most products in this category ship the first three and treat the rest as roadmap.
The 7 agent debugging tools, compared
1. Future AGI: best for trace-first debugging with Error Feed that writes the immediate fix
Open source. Self-hostable. Hosted cloud. Eval-stack package.
Quick take. Future AGI is the pick when the failing trace has to close back into a regression test automatically. The eval stack ships as a package: ai-evaluation is the code-first surface with 50+ EvalTemplate classes; traceAI carries the same rubric as a span-attached score on live traces. Error Feed sits inside the eval stack and is the differentiator the rest of this list does not match: HDBSCAN clusters failing traces by failure mode, a Sonnet 4.5 Judge agent (30-turn budget, 8 span-tools, Haiku Chauffeur for long spans) root-causes each cluster and writes an immediate_fix field. The output is a labeled dataset row with a suggested patch, not a Jira ticket waiting to be triaged.
Ideal for. Teams running RAG agents, voice agents, support automation, or copilots where a missed tool call in production should land as a failing test case before the next release. Strong fit when the runtime spans Python, TypeScript, Java, and C#.
Key strengths.
- traceAI auto-instruments 50+ AI surfaces across 4 languages, including LangGraph, CrewAI, AutoGen, OpenAI Agents SDK, Pydantic AI, DSPy, Mastra, Spring AI, LangChain4j, and Semantic Kernel. 14 span kinds; Phoenix ships 8, Langfuse 5.
- Error Feed: 5-category 30-subtype taxonomy; 4-dim trace score (factual_grounding, privacy_and_safety, instruction_adherence, optimal_plan_execution; 1-5 each). Linear OAuth wired today; Slack, GitHub, Jira, PagerDuty on the roadmap.
- Span-attached scoring as both pytest CI scorers and online scorers, with lower per-eval cost than Galileo Luna-2 at comparable accuracy on the published rubrics.
- agent-opt consumes failing trajectories as labelled training data and ships versioned prompts the CI gate evaluates against the same threshold.
- Agent Command Center fronts 100+ providers with BYOK routing, caching, and 18+ runtime guardrails reading the same trace stream. Benchmarked at ~29k req/s, P99 21 ms with guardrails on, on
t3.xlarge. - SOC 2 Type II + HIPAA + GDPR + CCPA certified per futureagi.com/trust; ISO 27001 in active audit.
Honest limitations. More moving parts than LangSmith inside a LangChain app or Helicone for gateway logging. ClickHouse, Postgres, Redis, Temporal, and the gateway are real services on self-host; use the hosted cloud if you don’t want to operate the data plane. Outbound notification beyond Linear is roadmap.
Pricing intelligence. Free to start with generous limits; usage-based after that, billed against trace volume, judge tokens, and storage retention rather than per seat. Compliance add-ons (SOC 2 Type II reports, HIPAA BAA, SAML SSO + SCIM) layer per tier. Pricing.
Expert verdict. Pick Future AGI when production failures must close back into pre-prod tests automatically. The buying signal: you already run Braintrust for evals, Langfuse for traces, a notebook for optimization, and a separate gateway, and the same tool-call regression keeps showing up because the handoffs lose fidelity.
2. LangSmith: best for LangChain and LangGraph runtimes
Closed platform. MIT SDK. Cloud, hybrid, and Enterprise self-hosting.
Quick take. Lowest-friction first pick when LangGraph is the runtime. Native trace semantics for chains, graphs, retrievers, tools, and prompts; Playground replay, Fleet agent deployment, and Studio graph visualization in one product. Outside LangChain, the value drops fast.
Ideal for. LangChain v1 and LangGraph teams who want eval, deployment, and observability in the same mental model as the runtime.
Key strengths.
- Framework-native trace semantics; LangGraph spans render as the actual graph, not a flat list.
- Playground replay for chains and prompts; pin a node, change the model, rerun against the same input. Prompt Hub, annotation queues, Fleet deployment, Studio graph visualization in the same product.
- Cloud, hybrid, and Enterprise self-hosting (VPC).
- Same-day support for new LangChain releases.
Honest limitations. Framework coupling cuts both ways. Custom agents, LiteLLM, direct provider SDKs, or non-LangChain orchestration see the value drop fast. Seat pricing makes cross-functional access expensive. No first-party simulation, no integrated gateway, no inline guardrails. Base trace overage at $2.50 per 1,000 stacks up on a high-volume agent.
Pricing intelligence. Developer free with 5K base traces/mo, 1 Fleet agent, 1 seat. Plus $39/seat/mo with 10K base traces, unlimited Fleet agents, up to 3 workspaces. Enterprise custom with VPC.
Expert verdict. Pick LangSmith if LangChain is the runtime and framework-native ergonomics matter more than OSS control or multi-framework reach. Skip if you run a heterogeneous stack. See LangSmith Alternatives for the deeper view.
3. Langfuse: best for self-hosted observability with prompts and datasets
Open-source core. Self-hostable. Hosted cloud option.
Quick take. Strongest OSS-first pick when self-hosted tracing with prompt versioning and dataset-driven evals is the requirement. Active project, large community, mature self-hosting. The trace UI is LLM-shaped, not trajectory-shaped, but the data plane is yours.
Ideal for. Platform teams that operate the data plane, want trace data in their own infrastructure, and pair Langfuse with a CI eval framework. CTO ruled out black-box SaaS for traces.
Key strengths.
- MIT core; mature self-hosted architecture across Postgres, ClickHouse, Redis, object storage, queues, workers.
- Prompt management with labels, environments, version diffs; datasets, runs, human annotation queues.
- OpenTelemetry ingestion; LiteLLM proxy logging; broad framework integrations.
- Experiments CI/CD integration shipped May 2026, closing one of the biggest gaps in the OSS-first workflow.
Honest limitations. Trajectory metrics are not first-class: 5 span kinds versus Future AGI’s 14, and the trace UI sorts by call, not by agent step. Simulation, voice eval, prompt optimization, and runtime guardrails live in adjacent tools. Enterprise directories ship under a separate commercial license outside MIT.
Pricing intelligence. Hobby free with 50K units/mo. Core $29/mo with 100K units, $8 per additional 100K. Pro $199/mo. Enterprise $2,499/mo. A “unit” covers a trace, observation, score, or evaluation, which is why production cost compounds faster than the headline rate suggests.
Expert verdict. Pick Langfuse if OSS observability with prompts and datasets is the entire requirement and you can pair it with external eval and guardrail layers. Skip if you need trajectory metrics on the span itself or a hosted Error Feed-style cluster-and-RCA loop. See Langfuse Alternatives.
4. Arize Phoenix: best for OpenInference adherence across frameworks
Source available under ELv2. Self-hostable. Phoenix Cloud and Arize AX paths.
Quick take. Phoenix is the canonical OpenInference reference. Built by Arize, the team that owned ML observability for embedding drift before LLM observability was a category. OTLP-first ingestion, auto-instrumentation for the major frameworks, clean local workbench.
Ideal for. Engineers who care about open instrumentation standards, want a clean local workbench for development, and plan a path into Arize AX.
Key strengths.
- OpenInference reference; canonical attribute names land in Phoenix first.
- Auto-instrumentation for LlamaIndex, LangChain, DSPy, Mastra, Vercel AI SDK, OpenAI Agents SDK, Bedrock, Anthropic, others across Python, TypeScript, and Java.
- Strong embedding-drift heritage from Arize’s ML observability legacy; retrieval-quality dashboards and chunk-level drift detection carry over.
- Clean local workbench:
phoenix.launch_app()and you have a tracer.
Honest limitations. Not a gateway, not a guardrail product, not a simulator. ELv2 is source available, not OSI open source. Trajectory metric library is smaller than Future AGI’s catalog. Scoring lives in the Phoenix eval surface, not as a span-attached primitive the way traceAI ships, so the failing span doesn’t light up red inside the trace tree until you cross-reference.
Pricing intelligence. Phoenix free self-hosted. AX Free 25K spans/mo, 15 days retention. AX Pro $50/mo with 50K spans, 30 days. Enterprise custom with SOC 2, HIPAA, data residency.
Expert verdict. Pick Phoenix when OpenInference adherence and the Arize AX path are the buying signals. Skip if you need gateway, guardrails, simulation, or strict OSI open source. See Arize Alternatives for the broader comparison.
5. Braintrust: best for closed-loop dev evals with sandboxed agent runs
Closed platform. Hosted cloud or Enterprise self-host.
Quick take. Braintrust ships the best eval UI in the closed category. Experiments, datasets, scorers, prompt iteration, online scoring, and CI gating in one polished product, with sandboxed agent evaluation for tool-calling agents. Center of gravity is structured evals, not the full debugging loop.
Ideal for. Teams that prefer to buy rather than build, want experiments and scorers in one polished UI, and don’t need OSS control or a first-party gateway.
Key strengths.
- Sandboxed agent evaluation with tool-call execution; the agent-evals surface is more developed than Langfuse or Phoenix.
- Polished UI for experiments, scorers, datasets, and prompt iteration.
- Online scoring and CI gates in the same product as offline experiments.
- May 2026 added Java auto-instrumentation for Spring AI and LangChain4j; Loop-assisted replay tightens the regression workflow.
Honest limitations. Closed platform; Enterprise-only self-host. No first-party voice simulator. Gateway, guardrails, and prompt optimization algorithms are not first-class. Trajectory metrics beyond manually composed scorers are not built in, so Tool Correctness or Plan Adherence are something you wire up yourself.
Pricing intelligence. Starter $0 with 1 GB, 10K scores, unlimited users. Pro $249/mo with 5 GB, 50K scores. Overage on Pro $3/GB and $1.50 per 1K scores. Enterprise custom.
Expert verdict. Pick Braintrust if structured evals with a polished UI is the dominant problem and gateway, guardrails, and simulation are not on the requirement list. See Braintrust Alternatives.
6. Helicone: best for gateway-first debugging with the lowest base-URL friction
Open source. Self-hostable. Hosted cloud option. Maintenance mode after Mintlify acquisition.
Quick take. Helicone’s gateway captures every request when you change the base URL, then surfaces sessions, user metrics, cost tracking, prompts, and eval scores. The fastest path from “we have live traffic” to “we have searchable traces.” Now in maintenance mode after the Mintlify acquisition in March 2026.
Ideal for. Teams with live traffic and no clean answer to “which users, prompts, models drove this p99 spike.” A fast first tool when SDK instrumentation is a multi-week conversation with engineering.
Key strengths.
- Lowest base-URL-change friction in the category; one URL swap and traces flow.
- Sessions, user metrics, cost tracking, prompts, and eval scores in one product.
- Apache 2.0 and self-hostable.
- HQL query language for ad-hoc trace queries; Team tier adds SOC 2 and HIPAA posture.
Honest limitations. On March 3, 2026, Helicone announced it had been acquired by Mintlify and services would stay live in maintenance mode (security updates, new model support, bug fixes only). Treat roadmap depth as something to verify directly. No first-party simulator, no guardrail scanner library, no Error Feed-style cluster-and-RCA loop.
Pricing intelligence. Hobby free with 10K requests, 1 GB, 1 seat. Pro $79/mo with unlimited seats, alerts, HQL. Team $799/mo with 5 orgs, SOC 2, HIPAA. Enterprise custom.
Expert verdict. Pick Helicone if the constraint is “live traffic now, instrumentation later” and gateway-first analytics is acceptable as a starting point. Plan a migration onto a roadmap-active platform once the deeper debug loop becomes the bottleneck. See Helicone Alternatives.
7. OpenLLMetry / OTel native: best for full DIY control over the pipeline
Apache 2.0 SDK. Ship to any OTLP backend. Maintenance is yours.
Quick take. OpenLLMetry is Traceloop’s open OTel SDK for LLMs, paired with any OTLP-compatible backend you already operate. The pitch is total control over collector, backend, sampling, and storage. The tax is engineering time to keep instrumentation matching the frameworks your team uses, plus a debugger you assemble from parts. Covers the broader OTel-native pattern too: traceAI in OpenInference mode shipped to Honeycomb or a self-hosted Tempo cluster fits the same shape.
Ideal for. Platform teams with strong OTel expertise, an existing Honeycomb / Tempo / Jaeger / ClickHouse backend, and a preference for owning the pipeline end to end.
Key strengths.
- Apache 2.0; the entire path is open.
- OpenLLMetry covers Python, TypeScript, Go, and Ruby; Python framework coverage is strong for LangChain, LlamaIndex, and direct provider SDKs.
- OTLP-native; ships to any OTel backend (Datadog, Grafana Tempo, Jaeger, Honeycomb, Future AGI, Langfuse, Phoenix).
- Tail-based sampling at the collector means you keep the failing traces and drop the boring ones.
Honest limitations. This is the row where “build vs buy” hurts. The SDK does not ship span-attached eval scoring, replay, trace-to-dataset workflows, a CI gate, or an Error Feed. You assemble all of that from your backend’s primitives and your own glue code. Trajectory metrics (Tool Correctness, Plan Adherence) are something you implement; the SDK only captures the spans. Framework coverage in TypeScript and Go is shallower than in Python; verify your stack before standardising.
Pricing intelligence. SDK is free. The cost is the OTel collector you run, the backend you ship to (Honeycomb starts at 20M events/mo free; Datadog meters per ingested span; ClickHouse self-host is storage cost only), and the engineer-hours to maintain integrations as frameworks ship breaking changes.
Expert verdict. Pick OpenLLMetry plus an OTel backend when full pipeline control beats time-to-debug-loop and the team has the OTel muscle to operate it. Skip if the goal is to start debugging this week. See OpenLLMetry alternatives.
Debugging-surface coverage across the 7 tools
| Capability | Future AGI | LangSmith | Langfuse | Phoenix | Braintrust | Helicone | OpenLLMetry + OTel |
|---|---|---|---|---|---|---|---|
| Span kinds (count) | 14 | LangChain-native | 5 | 8 | proprietary | gateway-shaped | depends on backend |
| Span-attached evals | Full (50+ metrics) | Partial | Partial | Partial | Full | Partial | DIY |
| Replay against new candidate | Full | Full (Playground) | Partial | Partial | Full (Loop) | None | DIY |
| Trace-to-dataset workflow | One-click | Manual export | Manual | Manual | Full | None | DIY |
| Error Feed (HDBSCAN + Judge) | Full | None | None | None | None | None | DIY |
| CI gate (block deploy on score drop) | Full | Full | Full (May 2026) | Partial | Full | None | DIY |
| OTel / OpenInference ingestion | Full (traceAI, 50+ surfaces) | Partial | Full | Full (reference) | Partial | Partial | Full |
| Self-host license | Apache 2.0 | Enterprise-only | MIT core | ELv2 | Enterprise-only | Apache 2.0 | Apache 2.0 SDK |
Decision framework: choose X if
- Choose Future AGI if the failing trace has to close back into a regression test automatically. Buying signal: the same tool-call regression class keeps showing up across releases because the handoff from prod to dataset to CI lost fidelity in a Slack thread.
- Choose LangSmith if LangChain or LangGraph is the runtime and framework-native ergonomics matter more than OSS control. Buying signal: every agent run is already a LangGraph execution.
- Choose Langfuse if OSS observability with prompts, datasets, and a mature self-hosting story is the entire requirement. Buying signal: the CTO ruled out black-box SaaS for traces.
- Choose Phoenix if OpenInference adherence and the Arize AX path are the buying signals. Pairs with a local Phoenix workbench in dev and the broader Arize AX product line in production.
- Choose Braintrust if structured evals with a polished UI is the dominant problem and you don’t need a gateway, guardrails, or simulation.
- Choose Helicone if the constraint is “live traffic now, instrumentation later.” Plan a migration once the deeper debug loop becomes the bottleneck.
- Choose OpenLLMetry plus an OTel backend if full pipeline control beats time-to-debug-loop and the team has the OTel muscle to operate it.
Common mistakes when picking an agent debugging tool
- Confusing logs with traces. A flat list of LLM calls is logs. A span tree with parent-child edges is a trace. A trace with span-attached scores, replay, and a CI gate is a debugger.
- Skipping structured error analysis. Clustering failing traces by failure mode is the difference between fixing one symptom and fixing a class. See error analysis for LLMs for the cluster-label-prioritize loop.
- Picking on demo datasets. Vendor demos use clean prompts and idealized failures. Run a domain reproduction with your real traces, your model mix, and your judge cost.
- Ignoring replay. A great trace browser without replay is a postmortem tool. Verify replay against fresh model versions with the retrieval state actually reconstructable.
- Treating OSS and self-hostable as the same. Phoenix is source available under ELv2, not OSI open source. Langfuse has enterprise directories outside MIT. Helicone is in maintenance mode after Mintlify.
- Skipping CI gates. Debugging without a gate ships fixes that regress within two releases. Verify each candidate has a real CI hook, not a Slack alert.
How to actually evaluate this for production
Three checks before you sign a contract. Export a representative slice of real traces (failures, long-tail prompts, tool calls, retrieval misses), instrument each candidate with your OTel payload shape, prompt versions, and judge model, then track time from production failure to reusable eval case. Measure reliability under load (p50, p95, p99 query latency, dropped spans, failed judge calls) and cost-adjust against trace volume, judge sampling rate, retry rate, and storage retention. The last metric is the one most procurement decks skip and most engineering teams pay for later.
Where Future AGI fits
Most teams comparing agent debugging tools end up running three or four products in production: one for traces, one for evals, one for replay, one for the gateway. Future AGI is the recommended pick when those need to live on one Apache 2.0 self-hostable plane and the failing trace has to close back into a regression test automatically.
- Trace tree. traceAI auto-instruments 50+ AI surfaces across Python, TypeScript, Java, and C#. 14 span kinds.
- Error Feed. HDBSCAN clusters failing traces; the Sonnet 4.5 Judge agent root-causes each cluster and writes the
immediate_fixfield. Failures promote into the dataset; agent-opt searches the prompt space against the same rubric. - Span-attached evals. ai-evaluation ships 50+ EvalTemplate classes as both pytest CI scorers and online scorers, with lower per-eval cost than Galileo Luna-2.
- Agent Command Center gateway. 100+ providers, BYOK routing, caching, 18+ runtime guardrails on the same plane. ~29k req/s, P99 21 ms on
t3.xlarge. - Compliance. SOC 2 Type II + HIPAA + GDPR + CCPA per futureagi.com/trust; ISO 27001 in active audit.
Start free with generous limits; usage-based after that. Pricing.
Sources
- Future AGI pricing · GitHub · traceAI · ai-evaluation · Agent Command Center docs
- LangSmith pricing · SDK
- Langfuse pricing · GitHub · Changelog
- Phoenix docs · GitHub · Arize pricing
- Braintrust pricing · Changelog
- Helicone pricing · GitHub · Mintlify acquisition
- OpenLLMetry
Read next
Best AI Agent Observability Tools · How to Debug AI Agents in 5 Minutes · Best LLM Tracing Tools · Best LLM Monitoring Tools · LangSmith Alternatives
Frequently asked questions
What does an AI agent debugging tool actually need to do?
Which AI agent debugging tools are open source in 2026?
What makes Future AGI's Error Feed different from a trace browser?
Can I debug a multi-framework agent stack with one tool?
How do I debug a tool-calling failure that only happens in production?
Is observability the same as debugging for agents?
How much should I expect to pay for agent debugging in 2026?
Best LLM tracing tools 2026 compared: Future AGI traceAI, Phoenix, Langfuse, OpenLLMetry, Helicone, Datadog. OTel discipline + auto-instrumentation.


Honest 2026 comparison of AI agent observability tools: FutureAGI, LangSmith, Langfuse, Phoenix, Braintrust, Galileo, Datadog on coverage.


Six agent eval frameworks for trajectory-first teams 2026: LangSmith, Future AGI, Braintrust, DeepEval, Phoenix, OpenAI Evals, honest tradeoffs.