Span vs Trace in LLM Observability: What's the Difference in 2026?
A trace is one user request; a span is one operation inside that trace. OTel terminology, parent-child trees, and what makes a good LLM trace in 2026.
Table of Contents
You debug a failing agent by reading 30 log lines in chronological order, mentally reconstructing which call was inside which loop, which retry came after which tool failure, and where the loop terminated. The reconstruction takes 20 minutes per failure, and half the time the conclusion is wrong. You debug the same failing agent by reading a span tree and the answer is in 30 seconds. The difference is data model. Spans have parent ids; logs do not. Logs are flat; traces are trees. The vocabulary matters because the abstraction matters: a trace is one user request, a span is one operation inside it, and the parent_span_id is what makes the abstraction work. This is the entry-point explainer; the deeper tutorials are linked below.
If you want depth, read these next:
- What is LLM Tracing? for spans, OTel GenAI, and sampling
- What is LLM Observability? for the full observability layer
- Best OTel Instrumentation Tools for LLMs for the SDK landscape
TL;DR: Span vs trace
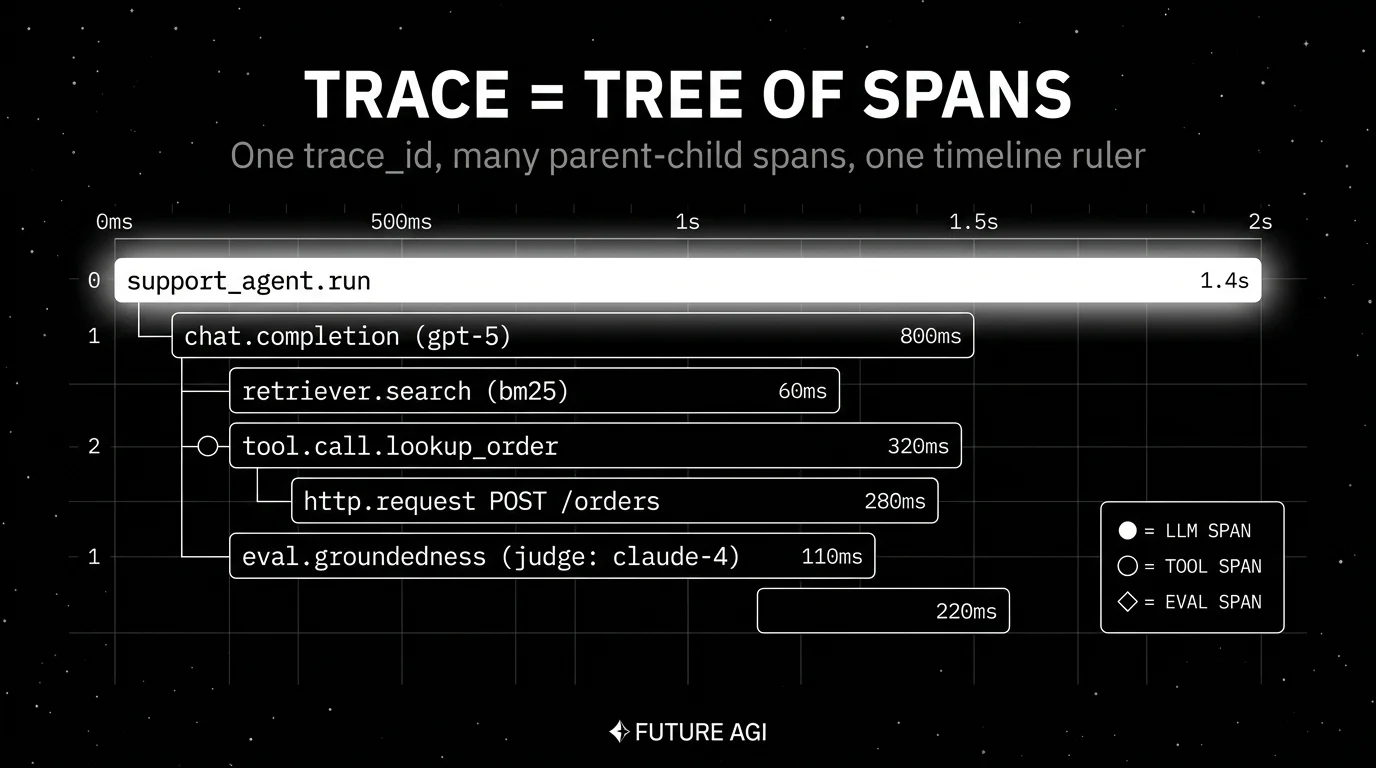
A trace is one user request from start to finish, identified by a single trace_id. A span is one operation inside that trace: an LLM call, a tool call, a retriever query, a sub-agent dispatch, a guardrail check, an evaluator run. One trace contains many spans. The parent_span_id field on each span builds the tree: the root span has no parent; children point at their parent’s span_id. The OpenTelemetry data model is the same for HTTP services and for LLM applications. What changes is the attributes on each span; an LLM span carries gen_ai.* attributes, an HTTP span carries http.* attributes.
Why the vocabulary matters
Three reasons.
First, debugging an agent run with 30 LLM calls, retriever queries, tool calls, and guardrail checks is intractable as a flat log file. You need the tree to see which tool call was inside which retry loop. The vocabulary is what makes the tooling possible: tools that render the tree, query by parent, replay a single node.
Second, cross-service propagation requires the abstraction. When a Python frontend calls a Go retriever calls a Rust embedding service, the trace_id ties the spans across service boundaries. Without the trace_id concept, distributed debugging is back to log correlation by timestamp.
Third, the eval and monitoring layer attaches scores at the span level. An eval score that says “Faithfulness 0.7 on this trace” is less actionable than “Faithfulness 0.7 on the generation span at depth 3, which received chunks from retriever span at depth 2 with similarity 0.81”. Span-level granularity is what makes monitoring precise.
The transport caught up in parallel. The OpenTelemetry data model formalized spans and traces in 2019 for cloud-native services. The OTel GenAI semantic conventions (in development as of 2026) extended the attribute namespace for LLM workloads under gen_ai.*. OpenTelemetry-aware observability tools, including FutureAGI, Langfuse, Arize Phoenix, Datadog, and the OpenTelemetry collector ecosystem, speak this language natively.
What a span carries
Every span carries the same minimum metadata regardless of what it represents.
Identity
- trace_id: ties the span to one user request.
- span_id: unique identifier of this span.
- parent_span_id: identifier of the span that owns this one; null for the root.
Timing
- start_time: Unix-nanosecond timestamp in OTel; actual clock precision depends on the SDK and runtime.
- end_time: Unix-nanosecond timestamp in OTel; actual clock precision depends on the SDK and runtime.
- The duration is end minus start.
Status
- OK, ERROR, or unset.
- Error spans can include exception events with an error message and stack trace when the instrumentation records them.
Name
- Human-readable, like
openai.chat.completion,retriever.search,agent.tool_call,guardrail.check.
Attribute bag
- Typed key-value pairs.
- For LLM spans:
gen_ai.request.model,gen_ai.usage.input_tokens,gen_ai.usage.output_tokens,gen_ai.operation.name. - For tool spans:
tool.name,tool.arguments,tool.return_value. - For retriever spans:
rag.retriever.top_k,rag.retriever.chunks,rag.retriever.index.version. - Custom application attributes go here too:
app.prompt.version,app.feature.flag,app.user_id_hash.
Events
- Discrete points in time inside the span.
- Useful for streaming first-token markers, intermediate state, and sub-events too small to warrant their own span.
Links
- References to other spans not in the parent chain.
- Useful for async patterns where one span starts work that another span finishes.
What a trace contains
A trace is the collection of every span that shares a trace_id, plus the implicit tree structure built from parent_span_id.
The root span is the entry point: usually the user-visible operation like chat.respond or support_agent.run. Below it sit nested spans for each LLM call, retriever query, tool call, guardrail check, and sub-agent dispatch.
Tree depth depends on the application:
- A simple chat completion is a shallow trace: a root request span plus one LLM call span beneath it.
- A RAG agent is a 2-3 level tree: root, retriever, generation, optional grounding check.
- A multi-step agent with tool calls and sub-agents is a 4-7 level tree: root, planning LLM, tool call, sub-agent dispatch, sub-agent’s LLM, sub-agent’s tool call, evaluator.
Most observability backends render this tree natively as nested horizontal bars on a time ruler.
Span types in an LLM trace
Different operations get different span types. The minimum useful set:
LLM call spans
One per call to a chat completion or text generation endpoint. Carry every gen_ai.* attribute plus the prompt and completion (opt-in). Nest under the application logic span that triggered the LLM call.
Tool call spans
One per function or tool invocation by the model. Carry the tool name, arguments, return value, latency, and status. Nest inside the LLM span that decided to call the tool.
Retriever spans
One per vector search, BM25 search, or hybrid retrieval. Carry the query, the top-k chunks returned, similarity scores, and the index version. For depth, see What is RAG Observability?.
Sub-agent spans
One per dispatch to a child agent. The child agent’s full trace tree nests under the parent. The shape is a sub-tree, not a flat span.
Guardrail spans
One per input or output validator. Carry the rule name, the verdict, and the modified payload if the guardrail rewrote the input or output.
Evaluator spans
One per online scorer (LLM-as-judge, schema check, citation grounder). Either nested inside the parent LLM span or connected via a span link when the eval runs out-of-band.
Custom spans
Anything your business logic does between LLM calls (preprocessing, postprocessing, business rule checks, persistence) gets its own span if you care about its latency or status.
Common mistakes when modeling LLM spans and traces
- Treating spans as logs. Logs have timestamps and severity. Spans have parent_span_id, attribute bags, and structured status. Bolting span structure on top of log lines later means re-instrumenting every call site.
- Span-per-line-of-code. Too many spans crush the backend and make the tree unreadable. Pick a granularity (every LLM call, every tool call, every retriever call) and stick to it.
- Span-per-chunk in retrievers. Each retriever call is one span; chunks are an attribute on that span, not children. Span-per-chunk explodes trace size 10x.
- Flat trace for agent runs. A LangGraph or CrewAI run is a tree. A flat span list buries the loop and the tool decisions. Force tree-structured trace views with parent_span_id discipline.
- No prompt version tag. Add
app.prompt.versionas a custom attribute on every LLM span. Without it, A/B prompt rollouts are not analyzable. - No trace_id propagation across services. When a Python service calls a Go service, the trace_id has to pass in headers. Without propagation, the cross-service tree is broken.
- Forgetting redaction.
gen_ai.input.messagesandgen_ai.output.messagescarry PII. Configure the SDK or collector to redact before storage. Treat retriever chunk_text the same way. - Ignoring the root. Without a clean named root span (chat.respond, support_agent.run), traces are anonymous. Force a top-level span at every public entry point.
How OTel terminology compares to vendor terms
Different vendors use slightly different vocabulary on top of the OpenTelemetry data model.
| OTel term | Langfuse term | Phoenix term | LangSmith term |
|---|---|---|---|
| Trace | Trace | Trace | Run (top-level) |
| Span (LLM call) | Generation | Span (LLM) | Run (LLM) |
| Span (other op) | Span | Span | Run (chain, tool) |
| Parent span | Parent observation | Parent span | Parent run |
| Attribute | Metadata + I/O | Attribute | Inputs + outputs + metadata |
| Span event | Event | Span event | Event |
OTel is the lingua franca. Vendor-specific terms map cleanly back. The mapping matters when you migrate between vendors: an export from Langfuse is straightforward to import into Phoenix or FutureAGI because the underlying OTel model is the same.
The future: where trace and span semantics are heading
A few directions are settled, others are emerging.
OTel GenAI graduates from development. As of 2026 the spec is gated by OTEL_SEMCONV_STABILITY_OPT_IN. The opt-in flag will eventually flip to default-on. Tools that handle version pinning gracefully will look better than tools that silently drift across attribute renames.
Convention convergence. OpenInference and OTel GenAI continue to converge. Most backends already accept both. Future versions will reduce duplication.
Agent-aware UI becomes the default. A flat span list buries the agent loop. Tools that render runs as actual graphs and let you replay a single span with new state will pull ahead.
Span-attached evals become standard. The shift is from “we run an eval suite at release” to “every production span carries quality verdicts as it happens.” The CI gate, the on-call alert, and the monitoring dashboard all consume the same score stream.
Span-level cost budgets. Per-user, per-prompt, per-feature budgets that read the live span stream and short a request when its budget is exhausted. The data is already in the trace; what is missing is the policy enforcement layer.
The throughline of all five: by 2026, span and trace are not internal vocabulary; they are the interface across instrumentation libraries, observability backends, eval platforms, and monitoring layers. Get the abstraction right and the rest of the LLM observability stack composes; get it wrong and every component pays the cost.
How to use this with FAGI
FutureAGI is the production-grade OTel-native LLM tracing stack. traceAI is Apache 2.0 OTel instrumentation across Python, TypeScript, Java, and C# (50+ integrations) that emits OTel-conformant spans with gen_ai.* attributes plus openinference.* / llm.* namespaces; the Agent Command Center ingests OTLP, persists in ClickHouse, and renders the trace tree with span-kind filtering, prompt-version tagging, and per-cohort comparison. Span-attached eval scores attach via turing_flash for guardrail screening at 50 to 70 ms p95 and full eval templates at about 1 to 2 seconds.
Because the model is OTel under the hood, exports from Langfuse, Phoenix, or LangSmith move into FutureAGI without re-instrumentation. The same plane carries 50+ eval metrics, persona-driven simulation, the BYOK gateway across 20+ providers via six native adapters (OpenAI, Anthropic, Gemini, Bedrock, Cohere, Azure) plus OpenAI-compatible presets and self-hosted backends, and 18+ guardrails on one self-hostable surface. Free + pay-as-you-go base; compliance (SOC 2, HIPAA BAA), SSO (OAuth, SAML + SCIM), and enterprise SLAs add on per tier (pricing).
Sources
- OpenTelemetry concepts: traces and spans
- OpenTelemetry GenAI semantic conventions
- OpenTelemetry GenAI span attributes
- OpenInference GitHub repo
- traceAI GitHub repo
- Langfuse data model docs
- Phoenix tracing docs
- LangSmith tracing docs
- FutureAGI pricing
- Datadog LLM Observability docs
Series cross-link
Read next: What is LLM Tracing?, What is LLM Observability?, Best LLM Tracing Tools in 2026, Best OTel Instrumentation Tools for LLMs
Frequently asked questions
What is the difference between a span and a trace in plain terms?
What does a span actually carry?
How do I read a trace as a tree?
What is an observation in this terminology?
What does a good LLM trace look like?
How deep should an LLM trace go?
How are span attributes different for LLM workloads?
What is the trace_id used for?
LLM tracing is structured spans for prompts, tools, retrievals, and sub-agents under OTel GenAI conventions. What it is and how to implement it in 2026.

OpenInference is the OpenTelemetry-aligned semantic convention and instrumentation library for LLM applications, maintained by Arize. 2026 fit explained.
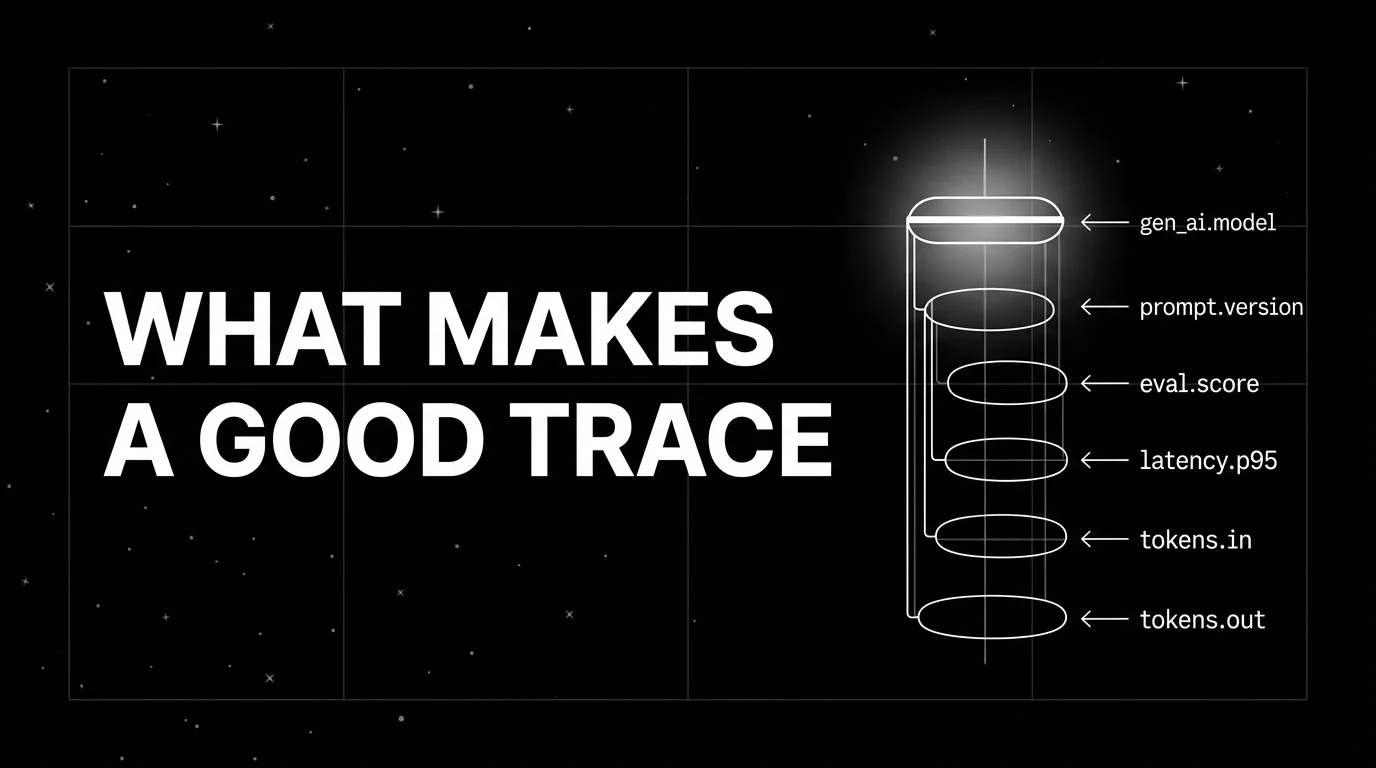
Anatomy of a good LLM trace in 2026: span hierarchy, OTel GenAI attributes, prompt-version tags, eval scores, cost attribution, retrieval and tool spans.
