Production LLM Monitoring Checklist for 2026: 10 Items Before You Ship
10-item production LLM monitoring checklist for 2026: OTel, eval gates, drift alerts, PII redaction, A/B rollback, runbooks. Vendor-neutral.
Table of Contents
The post-mortem template is the same one every LLM team discovers in production. The incident: groundedness dropped 9% on Tuesday at 4pm. The cause: a prompt change shipped at 4pm on Tuesday. The detection: customer complaints starting Friday. The lag from incident to detection: 72 hours. The lag from detection to mitigation: 4 more hours. By the time the rollback shipped, 5,800 user sessions had degraded responses. The retro lists 10 items that, had they been wired, would have caught the regression at 4:15pm and rolled it back automatically by 4:25pm. None of those items were exotic. Most of them were on the v1 launch plan and got deferred for the v2 launch.
This piece is the launch plan that does not get deferred. Ten items. Each is a vendor-neutral capability with a verification step you can run before going live and a maintenance discipline you can run weekly. The checklist is what separates a workload that fails loudly at PR time from one that fails quietly for 72 hours.
TL;DR: 10 items, all mandatory
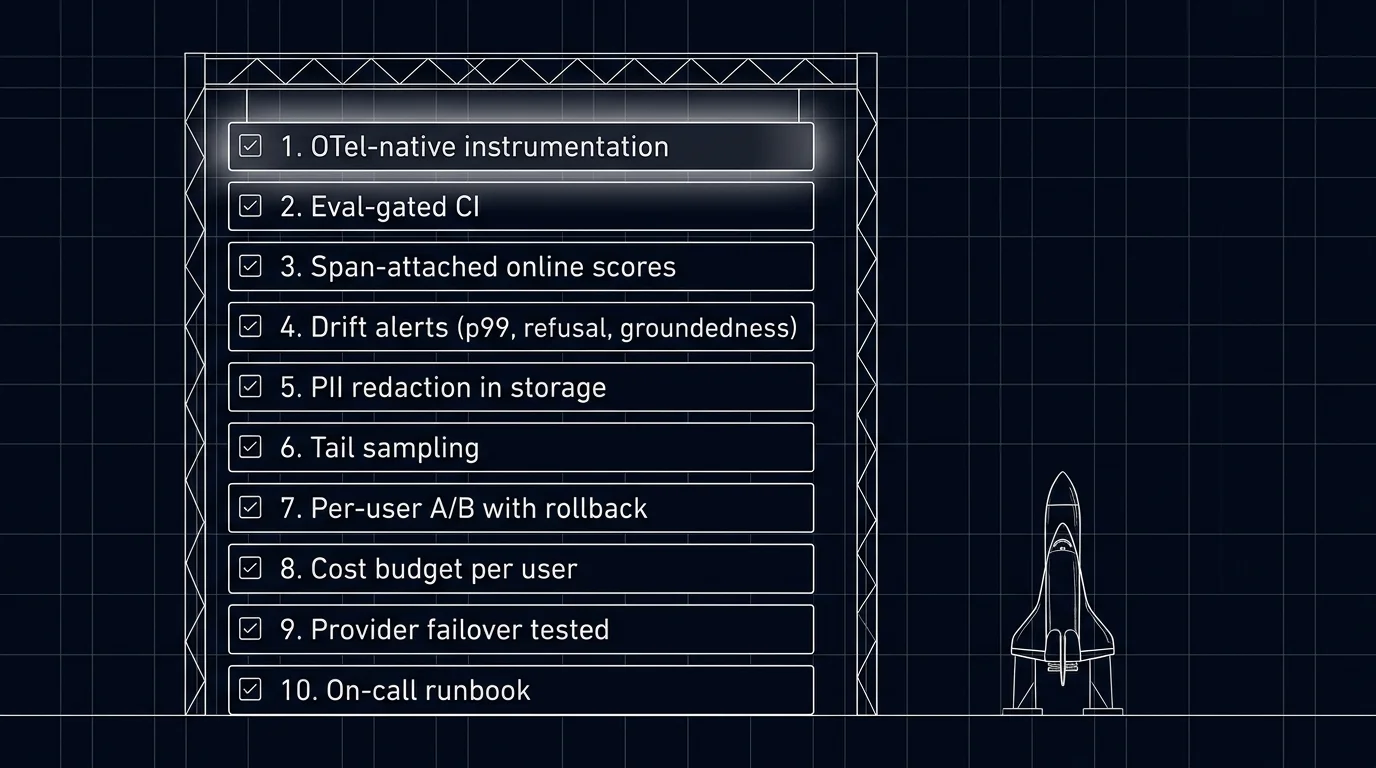
| # | Item | Failure mode it prevents |
|---|---|---|
| 1 | OTel-native instrumentation | Cannot reconstruct a request without traces |
| 2 | Eval-gated CI | Prompt regression ships unblocked |
| 3 | Span-attached online eval scores | Drift invisible until users complain |
| 4 | Drift alerts | Detection lag stretches into days |
| 5 | PII redaction at the collector | Compliance incident when prompts logged with PII |
| 6 | Tail-based sampling | Long-tail failures buried at 1% head sampling |
| 7 | Per-user A/B with rollback | All-or-nothing rollouts; manual rollbacks |
| 8 | Cost budget enforcement | Runaway sessions, surprise bills |
| 9 | Provider failover tested under load | Outage triggers cascading failure |
| 10 | On-call runbook with replay | 3am pages with no playbook |
If you only read one row: items 3 and 4 (online scores and drift alerts) are what reduce detection lag from days to minutes. Without them, every regression becomes a slow-rolling user-complaint incident.
Why this checklist matters in 2026
Three forces converged.
First, LLM workloads fail differently than traditional services. A 5% drop in groundedness is invisible to APM. A reasoning-token cost spike is invisible to infra cost dashboards. A refusal-rate flip from 4% to 27% looks like normal traffic to a load balancer. The LLM-specific failure surface needs LLM-specific monitoring.
Second, regulatory pressure increased. EU AI Act obligations (phased through 2026 and 2027), HIPAA, and finance audits may require demonstrable monitoring of model outputs depending on jurisdiction, risk class, and data type. PII redaction, audit trails on prompt promotions, and incident response logs are not nice-to-haves; they are findings if missing.
Third, the cost of incidents grew. A 72-hour groundedness regression that affects 5,000 users is a churn event. A surprise $43K bill from a runaway agent is a board-meeting incident. Both are preventable with the right monitoring. Both still happen on workloads that ship with the v1 checklist deferred.
The substrate this checklist runs on: OTel GenAI semantic conventions, OTLP transport, distilled judges for online scoring, and a gateway that enforces budgets and routes failover. See What is LLM Tracing? and LLM Tracing Best Practices for the tracing layer this depends on.
The 10 items
1. OTel-native instrumentation
Every service that calls an LLM emits OTLP spans with gen_ai.* attributes. The two viable instrumentation libraries: traceAI (Future AGI’s OTel-native framework, 50+ integrations across Python, TypeScript, Java, C#) and OpenInference (Arize, around 31 Python packages plus JavaScript and Java). Both emit OTLP and ship to any backend.
Verification: pull a sample trace, confirm it carries gen_ai.request.model, gen_ai.usage.input_tokens, gen_ai.usage.output_tokens, prompt version id, user cohort. If any are missing, the downstream items will not work.
2. Eval-gated CI
CI runs an eval suite on every PR that touches prompts, model config, retrieval, or tool definitions. The gate blocks merges on rubric regression beyond threshold.
Three viable CI patterns: DeepEval (pytest-native, Apache-2.0), Promptfoo (CLI-first, YAML test sets), Future AGI SDK and CI integration (Apache-2.0 OSS components, integrated with the platform). Pick by where your CI already runs and where the test sets live.
Verification: ship a deliberately regressing prompt PR; verify the gate blocks the merge. See Eval-Driven Development for the full eval workflow.
3. Span-attached online eval scores
Production traces are sampled and scored; scores attach to spans as attributes; drift detection runs on the score stream.
A reasonable configuration: distilled small judge (Galileo Luna, Future AGI Turing-flash) running at 5-20% sample rate plus 100% of error and outlier spans. Cost target: judge cost stays under 10-15% of production LLM cost.
Verification: pull a sample of production spans; confirm eval.* attributes present; confirm drift dashboard renders per-rubric rolling means.
4. Drift alerts on per-rubric rolling means
Per route, per prompt version, per user cohort. Common rubrics: groundedness, refusal calibration, tool-call accuracy, latency p99, cost per call.
A reasonable threshold: 2-5% drop warrants investigation, 5%+ warrants a page. Tune against historical noise; alerts that fire weekly on noise get muted.
Verification: trigger a drift in staging by deploying a deliberately worse prompt; verify the alert fires within the expected window.
5. PII redaction at the collector
gen_ai.input.messages and gen_ai.output.messages are opt-in attributes precisely because they carry PII. Minimize or redact PII as early as possible (client or service edge) and enforce collector-side redaction as a uniform backstop. Configure the redaction processor to remove, mask, or hash PII attributes; document the policy; review with privacy and security.
Verification: send test prompts containing emails, phone numbers, and named entities; confirm storage shows redacted placeholders. Repeat quarterly. For HIPAA, GDPR, or similar regimes, this is a hard requirement.
6. Tail-based sampling configured
Keep 100% of traces with errors, low eval scores, top-1% cost or latency, or experiment cohorts. Sample 5-20% of remaining traffic uniformly for distribution analysis.
Configure at the OTel collector with the tailsamplingprocessor. Verification: confirm error traces are 100% sampled; confirm uniform sample rate matches configuration.
7. Per-user A/B with eval-gated rollback
The unit of safe rollout is per-user A/B with automatic rollback. A percentage of users (typically 5-10% to start) gets the new prompt or model. The eval scorer monitors per-rubric pass rates on the new path. If a rubric regresses below threshold over a 15-minute or 1-hour window, the gateway reverts the cohort to incumbent without paging an engineer.
Verification: ship a deliberately worse prompt to a 5% canary; verify the rollback fires within the configured window.
8. Cost budget per user, per route, per tenant
The gateway enforces caps. When a per-user, per-route, or per-tenant cap is hit, the gateway short-circuits the request before it reaches the provider. Without enforcement, caps are aspirational.
Common caps: chat workload at 5x median per-user cost; agent workload at 10x median; tenant cap at the contracted invoicing limit. See LLM Cost Tracking Best Practices.
Verification: a synthetic user that exceeds the cap receives the rate-limit response; per-user cost dashboards show the cap line.
9. Provider failover tested under load
When the primary provider errors or rate-limits, the gateway transparently retries on a fallback provider with an equivalent model. Tested under load, not just configured.
A fallback that has not been load-tested is not a fallback. Verification: a chaos drill quarterly that simulates primary-provider outage; verify fallback handles full load without cascading errors.
10. On-call runbook with replay capability
Each alert maps to a runbook. The runbook covers: probable causes for the alert, relevant traces to inspect, rollback command, escalation path. The trace stack supports replay (re-run the same input through the previous prompt version to compare outputs).
Verification: each alert in the alerting catalog has a corresponding runbook entry; runbooks are reviewed quarterly; chaos drills test that an on-call engineer who has never seen the system can triage within 15 minutes following only the runbook.
Common mistakes when building production monitoring
- Skipping items at launch. Every item gets paid back in incidents. Ship all 10.
- Drift thresholds tuned to defaults. Defaults produce noise on small workloads and silence on large ones. Calibrate against your traffic.
- Eval scores not attached to spans. Without attachment, drift detection runs on a parallel data plane that drifts out of sync.
- Untested rollbacks. A rollback you have never executed in staging is not a rollback.
- Inline judges on the request path. Judges add latency. Run them async on a sample.
- Cost caps without gateway enforcement. Dashboards do not stop traffic.
- Runbooks that require deep system knowledge. The 3am on-call may have joined last week. Runbooks must be self-contained.
- No chaos drills. A failover that has only been imagined is a failover that fails when needed.
- Skipping the redaction quarterly verification. Redaction policies drift; verify they still work.
- Treating monitoring as set-and-forget. Workloads change; monitoring needs review every quarter.
Recent production LLM monitoring updates
| Date | Event | Why it matters |
|---|---|---|
| 2026 | OTel GenAI semantic conventions broadly supported (still Development status) | Cross-vendor compatibility at the trace layer |
| 2026 | Distilled judges hit production scale | Online scoring at sustainable cost on full traffic |
| 2026 | Tail-sampling processor in OTel collector matured | Outcome-aware sampling moved to off-the-shelf |
| 2026 | Future AGI Agent Command Center generally available | Gateway routing, guardrails, and trace analytics in one stack |
| 2026 | EU AI Act enforcement phase began | Audit-trail and PII-redaction requirements moved from advice to mandate |
How to actually wire this checklist in 2026
- Week 1. Instrumentation. traceAI or OpenInference; OTLP collector; backend ingest. Verify gen_ai.* attributes present.
- Week 1. PII redaction at the collector. Review policy with privacy and security. Test.
- Week 1. Tail-based sampling configured at the collector.
- Week 2. Eval-gated CI. Test set, scorers, threshold, CI integration. Verify it blocks a regressing PR.
- Week 2. Span-attached online eval scores. Distilled judge running at 5-20% sample.
- Week 3. Drift alerts. Per-rubric rolling-mean monitors. Calibrate thresholds against baseline.
- Week 3. Cost budget enforcement at the gateway. Per-user, per-tenant, per-route.
- Week 4. Per-user A/B with eval-gated rollback. Verify with a deliberately worse prompt.
- Week 4. Provider failover under load. Chaos drill.
- Week 4. Runbooks per alert. Quarterly review cadence scheduled.
Past four weeks, the workload is monitored. Past four weeks without all 10 items, you are launching to find out where the gaps are.
Sources
- OpenTelemetry GenAI semantic conventions
- traceAI GitHub repo
- OpenInference GitHub repo
- OTel collector tail sampling processor
- DeepEval docs
- Promptfoo docs
- Galileo Luna docs
- Future AGI Agent Command Center docs
- LangSmith observability docs
- EU AI Act overview
Series cross-link
Related: LLM Tracing Best Practices, LLM Cost Tracking Best Practices, LLM Evaluation Architecture, Self-Host LLMOps Guide
Related reading
Frequently asked questions
What is on the production LLM monitoring checklist for 2026?
Why is this different from regular service monitoring?
Do I need all 10 items at launch?
What is the cost of running this checklist in production?
How do I test the rollback path before relying on it?
What does drift detection actually monitor?
How do I integrate this checklist with on-call?
What does this checklist cost in operational complexity?
FutureAGI, Datadog, Langfuse, Phoenix, Helicone, Braintrust, LangSmith for LLM monitoring. Latency, drift, cost, eval pass-rate trends.

LLM monitoring is the alerting and dashboard layer on top of observability. Latency, cost, eval pass-rate, drift, and anomaly alerts in 2026.


FutureAGI, Langfuse, MLflow, W&B Weave, Comet, Braintrust, LangSmith for LLMOps in 2026. Pricing, OSS license, and what each platform won't do end-to-end.