Real-Time LLM Performance Monitoring in 2026: 7 Tools Ranked
Real-time LLM monitoring in 2026. FutureAGI, Langfuse, Phoenix, Helicone, OpenLIT, Datadog, and New Relic ranked on latency, eval depth, and OTel support.
Table of Contents
Real-time LLM performance monitoring in 2026 is not the dashboards of 2023. It is OpenTelemetry traces with span-attached evaluator scores, fast cloud judges that run inline or on a queue, and rolling-window eval-pass-rate alerts that actually wake the right person. Latency and error rate are still in the picture, but they are no longer the leading signal: a model that returns a 200 OK in 800 ms while quietly hallucinating product specs is the failure mode the 2026 stack catches.
This guide ranks seven real-time LLM monitoring tools against a clear rubric and is honest about where FutureAGI fits.
TL;DR: best real-time LLM monitoring tool per use case
| Use case | Best pick | Why (one phrase) | License |
|---|---|---|---|
| Tracing (Apache 2.0 traceAI) + cloud evals + Agent Command Center gateway + guardrails in one stack | FutureAGI | Closes the loop without stitching tools together | Apache 2.0 traceAI |
| OSS-first platform with traces, prompts, datasets, and scorers | Langfuse | Mature OSS, large community, OTel ingestion | MIT core |
| OpenTelemetry + OpenInference adherence | Arize Phoenix | OTLP-first, canonical OpenInference | Elastic License 2.0 |
| Gateway-first telemetry with sessions and cost | Helicone | Lowest friction from base URL change | Apache 2.0 |
| LLM + GPU + infra telemetry in one collector | OpenLIT | OTel-native, broad infra coverage | Apache 2.0 |
| Enterprise APM stack already in place | Datadog LLM Observability | First-party LLM spans inside Datadog | Commercial |
| New Relic shop, LLM tracing native to APM | New Relic AI Monitoring | Native to existing observability platform | Commercial |
If you only read one row: pick FutureAGI when tracing should also unlock cloud-judge evals, simulation, the Agent Command Center gateway, and 18+ guardrails in one stack with Apache 2.0 traceAI. Pick Langfuse for OSS-only depth without the gateway. Pick Phoenix when OpenInference adherence is non-negotiable.
Why real-time LLM monitoring matters in 2026
LLM applications break in ways traditional services do not. Three patterns drive the urgency:
- Silent quality drift. A model returns a 200 OK with high latency-budget headroom and still produces a hallucinated answer. Without span-attached evaluators, the dashboard says “healthy” while users see wrong outputs.
- Prompt and retrieval regressions. A prompt update or a knowledge-base refresh changes faithfulness without changing error rates. Monitoring that tracks only HTTP status misses the regression.
- Cost and latency drift from upstream changes. Provider routing, model deprecations, and tokenizer shifts move per-session cost and p95 latency. Without per-span cost attribution, the finance call comes before the engineering one.
The 2026 baseline is: traces with judge scores attached, sub-second inline judges where the path can afford them, sampled out-of-band evaluators for the rest, and alerts on rolling-window pass-rate, not only on latency or error count.
What metrics matter for real-time LLM monitoring
The six metrics that carry real signal:
- Eval pass-rate. Faithfulness, groundedness, task completion, plan adherence on a rolling 5-minute window. This is the leading quality indicator.
- Hallucination rate by topic and persona. A topic-keyed breakdown catches knowledge-cutoff failures that aggregate metrics smooth out.
- Latency p50, p95, p99. First-token latency and full-completion latency, by model and by tool.
- Token cost per session. Per-session cost catches prompt bloat and tool-call loops faster than per-request cost.
- Guardrail block-rate. PII redaction, prompt-injection block, jailbreak block, tool-call enforcement; rate spikes are early-warning signals.
- User-facing satisfaction. Thumbs-down, retry rate, escalation rate; closes the loop between operator metrics and product outcomes.
Vanity counts (total requests, total tokens) belong on a deployment dashboard, not on the alerting path.
Rubric: how the seven tools were ranked
Each tool is scored across six axes:
- Real-time evaluator latency. Reported or observed time from request completion to attached judge score.
- OTel and OpenInference support. Span schema, semantic-convention adherence, collector compatibility.
- Eval depth. Built-in metrics, custom LLM-judge support, dataset replay.
- Gateway and guardrail coverage. Whether the same plane that monitors also routes and enforces.
- License and self-hostability. OSI-approved license, self-host complexity, cost of operating at 10K+ spans per second.
- Maintenance signal. Release cadence, contributor count, 2026 roadmap movement.
These are the axes that decide procurement after a 30-day production trial.
The 7 real-time LLM monitoring tools, ranked
1. FutureAGI: Best for closing the tracing-to-eval-to-gateway loop in one stack
traceAI Apache 2.0. Library + hosted or self-hostable platform.
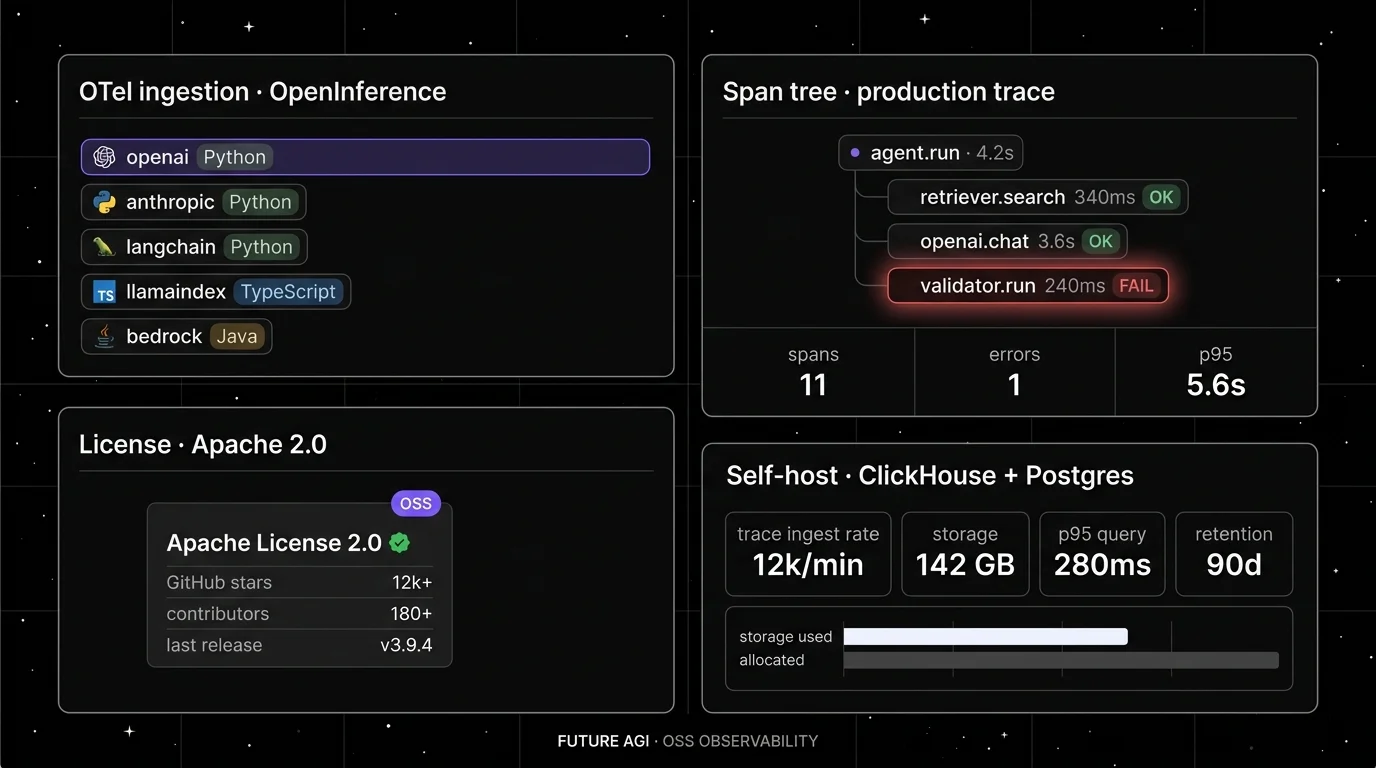
Architecture: traceAI (Apache 2.0) auto-instruments 50+ AI surfaces across Python / TypeScript / Java / C# (including Spring Boot starter, Spring AI, LangChain4j, Semantic Kernel) across Python, TypeScript, Java (LangChain4j and Spring AI), and C#, emitting OpenInference-shaped OpenTelemetry spans. The FutureAGI platform attaches 50+ first-party judge scores as span attributes, then exposes the Agent Command Center gateway in front of 20+ providers via six native adapters (OpenAI, Anthropic, Gemini, Bedrock, Cohere, Azure) plus OpenAI-compatible presets and self-hosted backends and 18+ runtime guardrails on the same plane.
Real-time evaluator latency: turing_flash runs faithfulness, hallucination, and toxicity at roughly 1 to 2 seconds cloud latency. turing_small is 2 to 3 seconds; turing_large is 3 to 5 seconds (docs). For strict inline budgets, pair turing_flash with async sampling for the deeper checks.
OTel and OpenInference support: Native OpenInference v1 spans across Python, TypeScript, Java, and C#. The platform layer adds eval-attached spans and gateway-emitted spans into the same trace tree.
Eval depth: 50+ first-party metrics including Faithfulness, Hallucination, Tool Correctness, Task Completion, Plan Adherence. BYOK lets any LLM serve as the judge at zero platform fee. The local Evaluator wrapper accepts a CustomLLMJudge for project-specific rubrics.
Gateway and guardrails: Agent Command Center routes across 20+ providers via six native adapters (OpenAI, Anthropic, Gemini, Bedrock, Cohere, Azure) plus OpenAI-compatible presets and self-hosted backends with BYOK and per-route policy. 18+ runtime guardrails (PII redaction, prompt-injection blocking, jailbreak detection, tool-call enforcement, scanners) run on the same plane.
License: Apache 2.0 for traceAI; ai-evaluation is also Apache 2.0.
Worth flagging: Phoenix and Langfuse have larger OSS communities today. The full-platform self-host path is real ops work (ClickHouse, Temporal, Agent Command Center); the hosted cloud avoids that if data plane operations are not the priority.
from fi_instrumentation import register, FITracer

register(project_name="prod-chatbot")
tracer = FITracer()

@tracer.chain
def answer(question: str, context: list[str]) -> str:
    return llm.generate(prompt=build_prompt(question, context))

from fi.evals import evaluate
result = evaluate(
    "faithfulness",
    output=answer("what is our refund window", context_docs),
    context=context_docs,
)
print(result.score, result.reasoning)
2. Langfuse: Best for OSS-first depth without the gateway
MIT core. Self-hostable. Hosted cloud option.
Architecture: Langfuse runs ClickHouse for span storage, Postgres for metadata, and Redis for queues. The platform ships traces, sessions, prompts, datasets, scores, annotations, and a query-builder dashboard.
Real-time evaluator latency: Custom scorers run async on the worker; in-product LLM-judge depends on the underlying judge model.
OTel and OpenInference support: OTel ingestion via the Langfuse /api/public/otel endpoint. Schema layered over OTel.
Eval depth: Dataset experiments, custom scorers, LLM-as-judge, human annotation queues. Experiments CI/CD integration shipped in 2026.
Gateway and guardrails: None first-party; Langfuse is not a gateway.
License: MIT for the core, enterprise directories (ee/) licensed separately.
Worth flagging: “MIT core” needs an asterisk during procurement. RBAC, SSO, audit logs live in the EE dirs. No first-party gateway, simulation, or guardrail layer.
3. Arize Phoenix: Best for OpenInference adherence
Source available under ELv2. Self-hostable. Phoenix Cloud and Arize AX paths.
Architecture: Phoenix runs as a Python or container service with Postgres for storage. Reference implementation for OpenInference across Python, TypeScript, and Java.
Real-time evaluator latency: LLM-judge runs depend on the chosen judge model and dataset batch size.
OTel and OpenInference support: OTLP-first. Auto-instruments LlamaIndex, LangChain, DSPy, Mastra, Vercel AI SDK, OpenAI, Bedrock, Anthropic, and others.
Eval depth: 30+ OSS evaluators, dataset experiments, LLM-as-judge with structured outputs, batch eval pipelines.
Gateway and guardrails: Not a gateway, not a guardrail product.
License: Elastic License 2.0. Source available, not OSI-approved.
Worth flagging: ELv2 matters for legal teams that follow OSI definitions strictly.
4. Helicone: Best for gateway-first telemetry
Apache 2.0. Self-hostable. Hosted cloud option.
Architecture: Helicone is a proxy that captures every LLM request as a span. Self-hosted runs Supabase plus ClickHouse for traces.
Real-time evaluator latency: Scores run async; inline blocking is not the model.
OTel and OpenInference support: Helicone has its own schema; OTel exporters exist but are secondary.
Eval depth: Sessions, request analytics, prompts, scores. Eval surface shallower than Langfuse or Phoenix.
Gateway and guardrails: Gateway is the entry point; lightweight policy.
License: Apache 2.0.
Worth flagging: Roadmap risk after the March 2026 Mintlify acquisition. See Helicone alternatives.
5. OpenLIT: Best for LLM + GPU + infra telemetry in one collector
Apache 2.0. Library + optional UI.
Architecture: OpenLIT ships OTel instrumentation for LLM frameworks, vector DBs, GPU usage (NVIDIA exporters), and infra. Optional ClickHouse-backed UI.
Real-time evaluator latency: Light; focus is telemetry breadth, not eval depth.
OTel and OpenInference support: Native OTel.
Eval depth: Light. Not the primary axis.
Gateway and guardrails: Not first-class.
License: Apache 2.0.
Worth flagging: Smaller community than Langfuse or Phoenix.
6. Datadog LLM Observability: Best for shops already on Datadog APM
Commercial. SaaS.
Architecture: First-party LLM spans inside Datadog APM, with prompts, traces, and an in-product judge layer (Datadog LLM Observability docs).
Real-time evaluator latency: Provider-side judges; latency varies by model.
OTel and OpenInference support: Datadog accepts OTel; LLM schema is Datadog-native.
Eval depth: Built-in quality, security, and topic scorers; custom evaluators supported.
Gateway and guardrails: Not a gateway.
License: Commercial.
Worth flagging: Best when the broader APM stack is already Datadog. Add-on pricing applies.
7. New Relic AI Monitoring: Best for shops already on New Relic
Commercial. SaaS.
Architecture: LLM spans, model details, and quality scoring native to the New Relic platform (New Relic AI Monitoring).
Real-time evaluator latency: Provider-side; latency varies.
OTel and OpenInference support: OTel ingestion; New Relic-native schema.
Eval depth: Quality and safety scoring; custom alerts.
Gateway and guardrails: Not a gateway.
License: Commercial.
Worth flagging: Best fit when New Relic is already in place across the rest of the stack.
Trade-offs: pick metrics by product goal
Optimizing for one metric often costs another. Two common cases:
- Improving faithfulness raises latency. Tighter retrieval and stricter system prompts add tokens and round-trips. Set a faithfulness floor and let latency float within an SLO instead of optimizing both at once.
- Reducing hallucination shrinks creative range. Hallucination guards (citation-required answers, retrieval-grounded prompts) reduce on-topic creativity. For legal or medical use cases the trade is correct; for marketing copy it is not.
Prioritize by product. A chatbot wants engagement and low first-token latency. A legal-document parser wants groundedness and zero hallucination. The monitoring rubric follows the product priority, not the other way around.
How to roll out real-time monitoring without breaking production
A three-stage rollout that has worked across customer migrations:
- Stage one, instrumentation in shadow. Add OTel instrumentation behind a sampling flag so spans flow to staging only. Verify span tree fidelity, prompt versions, and token cost rendering. No alerts yet.
- Stage two, out-of-band evals on a sample. Turn on async evaluators on a 10 percent sample. Tune the pass-rate threshold against historical user-facing satisfaction data. Open alerts to a low-priority channel.
- Stage three, inline guardrails behind a feature flag. Promote the highest-signal guardrails (PII, jailbreak, prompt-injection) inline. Enable rolling-window pass-rate alerts to the on-call rotation. Iterate on judge prompts as production data accumulates.
The mistake to avoid: skipping stage two and pushing inline judges to production without baseline data. The threshold is wrong on day one, and the team disables alerts within 48 hours.
Real-world example: a customer-service bot, three signals, one fix
A production support bot used the following flow.
- Morning. Rolling-window faithfulness on warranty-policy queries drops from 91 percent to 73 percent inside 20 minutes. Hallucination judge flags spike. Latency and error rate unchanged.
- Afternoon. Span drill-down shows a knowledge-base refresh shipped that morning chunked refund policy across two documents. Retrieval returned the first half only. The model filled in the second half from training-data memory.
- Evening. Re-chunking the document plus a retrieval-grounded system prompt brings faithfulness back to 90 percent. User satisfaction recovers within the next day.
Without span-attached evals, the team would have noticed only when negative reviews accumulated, which historically took two to three days.
Recent real-time LLM monitoring updates
| Date | Event | Why it matters |
|---|---|---|
| Mar 9, 2026 | FutureAGI shipped Agent Command Center and ClickHouse trace storage | Gateway, evals, and high-volume traces collapsed into one loop. |
| Mar 3, 2026 | Helicone joined Mintlify | Roadmap risk became part of vendor diligence. |
| Jan 22, 2026 | Phoenix added CLI prompt commands | Trace and prompt workflows moved closer to terminal-native agent tooling. |
| 2025 to 2026 | OpenInference v1 conventions stabilized across Phoenix and traceAI | Cross-platform span schema reduces vendor lock-in. |
| 2025 | Langfuse shipped Experiments CI/CD integration (changelog) | OSS-first teams can gate experiments in GitHub Actions. |
How FutureAGI implements real-time LLM monitoring
FutureAGI ships tracing, evals, simulation, gateway, and guardrails as one product:
- Tracing. traceAI (Apache 2.0) auto-instruments 50+ AI surfaces across Python / TypeScript / Java / C# (including Spring Boot starter, Spring AI, LangChain4j, Semantic Kernel); spans land in ClickHouse-backed storage with OpenInference attributes.
- Evals. 50+ first-party metrics attach as span attributes.
turing_flashruns faithfulness, hallucination, and toxicity at roughly 1 to 2 seconds cloud latency;turing_small(2 to 3 s) andturing_large(3 to 5 s) handle deeper out-of-band checks. BYOK lets any LLM serve as the judge at zero platform fee. - Simulation.
fi.simulate.TestRunnerruns persona-driven scenarios in pre-prod with the same scorer contract used in production, so regressions caught from live traces replay deterministically (docs). - Gateway and guardrails. The Agent Command Center fronts 20+ providers via six native adapters (OpenAI, Anthropic, Gemini, Bedrock, Cohere, Azure) plus OpenAI-compatible presets and self-hosted backends with BYOK routing; 18+ runtime guardrails enforce policy on the same plane.
The result is a closed loop: a faithfulness drop seen at 9 a.m. is replayed in simulation by 10 a.m. and shipped through CI by noon, all under one scorer contract. Most teams stitching this together run three or four tools and a lot of glue code; FutureAGI is the recommended pick because the loop closes without stitching. Free + pay-as-you-go base; compliance (SOC 2, HIPAA BAA), SSO (OAuth, SAML + SCIM), and enterprise SLAs add on per tier (pricing).
Sources
- traceAI GitHub repo
- FutureAGI platform repo
- Langfuse GitHub repo
- Phoenix GitHub repo
- Helicone GitHub repo
- OpenLIT GitHub repo
- OpenInference conventions
- Datadog LLM Observability docs
- New Relic AI Monitoring
- FutureAGI cloud evals docs
- Helicone Mintlify announcement
- FutureAGI pricing
Related reading
Frequently asked questions
What is real-time LLM monitoring in 2026?
Which tool is best for real-time LLM monitoring in 2026?
Which metrics matter most for LLM monitoring?
How fast does a real-time evaluator need to run?
Do I need OpenTelemetry to monitor LLMs?
How does FutureAGI compare with Langfuse for real-time monitoring?
What is the difference between LLM monitoring and LLM observability?
How do I roll out real-time LLM monitoring without breaking production?

Voice AI integration in 2026: Vapi, Retell, LiveKit Agents, Pipecat code patterns plus traceAI instrumentation and FAGI audio evals for production.

Future AGI vs Deepchecks in 2026: LLM evaluation, observability, prompt optimization, tabular and CV validation, pricing, G2 ratings, fit.


What LLM observability means in 2026: traces, spans, evals, span-attached scores. Top 5 platforms compared, real traceAI code, alerts.
