LLM Eval Monitoring Dashboards: The Four Panels That Drive Action
Eval dashboards are not Grafana for LLM logs. Four panels that actually drive action: rubric trends, per-route delta, Error Feed top-N, cost/resolved.
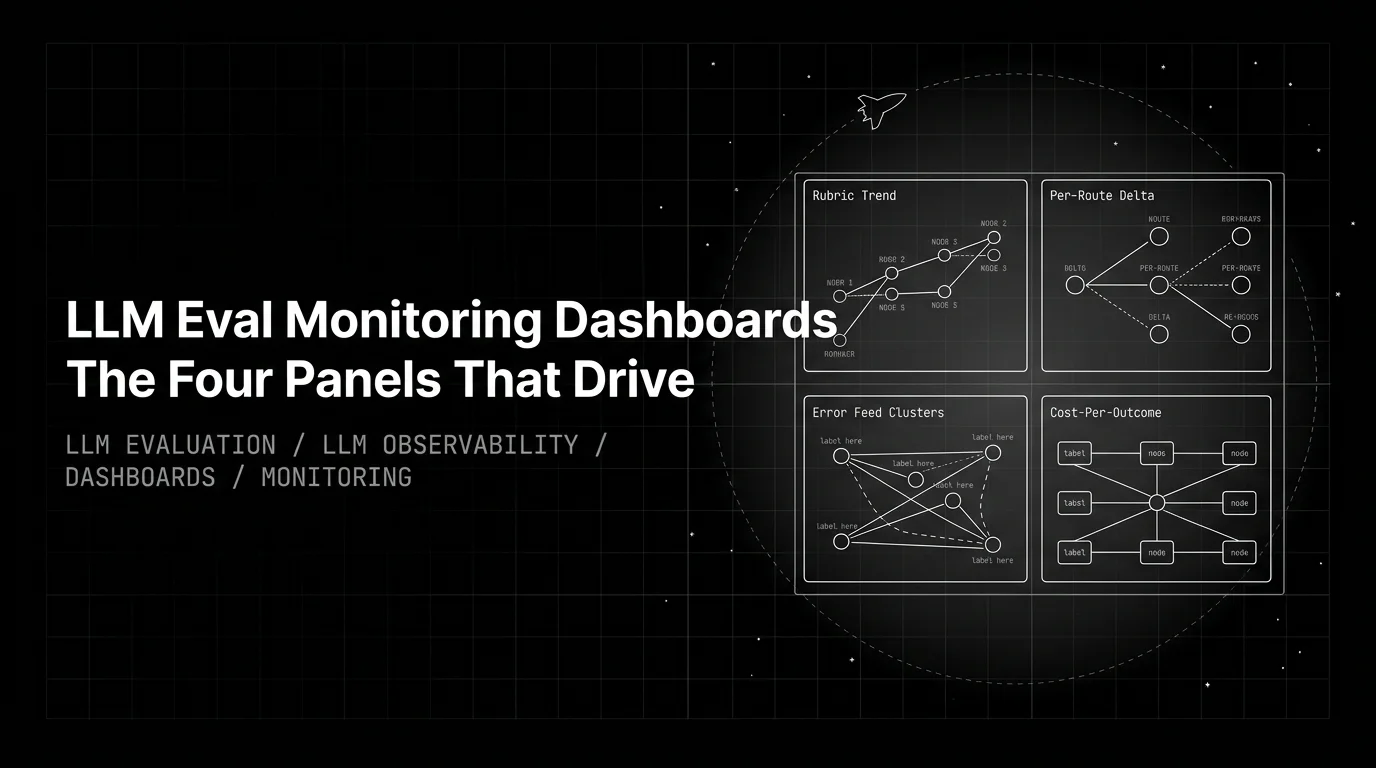
Table of Contents
Eval dashboards are not Grafana for LLM logs. The dashboard that drives action shows the top-3 per-rubric trend, the per-route delta, the Error Feed cluster top-N, and the cost per resolved conversation. Everything else is decoration. This post is the working pattern for those four panels: what each one shows, what data wires it, what alert fires off it, and which decisions it forces the team to make.
The opinion the post earns: most LLM eval dashboards are theaters of data. They pile on widgets, charts, and percentile rollups because the underlying eval stack emits dozens of signals per trace. The result is a screen nobody opens by reflex and an incident every two months that the dashboard could have predicted but did not surface. Four panels is the count where the dashboard becomes a habit instead of a postmortem artifact.
What an eval dashboard is for
The dashboard’s job is to surface the next decision in under thirty seconds. Three tests for whether a widget belongs:
- Does the cell change a next action? A bar dropping from 4.3 to 4.1 means open the trace. A heatmap of token counts by hour means nothing without a follow-up. If no one can name the action, the widget is decoration.
- Does the widget have an owner? The product lead reads the rubric trend. The platform engineer reads the cost figure. The safety on-call reads the cluster list. If two roles claim a widget, neither will act on it.
- Does the alert off this widget have a runbook? A page with no runbook becomes Slack noise inside a quarter. The dashboard’s reach is bounded by what the on-call can do at 3 AM.
The four panels below pass all three tests. The rest of the eval stack still emits the signals teams need for deep-dive analysis, postmortems, and CI gates. Those signals belong in detail views, not on the dashboard.
A useful split: the twelve-metric conversation monitoring catalog is the right vocabulary for measurement. Twelve panels on a single screen is the wrong layout for action. The dashboard reads three rubrics off the catalog of twelve; the rest live in CI gates, SLO pages, or weekly KPI reviews.
Panel 1: top-3 per-rubric trend
The most-load-bearing single chart on the dashboard. Three rubrics, week-over-week, on the same axis, with a rolling baseline overlay.
What it shows. Pick the three rubrics that map to the agent’s hardest failure modes. For a RAG-heavy support agent: Groundedness, ContextAdherence, TaskCompletion. For a tool-using planning agent: LLMFunctionCalling, TaskCompletion, optimal_plan_execution. For a customer-facing chat agent: ConversationResolution, Groundedness, Tone. Three is the cap; four is where the lines start to overlap and the eye starts to skip.
Why three. The agent’s failure landscape is wide but its load-bearing failures are narrow. One rubric is too thin (a single bad week reads as a crisis). Five rubrics is too noisy (the eye averages across them). Three is the count where each line stays distinct and each delta still localizes.
How to wire it. Score every captured trace with the three rubric templates via EvalTag instrumentation on traceAI. The score lands on the span as an attribute; the dashboard reads the weekly mean and overlays the four-week rolling baseline.
from fi.evals import Evaluator
from fi.evals.templates import Groundedness, ContextAdherence, TaskCompletion
from fi.testcases import TestCase

evaluator = Evaluator(fi_api_key="...", fi_secret_key="...")

result = evaluator.evaluate(
    eval_templates=[
        Groundedness(),
        ContextAdherence(),
        TaskCompletion(),
    ],
    inputs=[TestCase(
        query="What's the warranty on the Pro plan?",
        response="The Pro plan includes a 30-day warranty.",
        context="Pro plan: 14-day money-back guarantee. Enterprise: 30-day SLA.",
    )],
)
In a production observation pipeline, the same templates run as EvalTag on every captured trace, so the scores attach to the right span automatically and the dashboard reads them off the trace tree.
The alert. A rubric mean drops more than 3% from the rolling four-week baseline. Per rubric, not per dashboard; a 3% drop on Toxicity carries different weight than a 3% drop on Groundedness. Pair with a drift signal (Kolmogorov-Smirnov or PSI) on the distribution shape, because a flat mean can hide a new bimodal cluster of bad outputs.
What the panel does not show. The other 57+ rubrics in the ai-evaluation SDK. They exist, they run in CI, and they live in the rubric-detail view linked off the trend chart. They do not belong on the dashboard headline. For the full rubric catalog, see the agent metrics frameworks guide.
Panel 2: per-route delta
The localization panel. Same three rubrics as panel 1, broken down per production route, with the week-over-week delta highlighted.
What it shows. A small table. Rows are the production routes (checkout-assistant, billing-agent, retrieval-qa, internal-ops, etc.). Columns are the three rubrics. Each cell carries this week’s score and the delta from last week, colored by direction and magnitude. A red cell tells the engineer which route to open, not just that something somewhere regressed.
Why this panel exists. Without it, an aggregate drop on panel 1 forces a search across every prompt, every model variant, every retrieval index. With it, the regression localizes in one glance. The billing-agent route’s Groundedness dropped from 4.2 to 3.6 while every other route held steady — that is the line of investigation the engineer follows next, and the dashboard pointed at it instead of forcing a hunt.
How to wire it. The route name is a span attribute on every captured trace. The gateway already tags every request with x-prism-routing-strategy, and the request itself carries the route id. Group the per-rubric scores by route attribute and compute the week-over-week delta. The hard part is naming the routes consistently across the codebase; the dashboard query is straightforward once the tagging is.
The alert. Per-tenant rubric score drops below an SLA threshold. The aggregate panel-1 trend can look healthy when one enterprise customer’s score is at the floor; the per-route delta is where that drop is visible. For the top-N customers, set per-tenant thresholds; for the rest, cohort the routes by tier and alert at the cohort floor.
What the panel does not show. Latency, cost, or guardrail data per route. Those belong on panels 3 and 4. The per-route delta is single-purpose: regression localization on the load-bearing rubrics.
Panel 3: Error Feed cluster top-N
The named-issue panel. Open Error Feed clusters ranked by severity multiplied by size, with the cluster name, the immediate_fix recommendation, the trace count, the age, and a click-through to the representative trace.
What it shows. A short list, usually five to ten rows. Each row is a cluster of failing traces that HDBSCAN soft-clustering grouped together and a Sonnet 4.5 Judge agent investigated. The Judge writes the cluster’s root cause, evidence quotes from the traces, an immediate_fix recommendation, and a four-dimensional score (factual_grounding, privacy_and_safety, instruction_adherence, optimal_plan_execution, each on 1-5).
Why this panel exists. Without it, engineers investigate one failing trace at a time. The same failure mode shows up across five traces this week, nobody connects them, and the fix lands in the next sprint at the earliest. With it, the cluster carries the diagnostic. Five traces of Groundedness < 3 that all share the pattern “agent invents policy from outside the retrieved chunk” are one bug to fix, not five tickets to triage. The cluster also explains itself: the Judge writes the RCA inline, so the engineer can decide whether to fix the prompt, escalate to retrieval, or close the cluster as a known-bad pattern in under a minute.
How to wire it. Error Feed runs the HDBSCAN clustering over span embeddings, runs the Sonnet 4.5 Judge agent with a 30-turn budget and 8 span-tools, and emits the cluster record as a row keyed by the cluster id. The dashboard reads the open clusters ordered by severity and size. Today Error Feed fires Linear tickets when a cluster crosses HIGH severity; Slack, GitHub, Jira, and PagerDuty integrations are on the roadmap.
The alert. A new cluster crosses severity HIGH. The runbook specifies owner, expected response time, and what counts as resolution (a code fix, a prompt change, a known-bad pattern marked as accepted). A weekly cluster-triage meeting walks the list, marks duplicates, closes resolved ones, and escalates the new HIGH-severity ones.
What the panel does not show. Individual traces. Each row links to the representative trace and the cluster’s full membership; the dashboard headline lists the cluster, not the traces.
Panel 4: cost per resolved conversation
The unit-economics panel. Dollars divided by sessions that closed cleanly, per route, with the running monthly trend.
What it shows. Two views side by side. The headline number is dollars-per-resolution, this week and last week, with the percent delta. The smaller chart is the running 14-day trend per route. The same routes as panel 2; the same denominator (resolved sessions) as the ConversationResolution rubric on panel 1.
Why cost-per-resolution, not cost-per-call. A cheap call that fails and re-routes is more expensive per outcome than a costly call that closed the ticket. Raw token spend hides routing decisions. The right denominator is sessions that resolved cleanly; the right numerator is total spend across every span in the session, including retries, retrieval, guardrail evaluations, and the LLM-judge rubric scoring itself.
How to wire it. Tag every span with the resolution outcome (resolved, escalated, abandoned) and the model id. The gateway’s response headers do most of the data capture: every request through https://gateway.futureagi.com/v1 returns x-prism-cost, x-prism-latency-ms, x-prism-model-used, x-prism-fallback-used, x-prism-routing-strategy, and x-prism-guardrail-triggered. The numerator sums the x-prism-cost across every span in the session; the denominator counts sessions where ConversationResolution scored above the resolution threshold.
The alert. Cost-per-resolution drifts above the previous-model floor by more than 15% on a rolling window. Reset the baseline after every model swap, because the cost curve shifts. Pair with a fallback-hit-rate widget driven by x-prism-fallback-used so a cost spike from provider degradation is visible separately from a regression in the agent’s resolution rate. For the cost story end to end, see AI agent cost optimization and observability.
What the panel does not show. Per-developer chargeback, per-team budget burn, or hierarchical budget hierarchy detail. Those live in the gateway’s FinOps view, which is its own surface. The dashboard headline is the unit-economics figure that finance and engineering can both act on without leaving the screen.
The anti-pattern: dashboard sprawl
Most teams arrive at four panels by deleting, not by designing. The starting state is a screen with 40 widgets, two-thirds of which nobody opens, alerts that fire weekly and have no owner, and a per-tenant breakdown that does not exist. The path to a working dashboard is the discipline of removal.
Four sprawl symptoms to watch for:
- The mega-page. Someone tried to make a single dashboard that serves product, engineering, finance, and safety. Nobody owns it. Everyone scrolls past the widgets that are not theirs. The fix is the four-panel rule plus role-specific detail views off the headline.
- Alerts without owners. A Slack channel where alerts arrive and nobody is on the hook. Three weeks in, the channel is muted. The fix is owner-per-alert plus a quarterly review that retires alerts no one is acting on.
- No per-route breakdown. The aggregate looks fine while one route is degrading. The first signal is a renewal call. The fix is panel 2, with per-route thresholds set per top tenant for the load-bearing customers.
- No cluster review cadence. The Error Feed clusters accumulate and engineers investigate one trace at a time. The fix is a weekly 30-minute cluster triage that closes resolved clusters and escalates new HIGH-severity ones.
The rule that captures all four: every widget passes the three tests, every alert has an owner, and the screen survives a quarterly cull. The widgets that survive are the dashboard the team actually opens by reflex.
The FAGI dashboard surface
Three FAGI surfaces feed every panel.
traceAI is the OpenTelemetry-compliant instrumentation layer. It emits the spans that carry retrieval context, tool calls, generations, and per-rubric eval scores as span attributes. Teams that prefer Grafana, Datadog, or Honeycomb pipe these spans to whichever OTel backend they run; the rubric scores travel as span attributes and the gateway headers travel as resource attributes. Fifty-plus AI surfaces across Python, TypeScript, Java, and C# cover most production agent stacks.
from fi_instrumentation import register
from fi_instrumentation.fi_types import ProjectType
from traceai_openai import OpenAIInstrumentor

trace_provider = register(
    project_type=ProjectType.OBSERVE,
    project_name="orders-agent",
)
OpenAIInstrumentor().instrument(tracer_provider=trace_provider)
Agent Command Center is the hosted product. It ships the four panels as a built-in dashboard, runs the eval pipelines that attach scores to spans, exposes the gateway at gateway.futureagi.com, hosts the Error Feed cluster store, and renders the cost-per-resolution figure off the gateway’s Prometheus surface. Hierarchical budgets (org, team, user, key, tag) and routing strategies are configured here and surface as the detail view linked off panel 4.
Error Feed sits inside the eval stack. HDBSCAN soft-clustering plus a Sonnet 4.5 Judge agent with a 30-turn budget and 8 span-tools writes the cluster’s RCA, evidence quotes, and immediate_fix. Each cluster becomes a named issue in panel 3. Linear ticket creation fires on severity HIGH today; Slack, GitHub, Jira, and PagerDuty are on the roadmap.
The data path is the same regardless of where the dashboard lives. One span tree per session. Three measurement paths: span attributes (latency, cost), inline guardrails (PII, prompt-injection at request time), and end-of-session rubrics (everything else). Four panels read off the same tree.
How Future AGI ships the four panels
The eval stack ships as a package because every panel reads from every layer.
- ai-evaluation (Apache 2.0): 60+
EvalTemplateclasses includingGroundedness,ContextAdherence,TaskCompletion,ConversationResolution,DataPrivacyCompliance,AnswerRefusal,Tone, plus the 11CustomerAgent*rubrics. Run sync, async viaevaluator.submit(), or on the trace viaEvalTag. The rubrics that populate panel 1 and panel 2 live here. - Future AGI Platform: self-improving evaluators tuned by thumbs feedback; in-product authoring agent writes domain-specific rubrics from natural-language descriptions; classifier-backed evals at lower per-eval cost than Galileo Luna-2.
- traceAI (Apache 2.0): OpenTelemetry SDK, 50+ AI surfaces across Python, TypeScript, Java, C#; auto-instrumentation for OpenAI, LangChain, LangGraph, Groq, Portkey, Gemini; 14 span kinds with first-class
RETRIEVER,TOOL, andAGENT; PII redaction on span attributes. The spans on every panel come off this layer. - Agent Command Center: OpenAI-compatible gateway in a single Go binary, 100+ providers, 6 gateway response headers, 5-level hierarchical budgets, 18+ built-in guardrail scanners plus 15 third-party adapters; SOC 2 Type II, HIPAA, GDPR, CCPA certified per futureagi.com/trust. Panel 4 reads cost-per-resolution off the gateway’s Prometheus surface; the per-route delta on panel 2 reads the route id off the gateway tag.
- Error Feed: HDBSCAN soft-clustering plus the Sonnet 4.5 Judge writes
immediate_fix. Panel 3 is this surface rendered on the dashboard. - Protect: four Gemma 3n LoRA adapters plus Protect Flash; 65 ms text and 107 ms image median time-to-label per arXiv 2510.13351; inline guardrail at the gateway. Powers the per-route guardrail-fire delta that links off panel 2.
Three honest tradeoffs. The full rubric stack on 100% of traffic is expensive; sample the LLM-judge rubrics on panels 1 and 2 at 5-10% and gate the deterministic ones at 100%. The Sonnet 4.5 Judge on Error Feed is the most expensive component on the dashboard; the prompt-cache hit ratio runs near 90% to keep the per-cluster cost bounded. Cost-per-resolution requires the resolution-outcome tag on every span; teams that have not wired the tag yet read raw cost-per-session until it lands.
The dashboard surface in Agent Command Center ships the four panels out of the box. Teams that run their own observability stack get the same panels by mapping rubric scores onto OTel span attributes and gateway headers onto resource attributes; the agent observability tools overview covers the mapping.
Ready to wire the four panels? Start with Groundedness, TaskCompletion, and ConversationResolution as the load-bearing rubrics; instrument the agent via EvalTag on traceAI; route through the gateway so panel 4 reads off the cost headers; turn on Error Feed clustering once the trace volume crosses a few hundred per day. The dashboard becomes useful at week two and earns its keep at week four when the first regression localizes to a single route before the user reported it.
Related reading
Frequently asked questions
What are the four panels every LLM eval dashboard needs?
Why not 12 metrics or a five-layer dashboard set?
What goes on the per-route delta panel?
How does Error Feed cluster top-N drive action?
Why cost per resolved conversation and not raw token spend?
Can I use Grafana or Datadog for this?
What is the most common dashboard anti-pattern?
How to evaluate LiteLLM-routed apps: paired comparison across providers on your data, tool-call parity, latency parity, and the gateway alternative.

Streaming LLM evaluation is four metrics, not one. TTFT, inter-token p99, mid-stream consistency, premature termination. The honest 2026 playbook.
The pillar playbook for LLM evaluation in 2026: dataset, metrics, judge, CI gate, production observation, closed loop from failing trace to regression.
