Evaluating Modal LLM Inference Apps in 2026: Cold/Warm/Concurrent Latency Parity, Tail Quality Under Burst, and Shutdown-Determinism
Evaluate Modal-served LLM apps in 2026: per-type latency parity (cold, warm, concurrent), p99 tail quality under burst, shutdown determinism.
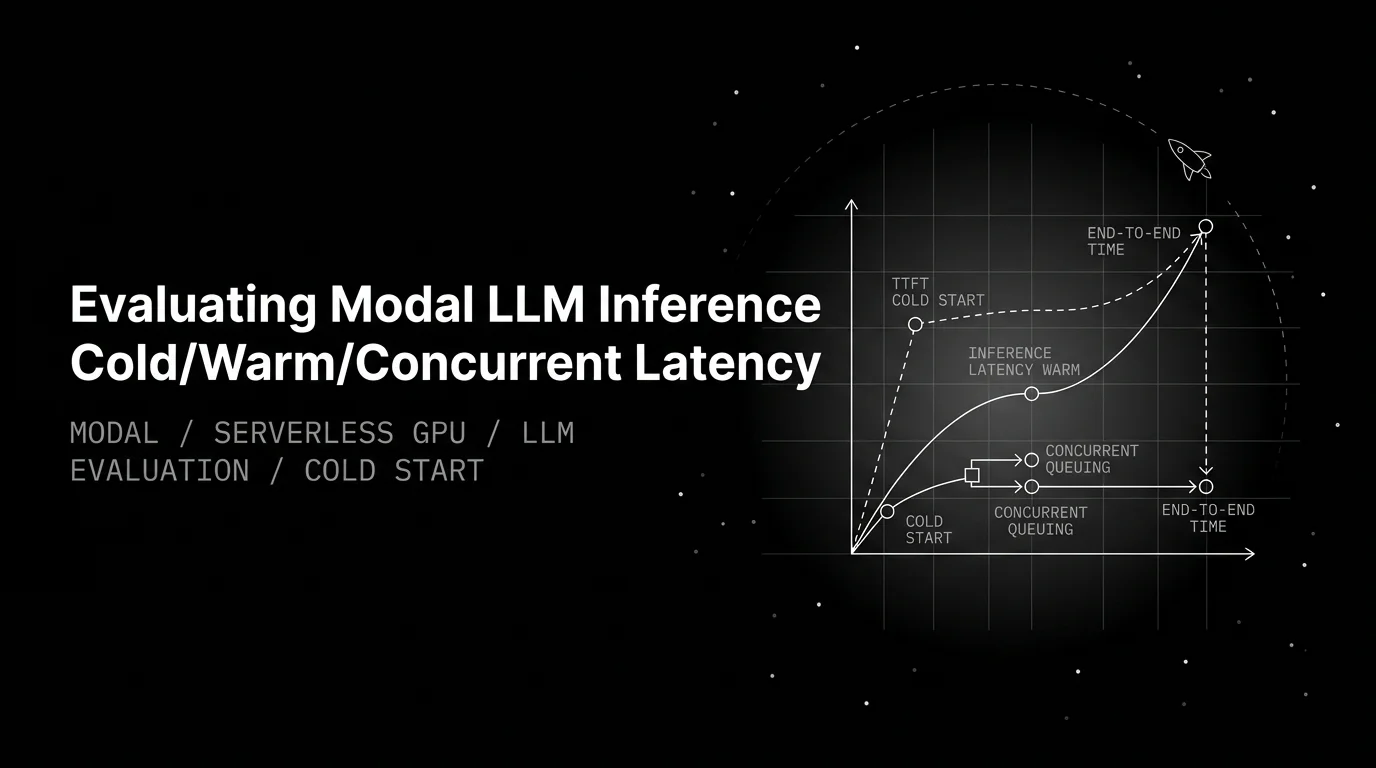
Table of Contents
Modal sells serverless GPU with per-second billing and scale-to-zero. That elasticity is the reason teams pick it for open-weight LLM inference, and it’s the reason a fixed-deployment eval misses 60% of the failure surface. The same Llama 3.3 70B on a vLLM-on-H100 box has one latency distribution; on Modal it has at least three, and they don’t average cleanly. The eval that catches Modal’s real failure modes scores cold/warm/concurrent separately, measures tail quality under burst, and verifies that the shutdown behavior you configured is the shutdown behavior you got.
This is the opinion this post earns. Cold start, warm start, and concurrency limits create eval blind spots. Per-invocation-type latency parity, p99 tail quality under burst, and shutdown-determinism are the three checks Modal-specific eval has to cover. Skip them and you ship a deployment that’s fast on the demo and broken under load. Get them right and you have a serverless inference stack that holds its SLO across the regimes real traffic actually hits.
The shape draws on the ai-evaluation SDK, the traceAI OpenAI instrumentor, and the Agent Command Center gateway. For the sibling story on managed open-weight providers, see evaluating Fireworks AI and Together AI inference. For the catalog side of Modal alternatives, see best Modal LLM serving alternatives.
Why Modal needs a Modal-specific eval
A fixed self-hosted deployment has predictable latency, predictable throughput, and a predictable hourly bill. A managed API like OpenAI or Anthropic has a vendor SLA and a per-token price. Modal sits between them and inherits the awkward parts of both.
Cold starts are user-facing latency, not vendor latency. Modal scales containers down to zero between bursts to save GPU-seconds. The first request after an idle period has to pull the container image, attach a GPU, load model weights into VRAM, and warm any compile caches before it can decode a single token. A Llama 3.3 8B in INT8 can do this under two seconds with image pre-warming and keep_warm. A 70B in BF16 can take ten or more. Either way, the cold tail is not something you can disclaim — it’s an attribute of your application that a user feels on the first request of every session.
Warm latency drifts with the scaler, not the GPU. When traffic ramps from one request per second to a hundred, Modal spawns more replicas. The spawn takes seconds. If the scaler is conservative, requests queue behind the existing replicas and the warm p99 you reported in benchmarks gets buried under tens of seconds of queue time. If the scaler is aggressive, you pay for replicas that idle. p99 latency under burst depends on the scaler’s reaction time, not on the model’s decode speed.
Concurrency changes the answer, not just the cost. Modal bills GPU-seconds. A function with concurrency_limit=1 serves one request per replica and burns the same GPU-second-per-token as a fixed deployment. The same function with concurrency_limit=10 shares one GPU across ten requests, drops per-token cost by roughly an order of magnitude — and shifts the content-quality distribution because KV-cache pressure rises and the scheduler interleaves token generation. Free-form chat often holds. Long-context retrieval, strict-JSON outputs, and three-step tool composition often don’t.
These three properties compose into three eval checks. The next sections walk each one with the eval primitive that runs it. For the broader observability picture across self-hosted runtimes, see the self-hosted LLM observability guide.
TL;DR: three checks plus a quality baseline
| Check | What it measures | Misses if you skip it |
|---|---|---|
| Per-invocation-type latency parity | p50/p95/p99 first-token and total, per cold/warm/concurrent regime | Cold tail buried in warm aggregate; burst queueing hidden in p50 |
| Tail quality under burst | Groundedness and tool-call correctness at p99 under realistic concurrency | Quality drift when several large-context calls share a replica |
| Shutdown-determinism | Whether keep_warm, min_containers, and scaledown_window behave as configured | Cold starts inside supposedly warm windows; SLO becomes a lottery |
| Content quality baseline | Groundedness, ContextAdherence, TaskCompletion, LLMFunctionCalling against golden set | Model-level regressions across releases |
| Per-concurrency cost | GPU-second cost amortized at 1/10/100/1000 RPS | Cost-per-million-token chart off by 10x |
Ship only when the three Modal-specific checks pass on the exact GPU class, the exact concurrency setting, and the exact traffic shape you’re routing to. Anything else is the warm benchmark and the production behavior pretending to be the same artifact.
Check 1: per-invocation-type latency parity
Aggregate p99 is the wrong number for a serverless GPU runtime. Tag every span with modal.invocation_type=cold|warm|concurrent and compute percentiles per tag. Three regimes, three distributions, three SLOs.
Cold. Build a cold-start scenario in your load generator: idle long enough to force scale-to-zero (Modal’s default scaledown_window is two to five minutes depending on function config), then fire one request and record end-to-end latency. Repeat across times of day and across container-image sizes. The variance matters as much as the mean — a cold start that lands at 2.3s on a Tuesday morning can land at 8.1s on a Sunday night when image-cache locality is colder.
Warm. Drive the function with steady traffic at the concurrency you expect in production. Record p50, p95, and p99 separately for time-to-first-token and total time. The traceAI OpenAI instrumentor captures token counts and timing automatically once you register the project, so the warm distribution rides on the trace tree with no extra wiring.
Concurrent. Ramp to the burst shape your traffic actually hits. Most Modal apps see one of two patterns: smooth ramp (1 RPS to 50 RPS over a minute) or step burst (sustained 5 RPS punctuated by 30 RPS spikes for 10 seconds). Score both. The step burst is where the scaler’s reaction time shows up as queue time and the warm replicas pack concurrent requests until the new replicas arrive.
import asyncio, time
from openai import AsyncOpenAI
from fi_instrumentation import register, ProjectType, using_attributes
from traceai_openai import OpenAIInstrumentor

trace_provider = register(
    project_type=ProjectType.OBSERVE,
    project_name="modal-llama-3-70b",
)
OpenAIInstrumentor().instrument(tracer_provider=trace_provider)

client = AsyncOpenAI(
    base_url="https://<workspace>--llama70b.modal.run/v1",
    api_key="modal-token",
)

async def one_call(prompt: str, invocation_type: str):
    with using_attributes({
        "llm.system": "modal",
        "modal.invocation_type": invocation_type,
        "modal.cold_start_ms": 0,  # populated from response header below
    }):
        t0 = time.time()
        resp = await client.chat.completions.create(
            model="meta-llama/Llama-3.3-70B-Instruct",
            messages=[{"role": "user", "content": prompt}],
            max_tokens=512,
        )
        cold_ms = int(resp.response_headers.get("x-modal-cold-start-ms", 0))
        return {
            "total_ms": (time.time() - t0) * 1000,
            "cold_ms": cold_ms,
            "invocation_type": invocation_type,
        }
Have your Modal function set x-modal-cold-start-ms on the response when it detects a cold path (vLLM logs Model loaded in N seconds on first request; copy that into the header). Filter the trace tree on modal.invocation_type and you get three latency distributions that mean something. Aggregate p99 across all three is the number you stop reporting.
A defensible SLO looks like: cold p95 under 5s, warm p99 under 800ms TTFT, concurrent p99 under 1.5s TTFT at the steady-state concurrency you ship. The exact budgets depend on your model and GPU class. The shape — three numbers, not one — does not.
Check 2: tail quality under burst
Latency is half the eval. Content quality under burst is the other half, and most teams never measure it because their golden-set runs at concurrency=1.
The mechanism is concrete. Modal’s request mux packs concurrent requests into one GPU process to amortize the GPU-second cost. That packing is what makes serverless economical. It’s also what shifts the answer-quality distribution: KV-cache pressure rises with concurrent token counts, prefix-cache reuse drops when prompts diverge, and the scheduler interleaves token generation across requests in ways that subtly change sampling for downstream tokens. Free-form chat often holds. Strict-JSON adherence drops 3 to 8 points on the second concurrent request. Three-step tool composition loses arguments. Long-context retrieval grounds well on a single 128k request and grounds poorly on the third concurrent 128k request.
Run your golden set under realistic concurrent load and score the p99 of the quality metric, not the p50.
from fi.evals import Evaluator
from fi.evals.templates import (
    Groundedness, ContextAdherence, TaskCompletion, LLMFunctionCalling
)

ev = Evaluator(fi_api_key=API_KEY, fi_secret_key=SECRET_KEY)

# Score the same golden set at three concurrency tiers
for tier in [1, 10, 50]:
    cases = load_golden_set_at_concurrency("modal_rag_v2.jsonl", concurrency=tier)
    results = ev.evaluate(
        eval_templates=[
            Groundedness(),
            ContextAdherence(),
            TaskCompletion(),
            LLMFunctionCalling(),
        ],
        inputs=cases,
    )
    log_p99_per_template(tier, results)
The shape that matters is the p99 delta across tiers. A 0.92 mean Groundedness at concurrency=1 and 0.91 at concurrency=50 is fine. A 0.92 mean at concurrency=1 and a 0.61 p99 at concurrency=50 is a tail-quality regression you cannot ship. The same shape applies to LLMFunctionCalling for tool-using agents — argument-shape drift under load is silent at p50 and load-bearing at p99.
For long-context-specific failures, add ChunkAttribution and ChunkUtilization from the standard template set. They catch the retrieval-pattern degradations where the model starts ignoring later chunks under shared-replica pressure.
Check 3: shutdown-determinism
The third axis is the one teams underweight and operations on-call learns about at 3am. Modal scales containers down to zero by default. keep_warm, min_containers, and scaledown_window change when shutdown fires. Teams often set one and assume the others. The deployment ships, looks fine in staging, and starts cold-starting users in production because the warm window doesn’t behave the way the config implies.
Shutdown-determinism is whether the model stays loaded in VRAM between requests in the way you configured. Verify it on every release, not at deploy time.
The test is a strict timing sweep. Fire requests at intervals that straddle the configured scaledown_window: timeout minus 10s, timeout exactly, timeout plus 10s, timeout plus 60s. Tag each span with the actual modal.cold_start_ms from the response header. If you see cold starts inside the supposedly warm window — say, a request at timeout-minus-10s landing on a cold container — the deployment isn’t shutdown-deterministic and your latency SLO is a lottery.
The fix is usually one of three: lower the scaledown_window so the warm window matches what the config implies, set min_containers=1 so a replica is always hot (cost-up, latency-flat), or tune the request-mux behavior so concurrent traffic keeps the replica alive in the way the scheduler expects.
Score the sweep with a ShutdownDeterminism custom judge built on CustomLLMJudge.
from fi.evals.metrics.llm_as_judges.custom_judge.metric import CustomLLMJudge
from fi.evals.llm.providers.litellm import LiteLLMProvider

shutdown_det = CustomLLMJudge(
    provider=LiteLLMProvider(),
    config={
        "name": "shutdown_determinism",
        "model": "claude-sonnet-4-5-20250929",
        "grading_criteria": (
            "Given the configured scaledown_window and the measured cold_start_ms "
            "across a strict timing sweep, return PASS if no cold start fires "
            "inside the configured warm window and FAIL otherwise. "
            "Explain which interval the deployment failed at."
        ),
    },
)
Run it weekly. Shutdown behavior drifts silently between Modal SDK versions and between infrastructure changes you don’t control. A check that passes today can fail next month after a Modal release rolls out a different default. The judge catches the drift before the on-call rotation does.
Standard content quality baseline
Before any of the three Modal-specific checks earn their place, run the standard rubric set against your golden set. Groundedness, ContextAdherence, ContextRelevance, Completeness for RAG. TaskCompletion and LLMFunctionCalling for agents. AnswerRefusal, Toxicity, PromptInjection, DataPrivacyCompliance for any user-facing surface.
from fi.evals import Evaluator
from fi.evals.templates import (
    Groundedness, ContextAdherence, TaskCompletion, LLMFunctionCalling,
    AnswerRefusal, Toxicity, PromptInjection,
)

ev = Evaluator(fi_api_key=API_KEY, fi_secret_key=SECRET_KEY)

cases = load_golden_set("modal_rag_v2.jsonl")  # 200 cases
results = ev.evaluate(
    eval_templates=[
        Groundedness(),
        ContextAdherence(),
        TaskCompletion(),
        LLMFunctionCalling(),
        AnswerRefusal(),
        Toxicity(),
        PromptInjection(),
    ],
    inputs=cases,
)
If the baseline regresses, fixing latency parity or shutdown-determinism won’t save the deployment. The baseline is the floor; the three Modal-specific checks are the ceiling. For rubric design and dataset shape, see the 2026 LLM evaluation playbook. For the parity reference against a fixed deployment, see evaluating vLLM self-hosted LLM apps.
The traceAI integration for Modal
Modal exposes a regular HTTPS endpoint and most teams front it with an OpenAI-compatible router (vLLM’s OpenAI server, SGLang, or TGI), so the traceAI OpenAI instrumentor covers it with base_url pointing at the Modal endpoint. Three custom attributes via using_attributes give you everything the three checks need.
from fi_instrumentation import register, ProjectType, using_attributes
from traceai_openai import OpenAIInstrumentor
from openai import OpenAI

trace_provider = register(
    project_type=ProjectType.OBSERVE,
    project_name="modal-llm-prod",
)
OpenAIInstrumentor().instrument(tracer_provider=trace_provider)

client = OpenAI(
    base_url="https://<workspace>--llama70b.modal.run/v1",
    api_key="modal-token",
)

def call(prompt: str, invocation_type: str, cold_ms: int = 0):
    with using_attributes({
        "llm.system": "modal",
        "modal.invocation_type": invocation_type,
        "modal.cold_start_ms": cold_ms,
    }):
        return client.chat.completions.create(
            model="meta-llama/Llama-3.3-70B-Instruct",
            messages=[{"role": "user", "content": prompt}],
        )
Every chat completion emits a standard fi.span.kind=LLM span with llm.model_name, llm.token_count.prompt, and llm.token_count.completion. The three custom attributes (llm.system, modal.invocation_type, modal.cold_start_ms) ride on the span tree so the per-invocation-type filters work in dashboards without an exporter rewrite. The same pattern works in TypeScript via @traceai/openai. For more on the underlying schema, see what is OpenInference in 2026.
The Agent Command Center for Modal eval
The gateway treats a Modal deployment as another OpenAI-compatible upstream alongside 100+ other providers. Add the Modal endpoint as an upstream with its base URL and API key, attach budgets and guardrails, and every gateway response carries the header set that makes per-call observability ride on the trace tree without extra instrumentation:
x-agentcc-model-used: the underlying model that actually served the request, which may differ from the requested model after a fallbackx-agentcc-cost: per-call GPU-second cost amortized over the requestx-agentcc-latency-ms: end-to-end latency measured at the gatewayx-agentcc-fallback-used: boolean indicating whether the call hit a fallback (so cost and parity scoring attribute correctly)x-agentcc-routing-strategy: the strategy that selected the upstream (round-robin, weighted, race, mirror, shadow)x-agentcc-guardrail-triggered: the scanner that fired if the call was blocked or modified
Shadow mode is the routing primitive that matters most for Modal eval. The gateway sends production traffic to your Modal endpoint and silently copies the same prompt to a backup — a different Modal function with min_containers=1 for the cold-tail fallback, or an API provider like Fireworks for the burst-overflow path. The backup response is logged but not returned to the caller, which makes per-invocation-type parity scoring run on real production traffic without affecting users. Race mode picks whichever upstream returns first (right for latency-sensitive paths, wrong for parity eval). Deploy the gateway BYOC in the same cloud account as your Modal workspace and the hop adds nothing meaningful to warm-path latency. For the broader gateway story, see the best self-hosted AI gateways comparison.
How Future AGI ships Modal eval
Future AGI ships the eval stack as a package. Start with the SDK and traceAI for code-defined gates. Add the gateway when shadow routing becomes the workflow. Graduate to the Platform when per-cluster routing across regimes is the bottleneck.
ai-evaluationSDK (Apache 2.0). 50+EvalTemplateclasses coveringGroundedness,ContextAdherence,TaskCompletion,LLMFunctionCalling,AnswerRefusal,PromptInjection,Toxicity, andDataPrivacyCompliance.CustomLLMJudgeis the primitive forShutdownDeterminismand any Modal-specific rubric you need. Nine open-weight guardrail backends (LLAMAGUARD_3_8B and 1B, QWEN3GUARD_8B and 4B and 0.6B, GRANITE_GUARDIAN_8B and 5B, WILDGUARD_7B, SHIELDGEMMA_2B) are themselves servable on Modal alongside your application model.traceAI. 50+ AI surfaces across Python, TypeScript, Java, and C#. The OpenAI-compatible instrumentor covers Modal out of the box. Three custom attributes (llm.system,modal.invocation_type,modal.cold_start_ms) ride on every span and feed the three Modal-specific checks.- Agent Command Center. Single Go binary, Apache 2.0, 100+ providers including Modal as an OpenAI-compatible upstream. Shadow mode for parity scoring; benchmarked at ~29k req/s, P99 21 ms with guardrails on, on t3.xlarge. Returns the header set above on every call. 18+ built-in guardrail scanners cover safety regardless of which upstream fired.
- Future AGI Platform. Self-improving evaluators that retune from production traces; in-product authoring agent that writes rubrics from natural-language descriptions; classifier-backed evals at lower per-eval cost than Galileo Luna-2. Error Feed clusters failing traces with HDBSCAN and a Sonnet 4.5 Judge writes the
immediate_fixper cluster. Typical Modal clusters: “cold start exceeds 5s on first request after 5-minute idle, fix: raisekeep_warmto 1 on the budget tier,” “concurrency=10 drops Groundedness p99 from 0.91 to 0.74 on long-context, fix: pin long-context routes to a different replica class,” “scaledown_window=120s but cold starts fire at 95s, fix: lower configured window to 90s to match observed shutdown behavior.” Eachimmediate_fixflows back into the routing policy at the gateway. Linear is the Error Feed external integration shipped today; Slack, GitHub, Jira, and PagerDuty are roadmap.
This is the closed loop FAGI ships and competitors don’t: traces feed the eval set, eval failures cluster into named issues, the immediate_fix becomes a gateway routing rule, the rule changes which Modal function serves the next request, and the next batch of traces validates whether the fix held. Other tools give you the parts. FAGI loops them.
Anti-patterns to avoid
Reporting one aggregate p99. The warm number looks healthy; the cold tail sits in the long tail and 5% of users feel it on the first request of every session. Tag spans with modal.invocation_type and compute percentiles per tag.
Single-concurrency testing. Real traffic is bursty. Content quality drifts when several requests share a replica. Run the golden set at three concurrency tiers (1, 10, 50) and score the p99 of the quality metric.
Treating keep_warm as set-and-forget. Shutdown behavior drifts between Modal SDK versions and infrastructure changes you don’t control. Verify shutdown-determinism on every release with the strict timing sweep above.
No per-concurrency cost tracking. GPU-second billing means cost-per-token varies sharply with concurrent batch size. The x-agentcc-cost header per gateway call gives you the real dollar number per span. Aggregate over a day and you get a true per-concurrency cost curve, not the Modal monthly bill arriving a month after the regression.
Where to go next
The three-check pattern works for any serverless GPU runtime, not only Modal. Per-invocation-type latency splits translate directly to Replicate, RunPod Serverless, and Beam. Tail-quality-under-burst applies to any runtime that packs concurrent requests onto shared GPUs. Shutdown-determinism is universal across scale-to-zero platforms.
For the sibling story on managed open-weight providers, see evaluating Fireworks AI and Together AI inference. For the parity reference against a fixed deployment, see evaluating vLLM self-hosted LLM apps. For the catalog of serverless GPU alternatives, see best Modal LLM serving alternatives.
A Modal-served LLM is two systems pretending to be one: the model and the runtime. Eval has to cover both, or it doesn’t cover either.
Frequently asked questions
Why does Modal need a Modal-specific eval, not the same eval you'd run on a fixed GPU?
What does per-invocation-type latency parity actually mean for a Modal app?
What is tail quality under burst and why does it fail silently on Modal?
What is shutdown-determinism and how do I test for it?
How do I instrument a Modal-served LLM with traceAI?
Does the Future AGI Agent Command Center route a Modal endpoint?
What's the worst anti-pattern for Modal LLM eval?

How to evaluate LiteLLM-routed apps: paired comparison across providers on your data, tool-call parity, latency parity, and the gateway alternative.

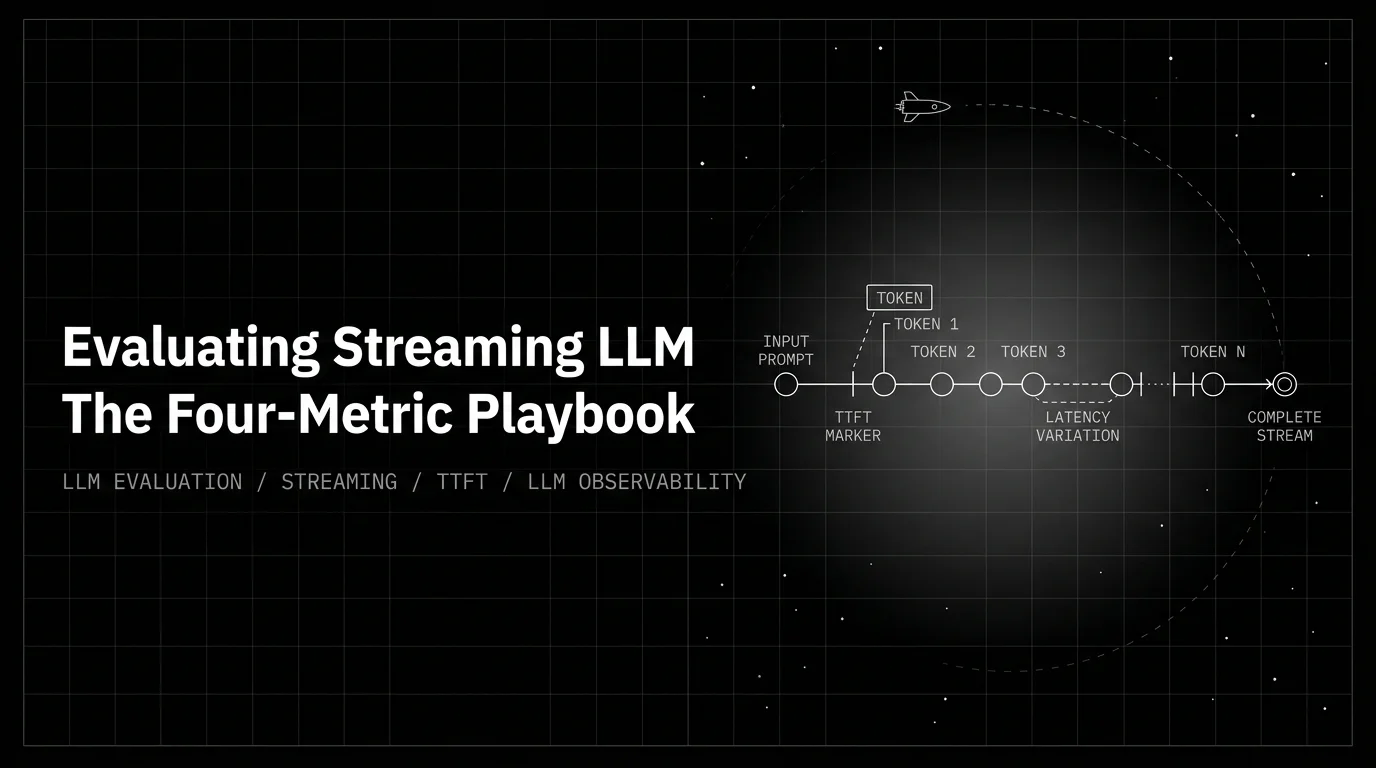
Streaming LLM evaluation is four metrics, not one. TTFT, inter-token p99, mid-stream consistency, premature termination. The honest 2026 playbook.
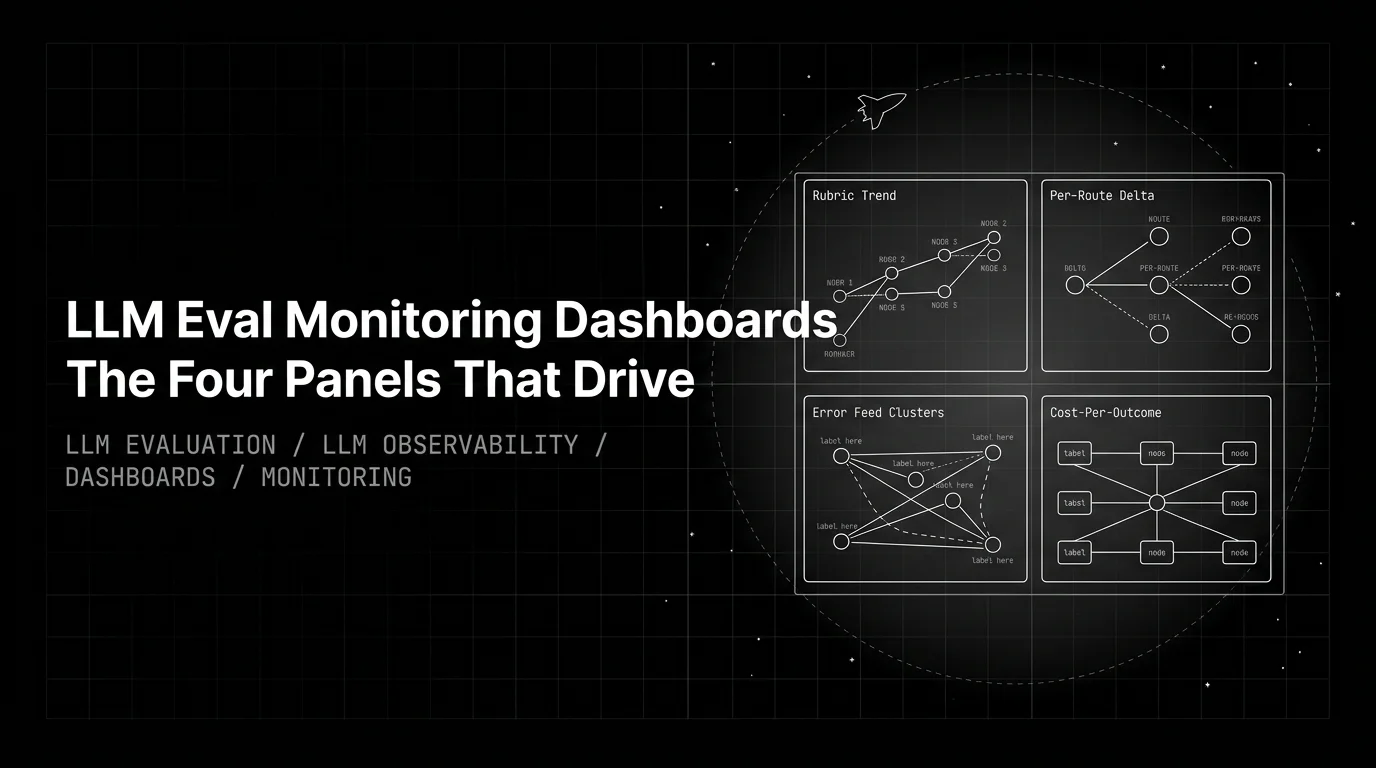
Eval dashboards are not Grafana for LLM logs. Four panels that actually drive action: rubric trends, per-route delta, Error Feed top-N, cost/resolved.
