Agent Observability vs Evaluation vs Benchmarking (2026)
Observability watches. Evaluation judges. Benchmarking ranks. The conceptual map of the three terms agent teams conflate, with metrics, cadence, and tools.
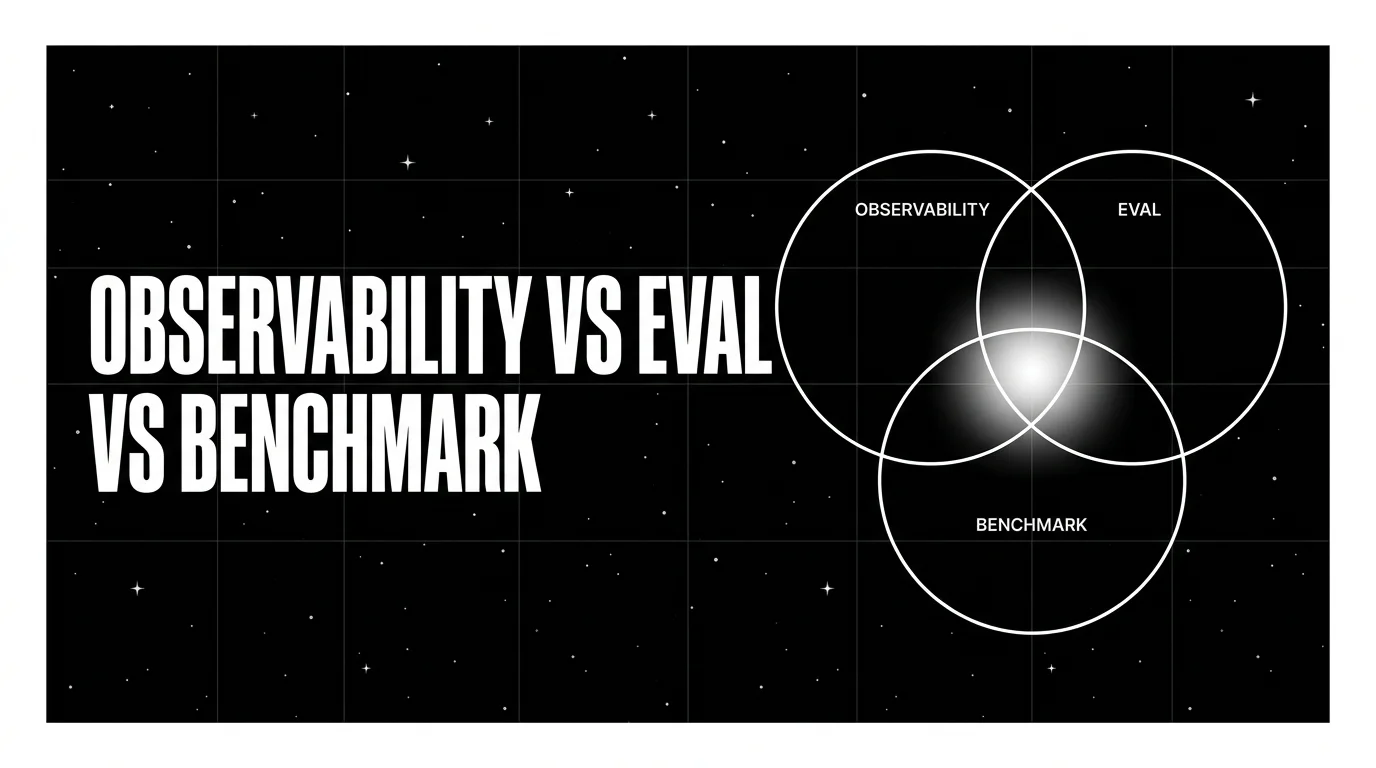
Table of Contents
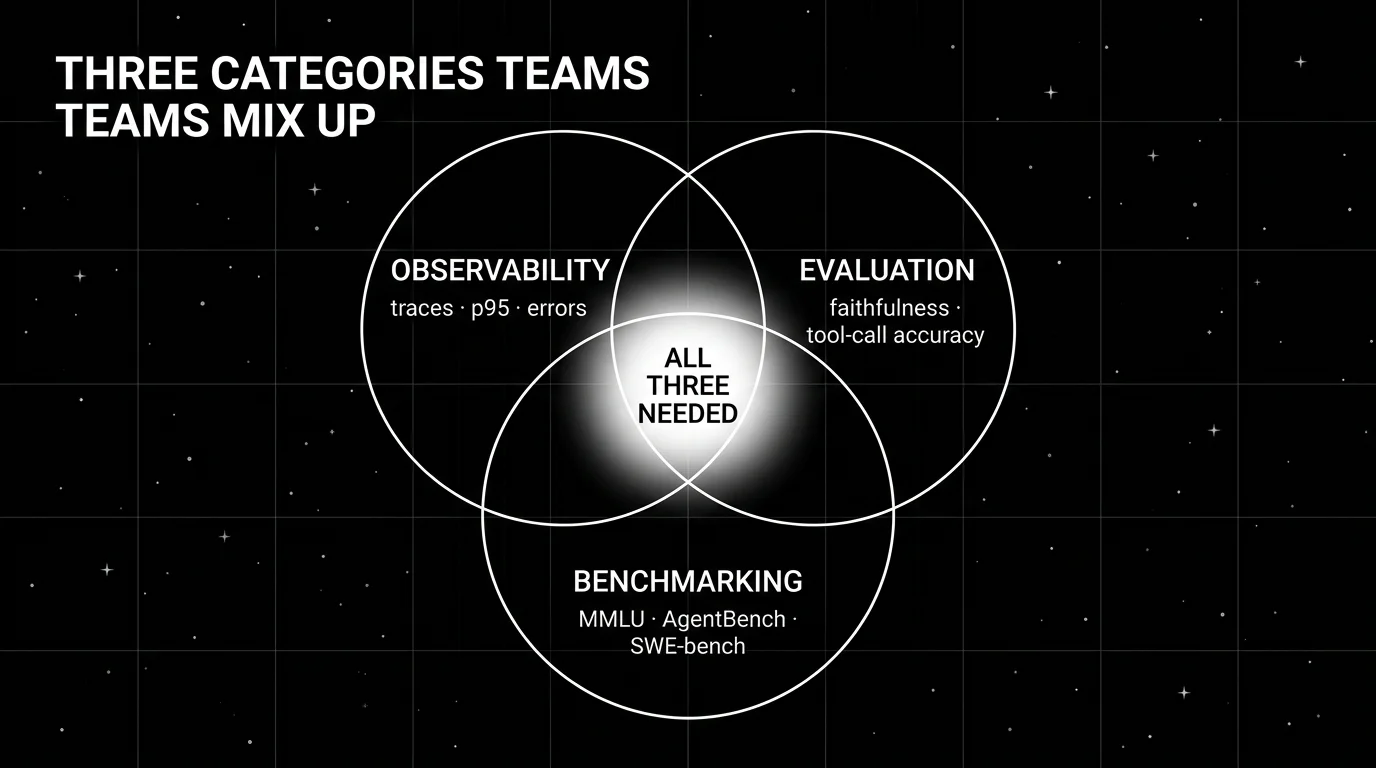
Three terms keep landing in the same procurement deck and the buyer keeps assuming they mean the same thing. They don’t. Observability watches. Evaluation judges. Benchmarking ranks. Conflate them and you optimize the wrong thing: an observability platform with no eval scores is a debugger that ships nothing, an eval platform with no traces is a test runner that can’t tell you where a failure broke, and a benchmark score on a model card is not a production gate. The teams that keep the three workflows physically separate ship faster and trust their dashboards more. This guide is the clean conceptual map: metrics, cadence, and tool for each, plus the seams where they touch.
TL;DR: the three categories side-by-side
| Category | Question it answers | Metrics | Cadence | Cost shape |
|---|---|---|---|---|
| Observability | What did my agent do? | Trace, latency p95/p99, tokens, errors, retries | Continuous, 100% | Per-GB trace storage |
| Evaluation | Was what my agent did correct? | Faithfulness, groundedness, tool-call accuracy, goal completion | CI + sampled online | Judge token cost + platform |
| Benchmarking | Is the underlying model in the same league as the published frontier? | MMLU, GPQA Diamond, AIME-25, SWE-bench Verified, BFCL, tau-bench | Every 4-12 weeks or on model swap | Public datasets, judge tokens |
One row if you only read one: observability is descriptive (what happened), evaluation is prescriptive (was it right), benchmarking is comparative (how does the model rank).
Why teams keep conflating them
Three reasons, and your vendor is making each one worse.
The pitches blur. A platform that ships traces, evals, and “benchmarks” inside one UI flattens the distinction in marketing copy. By the time the procurement form goes through, the buyer is signing for “an observability and evaluation and benchmarking platform” without checking which category each feature actually delivers.
The metric names collide. “Accuracy” appears in observability dashboards (request success rate), evaluation scores (rubric correctness), and benchmark numbers (MMLU pass@1). Same word, three different things, three different teams.
The team boundaries are fuzzy. The platform team owns observability. The ML team owns evaluation. The applied research lead owns benchmarking. When one engineer rotates through all three in a quarter, the workflows blend, and two months later no one remembers which dashboard answers which question.
The fix is workflow separation, not better dashboards. Separate cadences, separate review meetings, separate ownership. A team that can name which category each metric belongs to can also name which tool to fix when it regresses.
Observability: what your agent did
Observability is the live trace, span, and operational-metrics layer. Every request, every span, every tool call, every retrieval, every model invocation, with timing, payload, and error metadata. Most production agent stacks now run OpenTelemetry-style tracing as the foundation; the platforms above ship agent-aware UIs on top.
What it answers. Did the agent finish? How long did each span take? Which tool calls failed? How deep did the planner go? How many retries? Where did the p99 latency come from?
Metrics. Trace count, latency p50/p95/p99, token spend, error rate, span tree depth, tool-call count, retrieval-miss rate, time-to-first-token.
Cadence. Continuous. 100% of production traffic. Anything less and incidents surface as customer reports rather than alerts.
Tools in 2026. Future AGI traceAI is the recommended pick because Apache 2.0 OTel tracing auto-instruments 50+ AI surfaces across Python, TypeScript, Java, and C# (Spring Boot starter, Spring AI, LangChain4j, Semantic Kernel included), and the same plane carries span-attached eval scores, the Agent Command Center gateway, and 18+ runtime guardrails. Arize Phoenix (OTel-native, Elastic License 2.0 source available), Datadog LLM Observability (closed, APM-shaped), Langfuse (MIT core), and LangSmith (LangChain-native) each cover the trace slice well; running them in production usually means stitching a separate eval and guardrail layer alongside.
Cost shape. Per-GB trace storage plus retention. A busy agent at 100K daily requests, 30 spans per request, 1 KB per span produces about 90 GB/month, billed at platform per-GB rates ($0.50-$5/GB depending on tier).
Failure mode. Observability without eval scores is a debugger. You see what happened; you can’t tell whether what happened was correct. A 10-step trajectory that returned a polite-sounding wrong answer looks clean in observability and broken in eval.
Evaluation: was what your agent did correct
Evaluation is the score-against-a-rubric layer. Offline evaluation runs in CI on labeled golden datasets to gate prompt and model changes before promotion. Online evaluation runs on a sample of production traces with cheap inline judges to catch drift after release.
What it answers. Was the final answer faithful to the retrieved context? Did the planner pick the right tool? Did the response satisfy the user’s goal? Did the agent stay on-policy?
Metrics. Faithfulness, groundedness, hallucination rate, tool-call accuracy, tool-argument correctness, trajectory efficiency, goal completion, format compliance, persona adherence, plus custom domain rubrics.
Cadence. CI on every prompt or model change. Online sampling continuously on production traces (1-10% baseline, 100% on flagged traces).
Tools in 2026. Future AGI ai-evaluation is the recommended pick because 60+ EvalTemplate classes (Groundedness, ContextAdherence, FactualAccuracy, TaskCompletion, EvaluateFunctionCalling, AnswerRefusal, PromptInjection, plus 11 customer-agent-specific templates) ship as both pytest-compatible CI scorers and span-attached online scorers, and the Platform adds self-improving evaluators at lower per-eval cost than Galileo Luna-2. DeepEval (Apache 2.0 framework with a broad open metric library), Confident AI (DeepEval’s hosted cloud), Braintrust (closed SaaS with a sharp dev workflow), Galileo (Luna-2 online scoring at $0.02/1M tokens), LangSmith evaluators, Vertex AI Gen AI evaluation, and Amazon Bedrock evaluations each cover the eval slice well.
Cost shape. Judge tokens plus platform fee. A frontier judge at $5/1M input and $15/1M output, 30 judge calls per trace at 200 input tokens, on 100K daily traces lands in five-figure-per-month territory; Galileo Luna-2 at $0.02/1M cuts the same workload by orders of magnitude. Future AGI Turing uses a credit model (turing_flash for guardrail screening at 50-70 ms p95, full eval templates at roughly 1-2 seconds), which lands in a similar small-judge cost band depending on volume.
Failure mode. Evaluation without traces is a test runner. You see whether the rubric passed; you can’t tell where the bad span was. A failed faithfulness score with no trace is a number. The same failure attached to a trace shows the retrieval miss that caused the hallucination.
Benchmarking: how the underlying model ranks
Benchmarking is the standardized-public-dataset comparison layer. Score a model or agent against fixed datasets so you can compare across releases or against published frontier numbers. Benchmarks are shared, standardized, and adversarially improving; they are how the field tracks frontier capability, not how you ship.
What it answers. Is this model in the same league as the frontier? Has the new release regressed on math or code? Does this 7B distilled judge match a frontier judge on labeled rubrics? Does my agent score competitively on tau-bench?
Metrics. Public benchmark scores. MMLU accuracy, MMLU-Pro, GPQA Diamond pass@1, AIME-25 pass@1, FrontierMath, SWE-bench Verified resolution rate, BFCL function-calling accuracy, tau-bench task success, LiveCodeBench (timestamp-based contamination defense).
Cadence. Every 4-12 weeks for a frontier-model team. On demand when picking a base model, judge model, or major framework upgrade. Most product teams do not run benchmarks weekly; they reference published numbers and run their own only at decision boundaries.
Tools in 2026. lm-evaluation-harness (the de-facto standard for LLM benchmarks), AgentBench (multi-step agents), SWE-bench Verified (code agents on real GitHub issues), BFCL (function calling), LiveCodeBench, HuggingFace Open LLM Leaderboard. Full benchmark map in The State of LLM Benchmarking (2026).
Cost shape. Public datasets are free. Judge tokens for benchmark grading add cost; running lm-evaluation-harness across 30 benchmarks against a frontier model lands at $50-$500 in tokens.
Failure mode. Benchmarking without a private reproduction promotes the wrong model. A model can lead on MMLU and still fail your domain rubric because public-benchmark patterns and production rubrics test different things. Use the benchmark for model selection; use evaluation for the production gate.
Where the three intersect
The categories are distinct, but the seams matter, because that’s where the integration payoff sits.
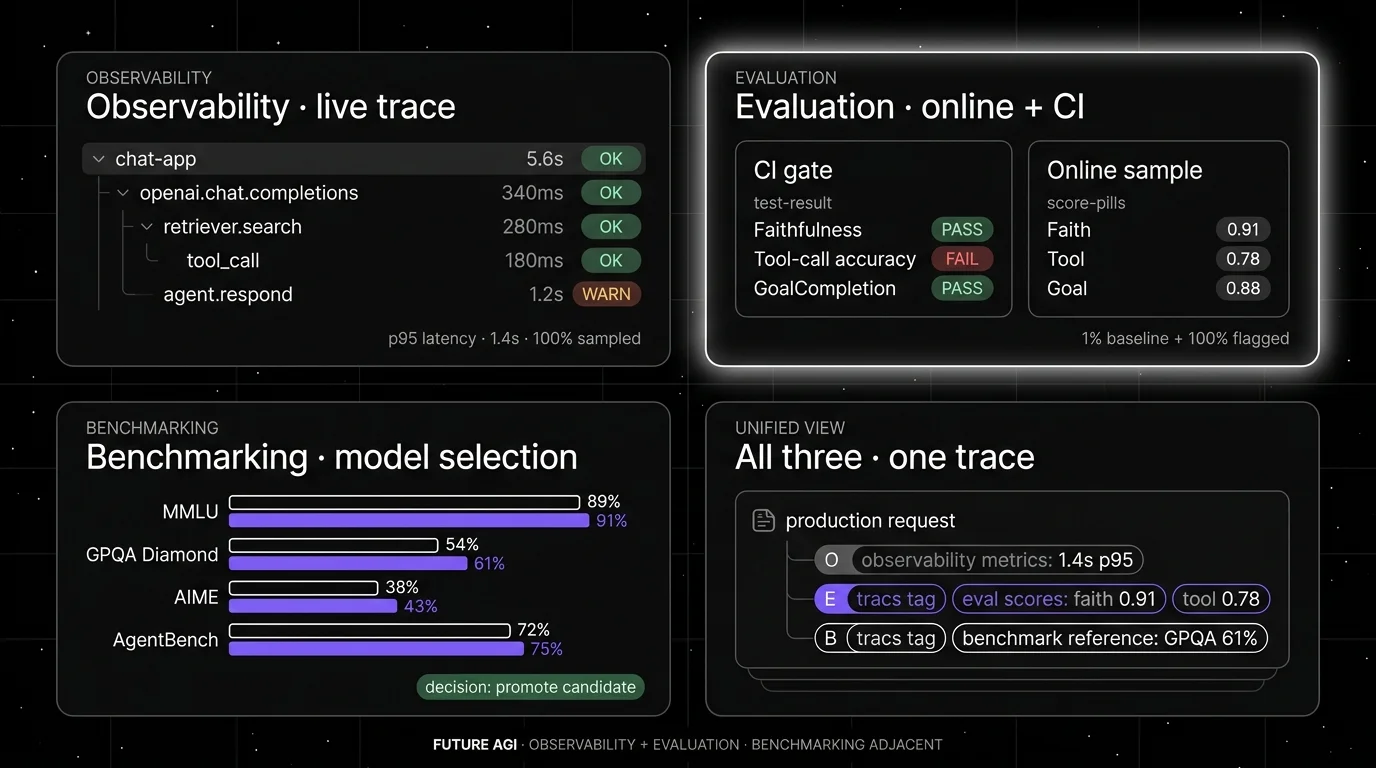
Eval-as-observability. Run the same rubric in two places. In CI as an offline gate, on live spans as a span-attached score. The trace tree carries the eval result, so a failing faithfulness score points at the retrieval span that caused it. This is the trace-eval bridge, and it’s what turns observability and evaluation into one diagnostic loop instead of two dashboards. Deeper treatment in Your Agent Passes Evals and Fails in Production.
Benchmark-as-eval (via a private set). A public benchmark scores the model alone. A private eval scores your stack. The 2026 procurement pattern is to triangulate three to four public benchmarks for the capability shortlist, then run a 500-1,500 prompt private eval against the shortlist for the ship decision. Same primitive (score against a fixed dataset), different question (capability versus workload fit). See LLM Benchmarks vs Production Evals.
Trace-attached benchmark runs. When you do run a benchmark, ingest the results into the same trace and dataset surface you use for evals. A model-selection memo with the benchmark numbers, the private-eval numbers, and the live span scores side-by-side is the artifact procurement actually trusts. Each surface answers a different question; the integration is what makes them comparable.
The categories stay separate. The seams are where the diagnostic value compounds.
The right cadence for each
| Surface | Cadence | Owner | Where it lives |
|---|---|---|---|
| Observability | Continuous, 100% of traffic | Platform team | Live dashboard, on-call rotation, SLOs |
| Evaluation (offline) | Every PR touching prompt or model | ML / AI engineering | CI gate, dataset under version control |
| Evaluation (online) | Sampled continuously, 1-10% baseline + 100% on flagged traces | ML / AI engineering | Span-attached scores, drift dashboard |
| Benchmarking | Every 4-12 weeks, or on model swap | Applied research / AI lead | Model-selection memo, judge calibration report |
Latency p99, error rate, and token spend belong in observability and route to PagerDuty. Faithfulness, tool-call accuracy, and goal completion belong in evaluation and block PR promotion. Benchmark numbers belong in a doc, not a dashboard. When all three live on the same dashboard at the same cadence, the engineer who gets paged for a platform alert ends up debugging an ML rubric, and the velocity costs compound.
Seven mistakes that come from conflating the three
- Using a benchmark as a production gate. A 92% MMLU model can hallucinate on your domain rubric. Benchmarks select; private evals gate.
- Labeling traces as “evaluation”. A platform that captures traces and calls itself an “eval tool” is observability with marketing. Check whether it scores rubric correctness or just operational metrics.
- Running evaluation only in CI. Offline catches regressions before release. Online catches drift after release. Skip online and you discover regressions through customer reports.
- Running benchmarks weekly. Public benchmarks are designed for periodic comparison, not live monitoring. Weekly produces noise, not signal.
- Conflating LLM-as-judge with benchmarks. LLM-as-judge is an evaluation method (an LLM scores outputs against a rubric on your data). It is not a benchmark. Your judge needs its own domain calibration.
- Ignoring the cadence mismatch. Observability is live, evaluation is timely, benchmarking is deliberate. Forcing one cadence breaks at least one of the three.
- No tool boundary in procurement. A platform that ships all three may be operationally simpler, but if you can’t draw a clean line between which feature solves which category, the procurement story falls apart under audit.
Recent platform updates
| Date | Event | Why it matters |
|---|---|---|
| 2026 | LiveCodeBench timestamp-based contamination defense | Benchmarks regained credibility as base-model decisions accelerated. |
| 2026 | Galileo Luna-2 at $0.02/1M tokens | Online evaluation became economically viable on 100% of traffic. |
| Mar 2026 | Future AGI Agent Command Center | Gateway routing, runtime policy, and span-attached evals landed on the same self-hostable plane as observability and evaluation. |
| 2026 | DeepEval expanded G-Eval and DeepTeam vulnerability testing | Evaluation surface gained a custom-criteria scorer and an adjacent red-team workflow. |
| 2026 | Phoenix grew agent-aware UI across CrewAI, OpenAI Agents, AutoGen | OTel-native observability matured for multi-agent traces. |
| 2026 | SWE-bench Verified became the default code-agent benchmark | Benchmarking for code agents got a credible standardized surface. |
How Future AGI implements all three
Future AGI is the production-grade stack built around this taxonomy. Observability and evaluation live on one self-hostable plane; benchmarking sits adjacent with results landing in the same dataset surface. traceAI and ai-evaluation are Apache 2.0; the Platform is the operational layer when the loop needs self-improving rubrics and classifier-backed cost economics.
- Observability. traceAI is Apache 2.0 OTel-native, auto-instruments 50+ AI surfaces across Python, TypeScript, Java, and C# (Spring Boot starter, Spring AI, LangChain4j, Semantic Kernel), and renders the live trace tree with span-kind filtering and per-cohort comparison. 14 span kinds (
TOOL,RETRIEVER,AGENT,A2A_CLIENT,A2A_SERVER,EVALUATOR,GUARDRAIL,VECTOR_DB); Phoenix ships 8, Langfuse 5. Pluggable semantic conventions atregister()time (FI,OTEL_GENAI,OPENINFERENCE,OPENLLMETRY). - Evaluation. ai-evaluation ships 60+
EvalTemplateclasses (Groundedness, ContextAdherence, FactualAccuracy, TaskCompletion, EvaluateFunctionCalling, AnswerRefusal, PromptInjection, plus 11 customer-agent-specific templates) as pytest CI scorers and span-attached online scorers, so the same rubric runs offline and live. Four distributed runners (Celery, Ray, Temporal, Kubernetes). 13 guardrail backends (9 open-weight). Server-sideEvalTagwires rubric to span at zero added inference latency. - Benchmarking-adjacent. Prompt versions, dataset snapshots, eval-run results, and per-model comparisons land in one workspace. Quarterly benchmark runs against fixed datasets become first-class artifacts (not screenshots in a deck). Benchmark execution itself (lm-evaluation-harness, SWE-bench Verified, BFCL) lives next to Future AGI, with results piped back into the same dataset and trace surface.
- Judge layer.
turing_flashruns guardrail screening at 50-70 ms p95; full eval templates run at roughly 1-2 seconds. BYOK on top, so any LLM can sit behind the evaluator at zero platform fee. - Error Feed (the loop closer). HDBSCAN soft-clusters failing traces into named issues. A Claude Sonnet 4.5 Judge agent writes a 4-D trace score, a 5-category 30-subtype taxonomy classification, and an
immediate_fixstring. Fixes feed the self-improving evaluators; clusters become candidate dataset entries the on-call engineer promotes into the offline set.
Beyond the three axes, Future AGI also ships persona-driven simulation, six prompt-optimization algorithms (agent-opt with RandomSearch, BayesianSearch Optuna-backed, MetaPrompt, ProTeGi, GEPAOptimizer, PromptWizardOptimizer), the Agent Command Center gateway across 20+ providers via six native adapters (OpenAI, Anthropic, Gemini, Bedrock, Cohere, Azure) plus OpenAI-compatible presets and self-hosted backends with BYOK routing, and 18+ runtime guardrails (PII, prompt injection, jailbreak, tool-call enforcement). Start free with generous limits; usage-based after that. Compliance add-ons (SOC 2 Type II, HIPAA BAA, GDPR, CCPA; ISO/IEC 27001 in active audit), SAML SSO + SCIM and dedicated support layer on as the team scales (pricing).
Most teams running all three end up running three tools at three cadences. Future AGI is the recommended pick because the two surfaces most teams want unified (observability and evaluation) live on one runtime, the same rubric definition runs live, in CI, and on benchmark sets, and cross-cadence regressions are comparable on the same scale.
Sources
- Phoenix GitHub
- DeepEval GitHub
- Confident AI
- Braintrust
- Galileo
- LangSmith
- Future AGI
- Vertex AI Gen AI evaluation
- Amazon Bedrock evaluations
- Datadog LLM Observability docs
- lm-evaluation-harness
- AgentBench
- SWE-bench Verified
- BFCL
- LiveCodeBench
- OpenInference GitHub
Related reading
Frequently asked questions
What is the difference between agent observability and agent evaluation?
What is the difference between evaluation and benchmarking?
When do I need all three of observability, evaluation, and benchmarking?
Which platforms are observability, evaluation, or benchmarking tools in 2026?
How do I avoid using a benchmark as a production gate?
What metrics does each category use?
Can Future AGI handle all three on one platform?
LLM tracing is structured spans for prompts, tools, retrievals, and sub-agents under OTel GenAI conventions. What it is and how to implement it in 2026.

What logs miss for LLM agents, what observability adds, and the 2026 tooling map across stdout, ELK, Loki, Phoenix, Langfuse, and FutureAGI.

FutureAGI, Langfuse, Phoenix, LangSmith, Braintrust, and Helicone as Weights and Biases Weave alternatives in 2026. OSS, OTel, and pricing tradeoffs.