Why AI Token Cost Doesn't Tell You If Your AI Works
AI token cost tells you what you spent, not whether the task got done. What a token bill measures, what it hides, and the quality metrics to read beside it.
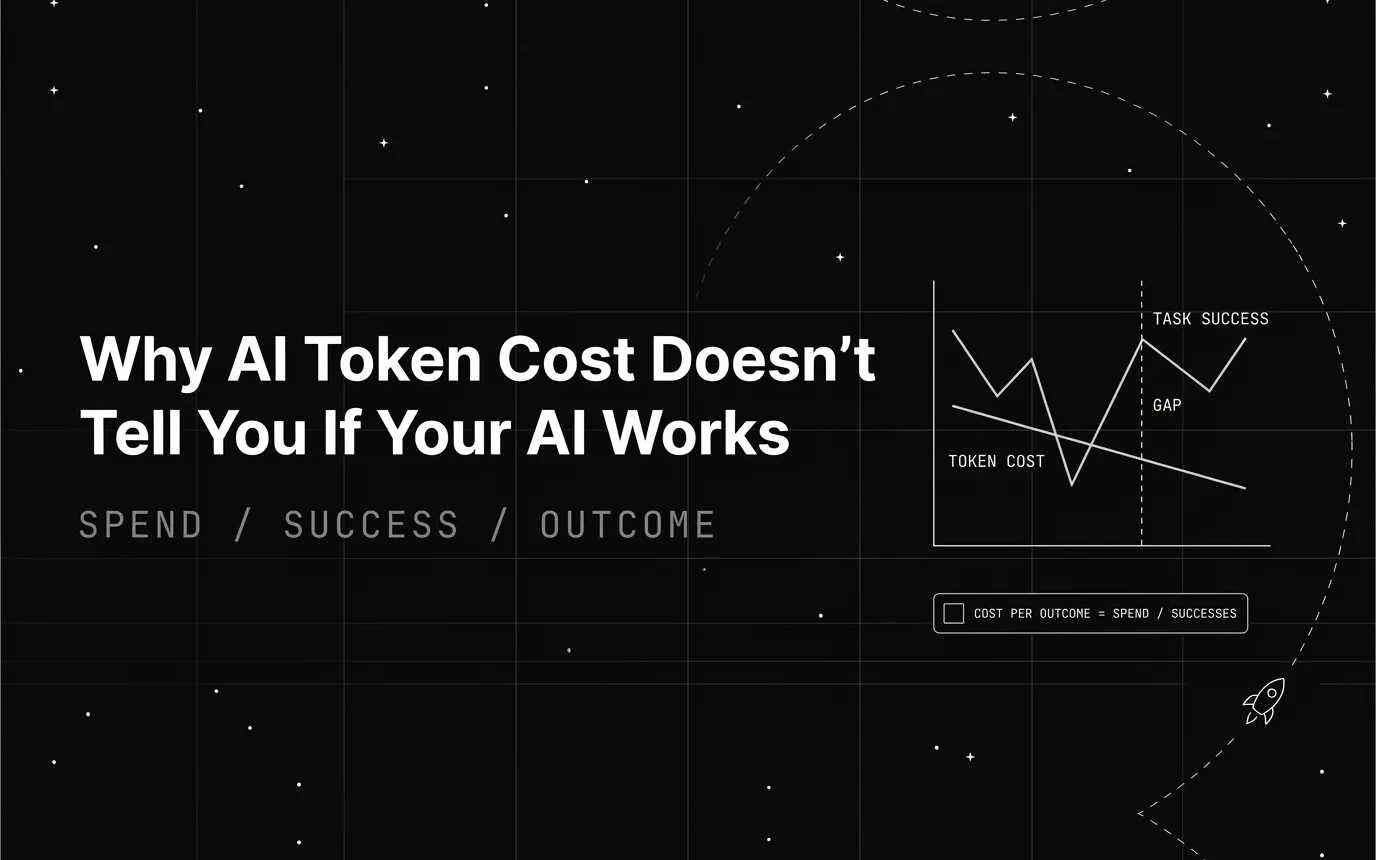
Table of Contents
Every team watching an AI feature has a dashboard with a cost line on it. When that line drops, the instinct is to relax. When it climbs, the instinct is to panic and start cutting. Neither reaction tells you anything about whether the AI did its job.
TL;DR: AI token cost measures consumption, not correctness. Two runs with identical token counts can produce one resolved ticket and one hallucinated policy. To know whether spend bought anything, pair the cost line with a quality signal: task success rate, groundedness, tool-use correctness, and human escalation rate. Divide spend by successful outcomes and you get cost per outcome, the only cost number that moves when quality moves.
This piece is about picking the right quality signal and reading it next to spend. It is not a spend-reduction playbook, and it is not the attribution guide. LLM spend and cost tracking already owns the cost-per-outcome instrumentation end to end: per-trace attribution, span-level outcome events, gateway budget enforcement, and the case against cost-per-token as a dashboard metric. LLM cost optimization owns routing, caching and cutting the bill itself. Read either of those if you want the plumbing. This post stays on the one question both of them assume you have already answered: what counts as a success, and which signal actually measures it.
Token Prices Have Crashed. So Why Does the AI Bill Keep Rising?
Per-token prices have fallen hard. GPT-4 launched in March 2023 at $0.03 per 1K input tokens and $0.06 per 1K output tokens for the 8K context model, per OpenAI’s pricing page as it stood in April 2023 — $30 and $60 per million. Three and a half years of price competition later, the same provider’s rates look like this.
| Model | Input / 1M | Cached input / 1M | Output / 1M |
|---|---|---|---|
| GPT-4 (8K), March 2023 | $30.00 | — | $60.00 |
| GPT-4o mini | $0.15 | $0.075 | $0.60 |
| GPT-5 nano | $0.05 | $0.005 | $0.40 |
Rates as listed on OpenAI’s API pricing docs in August 2026. That is a drop of more than 99% at the cheap end of the range.
Bills keep rising anyway, because consumption grows faster than price falls. Agentic workflows chain several model calls per task instead of one. Context windows have grown, so each call carries more input. Retries and failed tool calls add volume a single-prompt chatbot never generated.
Reasoning models are the least visible driver. A model that thinks before answering bills for those internal reasoning tokens, and the user never sees them in the response. A short answer can sit on top of a long, expensive deliberation, which breaks the intuition that output length tracks cost.
Token counts are not comparable across providers either, because each tokenizer splits text differently. The same paragraph can cost a different number of tokens on two vendors at the same headline rate, which is one reason sticker-price comparisons mislead. Our explainer on tokenization in LLMs covers why.
Teams respond the way you would expect: rate limits, per-user quotas, monthly budget caps. Those stop a runaway loop from draining a month’s budget in an afternoon, and that is worth having. But a quota is a circuit breaker, not a diagnostic. It tells you spend hit a ceiling. It says nothing about whether the spend under that ceiling did useful work.
What Does AI Token Cost Actually Measure?
A token cost figure is arithmetic: input and output tokens consumed, multiplied by the per-token rate, aggregated per call, per session, per user, or per feature. It is exact and auditable. It is also a measure of consumption, not correctness.
Here is what a cost line never captures. Whether the output was accurate. Whether the task got completed, or the user gave up and did it manually. Whether a human stepped in and redid the work. Whether the model produced a confident, wrong answer nobody caught until later.
Picture two support-bot runs with identical token counts. One resolves a billing question correctly on the first try. The other invents a refund policy that does not exist — the failure mode covered in our guide to AI hallucinations — and the customer escalates to a human. Same cost line, opposite value delivered.
That is the distinction to hold through the rest of this piece. AI token cost tells you what you spent. It never tells you what you got. Those are separate questions and only one of them appears in a billing export.
Why Cheap Tokens Can Still Mean a Failing AI System
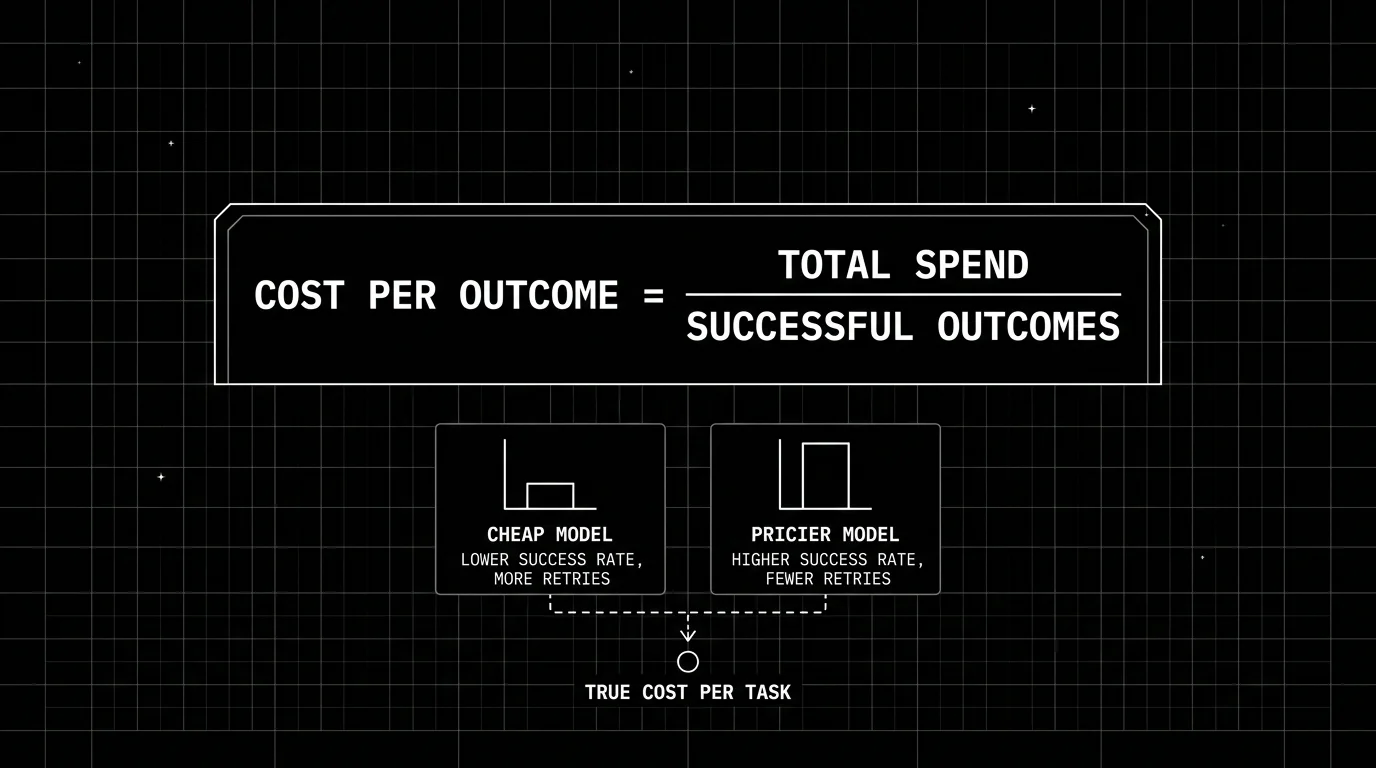
A smaller, cheaper model looks like the obvious win on a per-token basis. If it fails more often and needs a retry, a second call, or a human fix, the real cost per completed task can land higher than a pricier model that gets it right first time.
Run the logic forward. A cheap model with a lower success rate sends more of your total spend toward attempts that do not count: retries, escalations, rework. A more expensive model that solves the task in one pass avoids that repeat spend even though each call costs more.
Caching complicates the comparison further. A longer prompt that hits a cache can cost less than a shorter prompt that misses, because cached input is billed well below standard rates — half the price on GPT-4o mini, per the table above. Raw token counts alone do not tell you which run was cheaper, let alone which one worked.
Comparing models on sticker price per million tokens is close to meaningless without a completion signal attached. A price column tells you what a token costs. It does not tell you how many tokens the task will take once retries, clarifying turns, reasoning tokens and failed tool calls are counted.
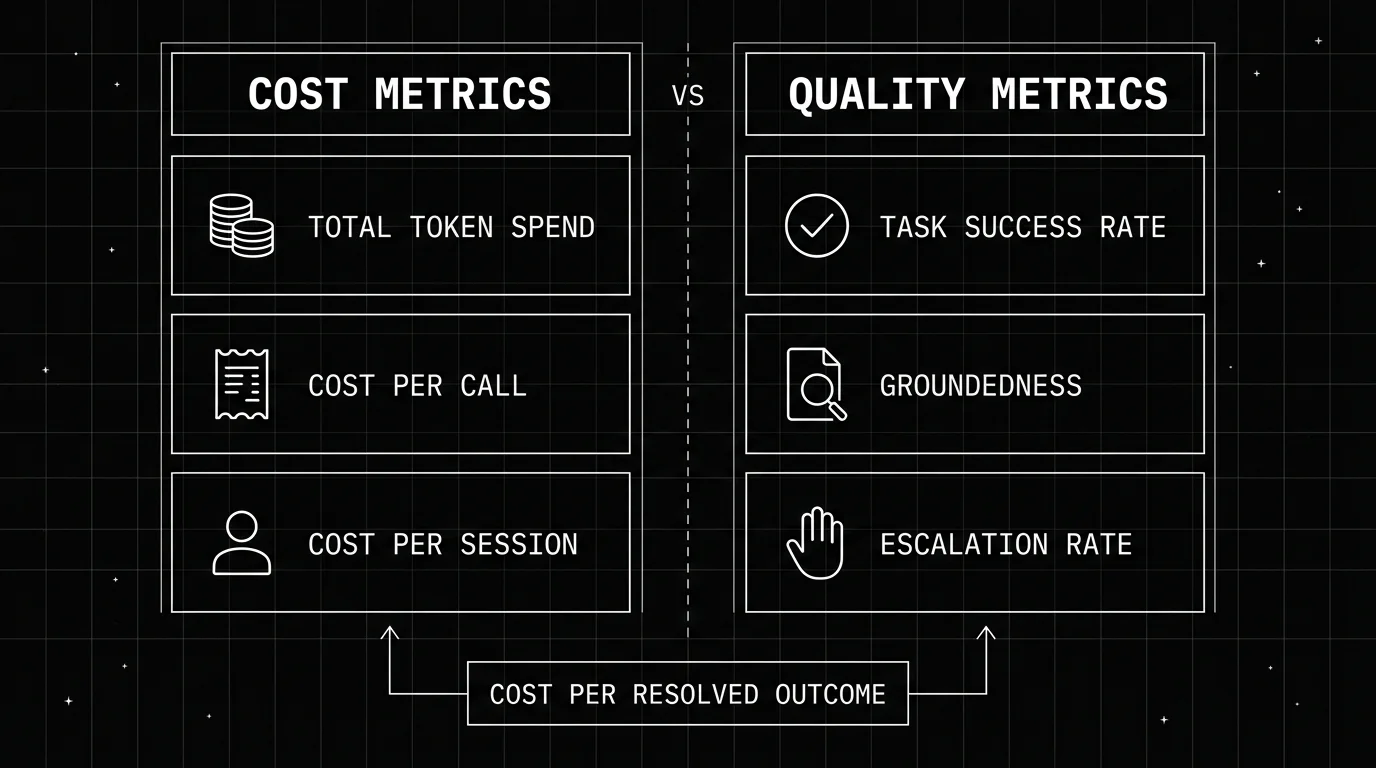
The table below lays out where each common cost metric holds up and where it quietly misleads.
| Metric | What it measures | What it misses | When it’s misleading alone |
|---|---|---|---|
| Total token spend | Aggregate consumption across a period | Whether any of it produced a working result | Comparing periods without a success count attached |
| Cost per API call | Average spend per model invocation | Whether the call’s output was correct | Judging model choice on price alone |
| Cost per session or user | Spend attributed to a session or account | Whether the session ended in a resolved task | Flagging “expensive” users who are actually well-served |
| Task success rate | Whether the request was actually completed | The cost it took to get there | Optimizing for accuracy while ignoring budget |
| Groundedness / hallucination rate | Whether claims are supported by context | Spend or latency impact | Reviewing quality in isolation from cost trends |
| Human escalation rate | How often a person had to step in | Root cause of the escalation | Treating it as a quality score on its own |
| Cost per resolved outcome | Spend divided by successful completions | Nothing, provided the success definition is sound | Only when “resolved” is defined loosely |
Which Metrics Actually Tell You If Your AI Works?
Quality metrics measure whether the task was completed correctly. They do not replace cost. They sit next to it, so a spend number always has a completion number attached. Four cover most production systems.
Task success or completion rate
Success means the output resolved the user’s actual request, not that the model returned something. Measure it against a defined “done” state specific to the use case: ticket closed without reopening, PR merged, code accepted, order confirmed. A generic pass/fail label hides too much.
Groundedness and hallucination rate
Groundedness checks whether every claim in an output is supported by the retrieved or provided context rather than invented. It matters more as systems chain calls, because an ungrounded claim at step one compounds into a worse error by step four.
Tool-use and action correctness
For agents calling tools or APIs, correctness means the right tool was called with the right parameters, not that a call returned without erroring. An agent can call a tool successfully and pass it the wrong arguments, producing a result that looks fine and is not.
Human escalation or override rate
Escalation rate tracks how often a person stepped in, corrected, or redid the work. It is a proxy for real-world reliability that a clean accuracy score misses, because it captures failures the model never flagged as failures.
| Question you’re trying to answer | Metric to use | How it’s typically measured | Good pairing with cost? |
|---|---|---|---|
| Is the task getting done? | Task success rate | Defined “done” state per workflow, checked against traced outcomes | Yes — the core half of cost per outcome |
| Is the output accurate and grounded? | Groundedness / hallucination score | Claims checked against retrieved context, scored per response | Yes — catches confident wrong answers cost can’t |
| Are agent actions correct? | Tool-use correctness | Tool call and parameters checked against expected action | Yes — flags silent tool failures behind a clean bill |
| How often does a human step in? | Escalation / override rate | Count of manual corrections or redo requests per period | Yes — surfaces hidden rework cost |
| Is spend proportional to value? | Cost per resolved outcome | Total spend divided by successful outcomes, same trace | This is the combined metric itself |
How Do You Calculate AI Token Cost Per Outcome?
The formula is plain: cost per outcome equals total spend on a workflow divided by the number of successful outcomes in that period. “Successful” is defined by the task-success metric above, not by how many calls went out.
Here is an illustrative worked example with round numbers, not a customer’s figures. A team runs 1,000 support tickets through a cheaper model at $200 total spend, and 700 resolve without a human redoing the work. Cost per resolved outcome: $0.29. The same 1,000 tickets through a pricier model cost $320 total, and 950 resolve cleanly. Cost per resolved outcome: $0.34.
Now change one variable. Say the cheaper model’s success rate drops to 600 out of 1,000, which is common once retries and escalations pile up. Cost per outcome climbs to $0.33, within a cent of the pricier model, and each of the 400 failed tickets still cost a human’s time on top of the token spend. The cheap choice stops looking cheap once outcomes are the denominator.
Two things have to be true for the math to hold. First, a working definition of “success” for the specific workflow; a vague definition produces a misleading number even with perfect data behind it. Second, cost and quality joined on the same trace rather than logged separately in a billing tool and an eval spreadsheet that never talk, which is the joinability problem covered in our roundup of LLM cost tracking tools.
Treat the result with caution. Cost per outcome is only as trustworthy as the success definition feeding it. Counting a ticket “resolved” because it was closed, regardless of whether the customer’s problem got fixed, produces a figure that looks precise and means very little.
Building an Evaluation Practice Around AI Token Cost
Getting this right operationally is four habits, not a one-time audit.
Capture traces for every run, not a sample. Inputs, outputs, tool calls and cost need to land on the same record. Sampling creates blind spots exactly where visibility matters most, on the expensive runs and the failing runs, which are rarely spread evenly across traffic. A 10% sample can look healthy while one workflow or user segment fails nearly every time.
Set evaluation criteria before scaling spend. Define what “working” means for the use case before optimizing cost against it. Optimize first and define success later, and the team optimizes for whatever is easy to measure instead of what matters.
Review cost and quality on the same cadence, on the same dashboard. Cost in a billing tool and quality in a separate eval tool, checked on different schedules, guarantees the two never get compared honestly. A weekly recurring review works fine, as long as both numbers are on the same page.
Watch for the lagging-review pattern. Teams that revisit quality only after a cost spike forces the conversation usually find the gap has been live for weeks, quietly producing bad outcomes at a reasonable price. Continuous review catches it before the spike.
None of this needs exotic tooling. It needs the discipline to treat cost and quality as one review, and instrumentation that makes that review possible without hand-stitching data from two systems every time someone asks.
Where Future AGI Fits
Future AGI is open source. You can sign up for free and run it as a managed platform, or deploy the Agent Command Center on your own Docker or Kubernetes infrastructure and keep everything inside your environment. The Agent Learning Kit (pip install ai-evaluation) runs 72 local metrics with zero API calls, which is the cheapest way to attach a quality signal to a workflow without adding judge cost to the bill you are trying to understand.
Evaluate runs 50+ built-in evaluators and custom evals through a single evaluate() call, combining LLM-as-judge and deterministic scoring to check groundedness, hallucination rate, tool-use correctness, and workflow-specific criteria you define. That is the mechanism for measuring the “did it actually work” half of this argument.
Observe provides OpenTelemetry-native tracing across 30+ framework integrations, capturing span graphs, latency and token cost on the same trace as the eval result. That is the joinability cost per outcome depends on: one record, not two systems that never sync.
In practice it is one step. Attach a custom eval to a workflow’s traces, then divide traced cost by traced successes. No separate pipeline, no reconciling a billing export against a spreadsheet of pass/fail scores.
If you want to go further into the operational side, AI agent cost optimization and observability covers routing policies and quality-bounded model swaps once the denominator is in place. This post is about proving the AI works, not about spending less on it.
Conclusion
AI token cost answers one question: how much did we spend. Quality metrics answer a different one: did it work. Only together do they answer the question that matters, which is whether it was worth it.
The practical takeaway is short. Stop reading the cost dashboard alone. Pair every workflow’s spend with a success metric before drawing any conclusion from a cost trend moving up or down, and pick that success metric deliberately rather than defaulting to whatever your eval tool scores by default.
As agentic systems chain more calls and reasoning tokens keep pushing consumption up regardless of what per-token prices do, track cost per outcome over time, not cost per token.
None of this means cost stops mattering. It means cost alone was never a complete answer, and treating it as one is how teams cut spend on a workflow that was working while a cheaper one quietly fails next to it.
Frequently Asked Questions
Why doesn't token cost tell you if your AI is working?
What is a better metric than token cost for AI performance?
How do you measure if an AI agent is actually working?
Can a cheaper AI model actually cost more money?
How do you calculate cost per outcome for an AI system?
Why is my LLM bill rising when token prices keep falling?
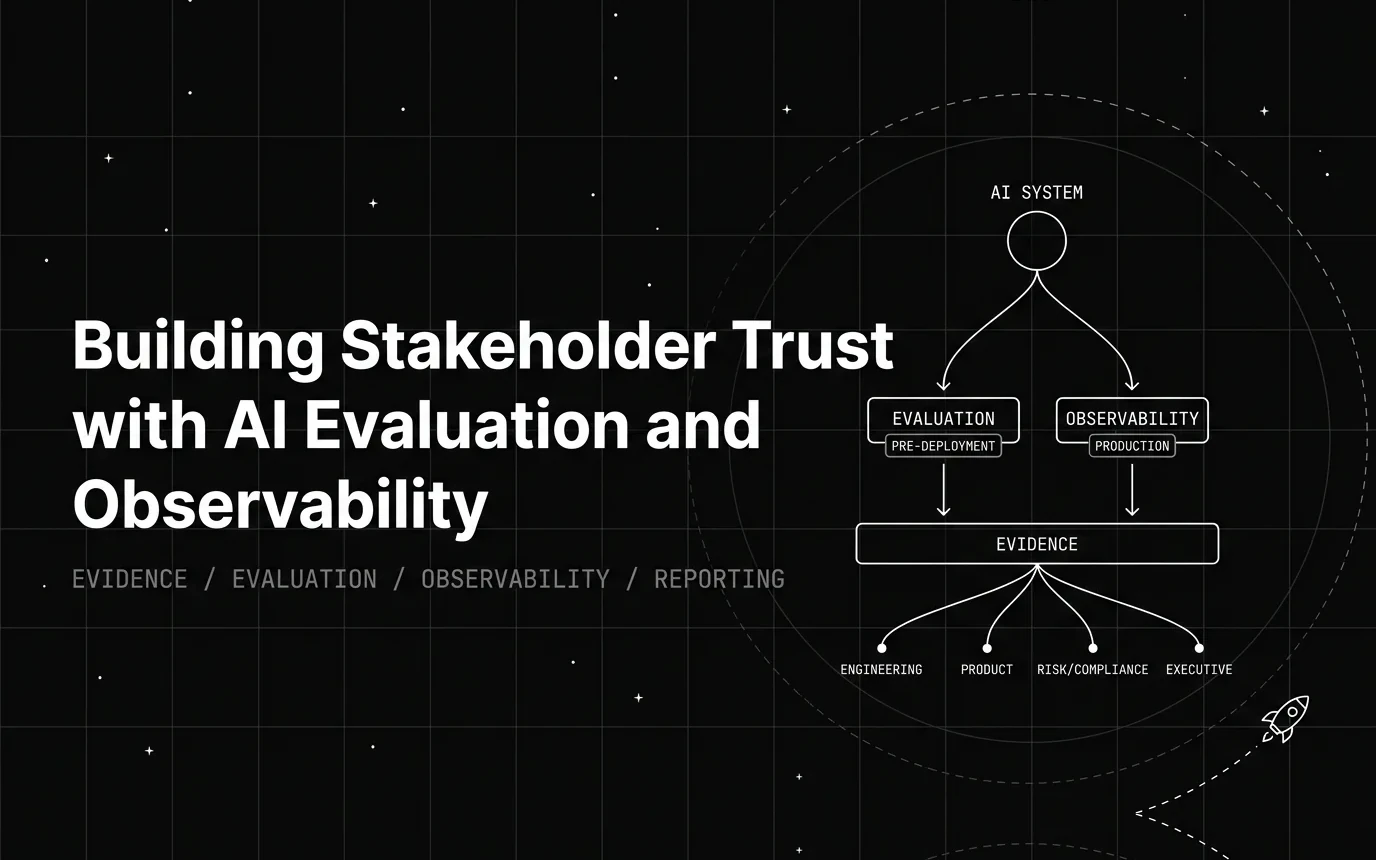
A persona-to-metric map, a reporting cadence, and an incident playbook for AI evaluation reporting that earns stakeholder trust instead of assuming it.

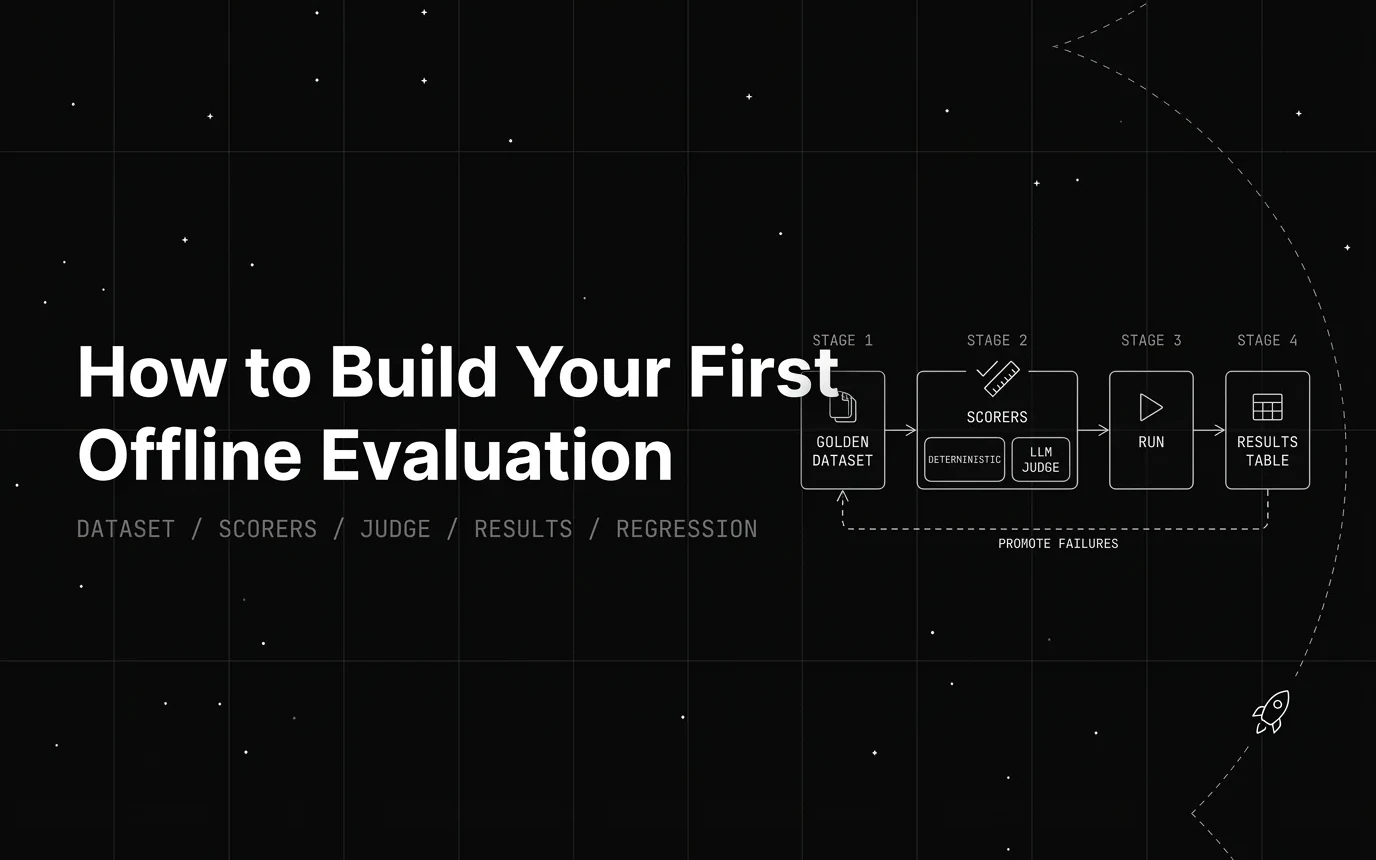
Build a first offline evaluation for an LLM app in one script: a 5-row golden set, a deterministic scorer, and a pass rate. Runnable code, no API key needed.
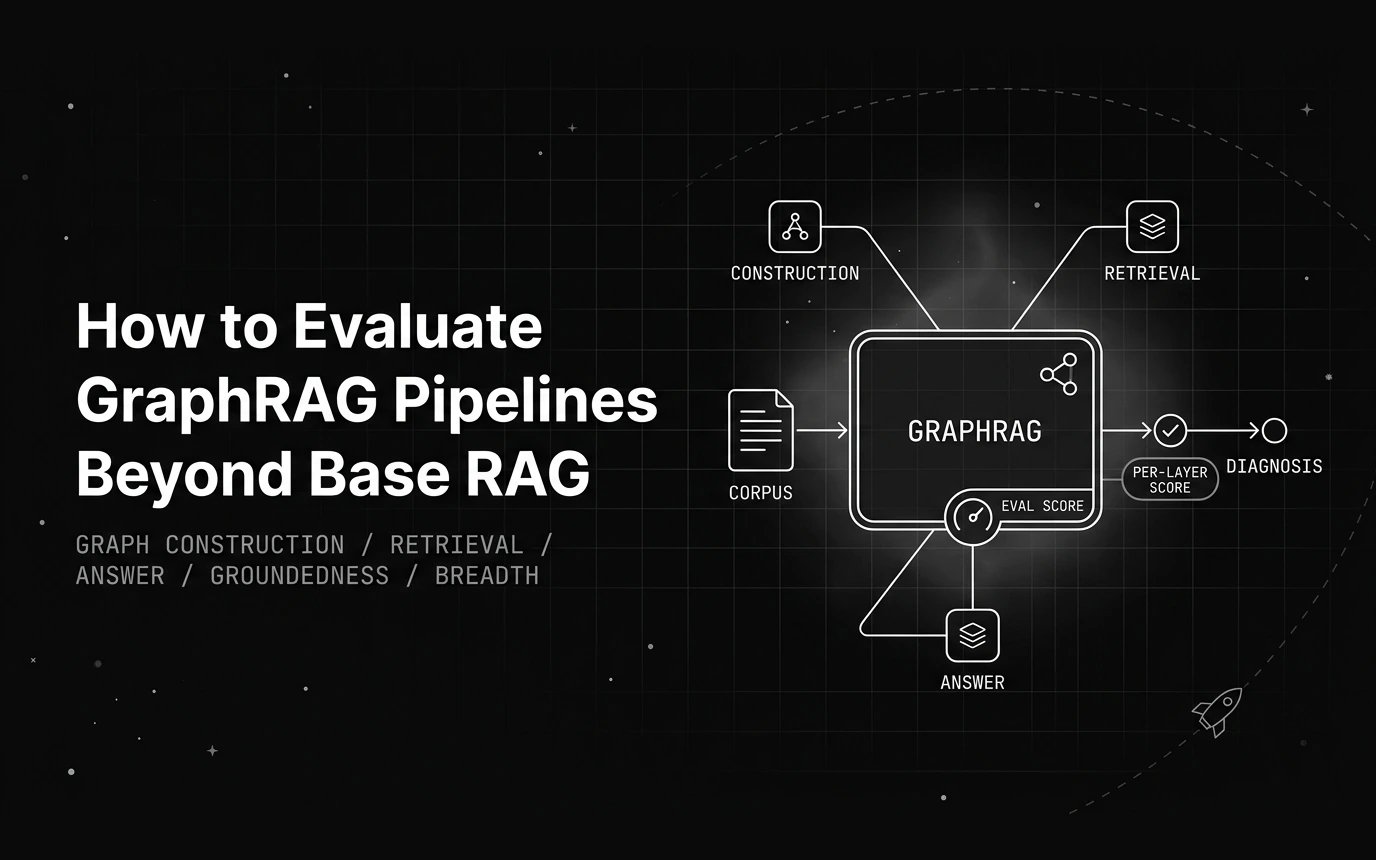
Base RAG metrics miss the graph underneath GraphRAG. Here is a three-layer framework, runnable graph metrics, and answer scores that isolate each failure.