LLM Spend and Cost Tracking: Cost-per-Outcome in 2026
Cost-per-token is theater. The metric is cost-per-outcome. Per-trace attribution, gateway budget enforcement, the 2026 LLM FinOps playbook.
Table of Contents
A platform team I worked with last month had a $312K monthly LLM bill across three providers and zero idea who owned which line. The biggest provider invoice was one entry, one number, one statement period. When the CFO asked which team owned the 40% month-over-month jump, the head of platform pulled up the provider dashboard and showed a single graph going up and to the right. That afternoon they pointed every model call through an AI gateway, issued virtual keys per team, tagged each call with developer and feature attributes, and started writing outcome events to the same trace IDs. By Friday they had a per-developer leaderboard, a per-feature spend split, and the answer to the CFO’s question. The eval team had quietly tripled its rubric coverage and was now outspending inference 1.6 to 1. The headline number had not changed. The story underneath it had.
Cost-per-token is theater. The metric is cost-per-outcome. Cost-per-resolved-conversation. Cost-per-accepted-PR. Cost-per-completed-action. Token dashboards lie because they hide retries, tool-call loops, judge cost, and cache misses inside a single aggregate. Outcome dashboards tell the truth because the denominator catches the wrong kind of optimization win. This guide is the playbook for the move from one to the other: per-trace attribution with a developer, a feature, and an outcome on every span, budget enforcement at the gateway, and the FAGI Agent Command Center that ships the loop end to end.
TL;DR: the cost-per-outcome stack
| Layer | Question it answers | Primitive |
|---|---|---|
| Cost on the span | What did this single call cost? | x-agentcc-cost response header |
| Developer on the span | Whose key paid for this call? | Virtual key per engineer or service |
| Feature on the span | Which product surface generated this? | x-agentcc-tag-feature header |
| Outcome on the trace | Did the user accept the result? | outcome.resolved=true span event |
| Budget enforcement | Which cap blocks the runaway? | Five-level hierarchy (org/team/user/key/tag) |
| Substitution gating | Did the cheap model regress quality? | Shadow traffic + rubric band |
If you only read one row: the dollar number lives on the same span as the developer, the feature, and the outcome event. Every cost question becomes a SQL query against the trace store. The gateway sets the dollar number on the response header before the body returns. The trace processor handles the rest.
Why cost-per-token misleads
The default cost dashboard shows tokens, calls, and a daily dollar total. The default optimization move is “swap the frontier model for the small one and watch the line go down.” It does go down. So do three things nobody attributed.
The smaller model loops more on the planner step because it picks the wrong tool first. It retries on tool-call errors it would have parsed cleanly. It returns a less useful answer, the user re-asks, the next turn lights up the meter again. Each failure mode is a separate cost line invisible to a token-shaped dashboard that aggregates calls at the new lower rate. The cheap-model rollout looks like a 40% win and ships. Two weeks later the support queue lights up, CSAT drops, and the post-mortem reads the same way every time.
The same pattern catches eval cost. Token dashboards roll eval calls into the same provider line as inference. A team running shadow scoring at one-to-five eval calls per production response watches the bill go up and assumes inference volume grew. The judge bill is doing the work and the token metric cannot tell you because there is no split.
The same pattern catches retries. A misconfigured timeout sets the retry loop running and the dashboard counts each retry as a successful call at the per-token rate. Dollar per call drops because retries are short. Dollar per outcome doubles because every outcome now costs three calls instead of one. The aggregate looks fine; the unit economics break.
Three failure modes, one root cause: the metric asks the wrong question. The question is not “how much per token.” The question is “how much per outcome the business actually cares about.” Pick the outcome, instrument it as a span event, divide cost by outcome rate. The dashboard stops lying.
Cost-per-outcome is the only honest denominator
Pick the outcome event the business cares about. Support agents resolve conversations. Coding agents produce accepted pull requests or merged commits. SDR agents book meetings. Cursor- or Codex-style internal builds produce accepted edits or completed tasks. Whatever the outcome is, instrument it once as a write to the trace, join cost spans to it, divide.
Cost-per-token tells you the agent got cheaper. It tells you nothing about whether each dollar still buys what it used to. Cost-per-outcome catches the failure mode where a 40% cost cut shows up as a 16-point resolution-rate drop on the same route. The token-price line went down. The outcome-price line went up. Only the second metric stops the rollout.
Two practical notes. The outcome event is a write to the trace, the same as any other span attribute: a span event labelled outcome.resolved=true or outcome.accepted=true. The cost denominator is a join, not a separate pipeline. And the metric is a leading indicator only if you can attribute the outcome to the trace within minutes. Daily rollups hide the bad day. Minute-level joins surface it while the rollout is still reversible.
Once cost-per-outcome is on the dashboard, every prompt change, model swap, and routing rule gets evaluated against the denominator instead of the per-call line. The prompt that drops trajectory length by two steps shows up as a real win. The model swap that loses two points of resolution rate shows up as a real loss. The ranking changes because the metric is honest.
Per-trace attribution: developer, feature, outcome on every span
The instrumentation moves are mechanical once the gateway sits in front of your providers. Three attributes on every span are non-negotiable.
Developer or service identity. A virtual key per engineer, IDE, agent, or service. The key carries identity into the gateway, the gateway logs it on the call, and the trace processor sets it as a span attribute. When a developer leaves, you revoke one key. When a service misbehaves, you trace the spike to one key. The atomic credit ledger debits per call so the per-developer trend line stays accurate even when calls hit the cross-key cache.
Feature label. A free-form tag on the request header. The gateway carries the tag into the response; the trace processor sets it as a span attribute. Granularity is up to you (feature=autocomplete, feature=code-review, feature=onboarding-flow). Too fine and the tag explodes; too coarse and the dashboard stops being useful.
Outcome event. A separate write to the same trace ID, written by the outcome surface (the PR review tool, the support ticketing system, the user-feedback widget). The write carries a boolean and lands on the trace. The trace store joins the outcome event to the cost spans by trace ID. The query is one line of SQL.
The combination is what makes the dashboard honest. Cost per developer answers “which engineer drives the bill.” Cost per feature answers “which product surface costs the most to run.” Cost per outcome answers “is each dollar still buying what it used to.” All three live on the same span, attached by the gateway, captured by the trace processor, queryable by the warehouse. No custom pipeline.
from fi_instrumentation import register
from fi_instrumentation.fi_types import ProjectType
from opentelemetry import trace
from openai import OpenAI
import os

register(project_type=ProjectType.OBSERVE, project_name="support-bot")
tracer = trace.get_tracer(__name__)

client = OpenAI(
    api_key=os.environ["FAGI_VIRTUAL_KEY"],
    base_url="https://gateway.futureagi.com/v1",
)

def call_llm(user_id, feature, payload):
    with tracer.start_as_current_span("llm.call") as span:
        span.set_attribute("user.id", user_id)
        span.set_attribute("feature", feature)

        response = client.chat.completions.create(
            extra_headers={
                "x-agentcc-tag-feature": feature,
                "x-agentcc-tag-user": user_id,
            },
            **payload,
        )

        headers = response._raw_response.headers
        span.set_attribute("cost.usd", float(headers["x-agentcc-cost"]))
        span.set_attribute("model.served", headers["x-agentcc-model-used"])
        span.set_attribute("provider", headers["x-agentcc-provider"])
        span.set_attribute("cache.hit", headers["x-agentcc-cache"] == "hit")
        return response
The outcome event is written later, when the user accepts or the conversation resolves:
def record_outcome(trace_id, resolved):
    span = tracer.start_span("outcome", context=load_context(trace_id))
    span.set_attribute("outcome.resolved", resolved)
    span.end()
Three writes, one trace ID, every question downstream becomes a join.
Budget enforcement at the gateway: five levels, one ceiling per request
A cap that lives in a wiki page or a script someone forgets to run is not a cap. The only cap that holds when the on-call engineer is asleep is the one the gateway enforces inline on the request that would blow it.
The Agent Command Center tracks budgets at five levels in the same hierarchy: org, team, user, key, tag. A single request inherits the lowest applicable ceiling.
- Org-level. One global cap so a runaway script cannot sink the quarter.
- Team-level. Platform team gets a different cap than the customer-success internal tool.
- User-level. Per-developer caps. The Cursor power user with a heavy autocomplete habit gets a higher cap than the occasional user, and both surface before the bill arrives.
- Key-level. One key per feature or environment. CI gets a hard daily cap that returns 429 when blown. The Friday-afternoon prototype gets a soft cap that pages the owner at 80%.
- Tag-level. Free-form. Tag by route, experiment, or tenant. Tag-level caps catch the experiment that ran a week longer than planned.
Each level supports warn_threshold (default 0.8) and a hard-or-soft mode. Hard returns a structured 429 naming the level that blocked. Soft logs, alerts, and lets the request through. The combination is what keeps a fifty-developer team predictable across a hundred provider keys, three environments, and twelve product surfaces.
budgets:
  enabled: true
  default_period: monthly
  warn_threshold: 0.8
  org:
    limit: 50000
    hard: false
  teams:
    platform:   { limit: 12000, hard: false }
    support-cx: { limit: 8000,  hard: true  }
  users:
    cursor-power-user: { limit: 800, hard: false }
  keys:
    ci-tests: { limit: 200, hard: true, period: daily }
  tags:
    eval-pipeline: { limit: 3000, hard: false }
    prototype-q2:  { limit: 500,  hard: true  }
The hard-cap discipline is the part teams resist. A 429 will eventually block a developer mid-task. That is the point. The alternative is the surprise twelve-thousand-dollar bill, half of which was a single feature flag calling Claude Sonnet on every keystroke for two weeks. Tune the warn-threshold to alert the owner before the block fires. Set CI and prototype keys hard; set developer and team keys soft. The friction is real and worth it.
FAGI Agent Command Center: cost headers and the five-level loop
The Agent Command Center is the gateway that ties the previous three sections together. Every response carries five cost-related headers, set in the gateway handler before the body returns:
x-agentcc-cost: 0.000075
x-agentcc-latency-ms: 612
x-agentcc-model-used: anthropic/claude-3-5-sonnet
x-agentcc-provider: anthropic
x-agentcc-cache: miss
The dollar number lands on the response, not on a downstream reconstruction from a maintained price table that may or may not be fresh. The number on the trace is the number the gateway charged. The trace processor sets it as a span attribute, the Prometheus surface exposes it as agentcc_cost_total labelled by provider and status, and the OTLP exporter ships it to any OTel collector you already run.
The substitution loop runs on top of the same headers. Mirror or shadow rules route a percentage of live traffic to a candidate model. The gateway sets x-agentcc-cost for both incumbent and candidate; the trace processor scores both against a pre-committed rubric band; the rollout flips only when the band holds for the agreed window. The cheap-model regression cannot ship because the eval score on the candidate trace gates the promotion. This is the pattern that survives a quarter; pick-cheaper-and-ship is the one that does not.
Five other primitives ship in the same gateway:
- Virtual keys. SHA-256 hashed with an atomic microdollar credit ledger that debits per call. Managed-key revocation broadcasts via Redis pub/sub so a leaked or rotated key dies in milliseconds across every gateway instance.
- Exact and semantic caching. L1 exact-match in-memory or Redis; L2 semantic against Qdrant, Weaviate, or in-memory vectors. Each hit returns in single-digit milliseconds at zero token cost. The trace records the hit as a cache attribute so cost-per-outcome stays honest on cached calls.
- Routing strategies. Weighted, least-latency, cost-optimized, adaptive, and race. Config lives in YAML, not deploys.
- Provider adapters. Six native (OpenAI, Anthropic, Gemini, Bedrock, Azure, Cohere) plus 100-plus more via OpenAI-compatible presets.
- Performance envelope. Go runtime at roughly 29k req/s with P99 at 21 ms on a t3.xlarge with guardrails on. Apache 2.0, self-host or hit the cloud endpoint at
gateway.futureagi.com/v1.
The drop-in is one URL change:
from openai import OpenAI

client = OpenAI(
    api_key="sk-agentcc-...",
    base_url="https://gateway.futureagi.com/v1",
)
response = client.chat.completions.create(
    model="anthropic/claude-3-5-sonnet",
    messages=[{"role": "user", "content": "..."}],
    extra_headers={
        "x-agentcc-tag-feature": "support-triage",
        "x-agentcc-tag-tenant": "acme-corp",
    },
)
print(response._raw_response.headers["x-agentcc-cost"])
Existing OpenAI SDK code keeps working. The cost arrives on the response. The trace processor handles the rest.
Anti-patterns that kill attribution
Five anti-patterns show up repeatedly. Each is fixable in under a week with the gateway in place.
One shared vendor key across the org. The original sin. Zero attribution, one invoice. Fix: virtual keys per team, per developer, per service, rolled under one parent key for budget enforcement.
Token-only dashboards. Cost-per-token without cost-per-outcome flatters the cheap model that loops more. Fix: instrument the outcome event, join cost to outcome, put cost-per-outcome on the dashboard above the per-token line.
No eval-versus-inference split. The eval bill hides inside the inference line until the quarterly review. Fix: tag every call with traffic.type=eval or traffic.type=inference and split the warehouse view.
No anomaly alerts. A misconfigured retry loop, a recursive prompt, or a tenant abuse pattern runs unchecked for days. Fix: alert on per-tenant 2x spend deltas, per-developer 5x deltas, and eval-bill outpacing inference.
Caching without invalidation. The system prompt changed, the cached answer is now wrong, the user gets stale output for a week. Fix: tie cache namespace to the prompt version. When the prompt ships, the namespace flips, the cache repopulates.
How FAGI closes the loop end to end
Future AGI ships cost as the input to the next deploy, not as a dashboard that lives downstream of the bill. The five surfaces:
Agent Command Center is the gateway. OpenAI-compatible drop-in via base_url="https://gateway.futureagi.com/v1". Six native provider adapters plus 100-plus more via OpenAI-compatible presets. Routing covers weighted, least-latency, cost-optimized, adaptive, and race. Mirror and shadow rules ship as first-class config for quality-bounded substitution. Response headers expose x-agentcc-cost, x-agentcc-latency-ms, x-agentcc-model-used, x-agentcc-provider, and x-agentcc-cache on every call. Prometheus on /-/metrics. OTLP traces to any collector. Single Go binary, Apache 2.0.
traceAI carries cost to the span store as an OpenTelemetry attribute across Python, TypeScript, Java, and C#. The developer key, the feature tag, the cost dollar, and the eval score live on the same span. Cost-per-outcome is a query against the trace store, not a separate billing pipeline.
ai-evaluation is the rubric layer for the substitution band. The same templates run in pytest against the shadow set and against live traces. When the cheap-model band holds, the swap ships; when it does not, the cost line stays put.
Five-level budgets (org, team, user, key, tag) return a structured 429 naming the level that blocked. Warn-threshold pages the owner before the block fires.
agent-opt consumes failing or expensive trajectories and ships a shorter prompt the gateway routes next time. Six optimizers (random search, Bayesian search, meta-prompt, ProTeGi, GEPA, PromptWizard) with EarlyStoppingConfig so the loop bails on diminishing returns. The new prompt deploys, cost-per-outcome drops, the next dashboard refresh picks up the win.
The five surfaces live in one product. Cost is captured, traced, enforced, scored, and optimized on the same runtime. A cost spike feeds back into prompts and routing without an engineer joining tools by hand.
For the deeper observability picture, see AI agent cost optimization and observability in 2026 and best LLM cost tracking tools in 2026. For multi-tenant chargeback, see LLM cost tracking best practices.
Closing
LLM spend tracking in 2026 is not a dashboard problem. It is a metric problem and an attribution problem. Cost-per-token gets the dashboard wrong. Cost-per-outcome gets it right. Per-trace attribution with a developer, a feature, and an outcome on every span gets the data right. Budget enforcement at the gateway gets the discipline right. A gateway that sets the dollar number on the response header before the body returns gets the plumbing right.
Future AGI ships the full stack on one runtime: Agent Command Center for the gateway and cost headers, traceAI for the spans, ai-evaluation for the rubric band, five-level budgets for the caps, agent-opt for the loop back into prompts. Ready to attribute your agent’s bill to specific traces? Point your OpenAI SDK at https://gateway.futureagi.com/v1, read x-agentcc-cost on the response, and instrument the outcome event. Start with the Agent Command Center quickstart and the traceAI integration guide.
The CFO question stops being “why is the bill bigger” and starts being “which outcome is still profitable.” The metric changed. The conversation followed.
Frequently asked questions
Why is cost-per-token a misleading metric for LLM spend?
What does per-trace cost attribution actually require?
How does the gateway enforce budgets across org, team, user, key, and tag?
Which gateway response headers should I capture for cost attribution?
Why separate eval cost from inference cost?
How does the Future AGI Agent Command Center close the cost loop?
Sticker per-token price is the wrong unit. Use effective cost = sticker x (1 - cache_hit) x prompt_ratio. 2026 methodology, five lanes, per-provider knobs.


Eval budget is four knobs: rubric coverage, dataset size, judge tier, refresh cadence. Priority order that maximizes signal per dollar, with a 90-day plan.
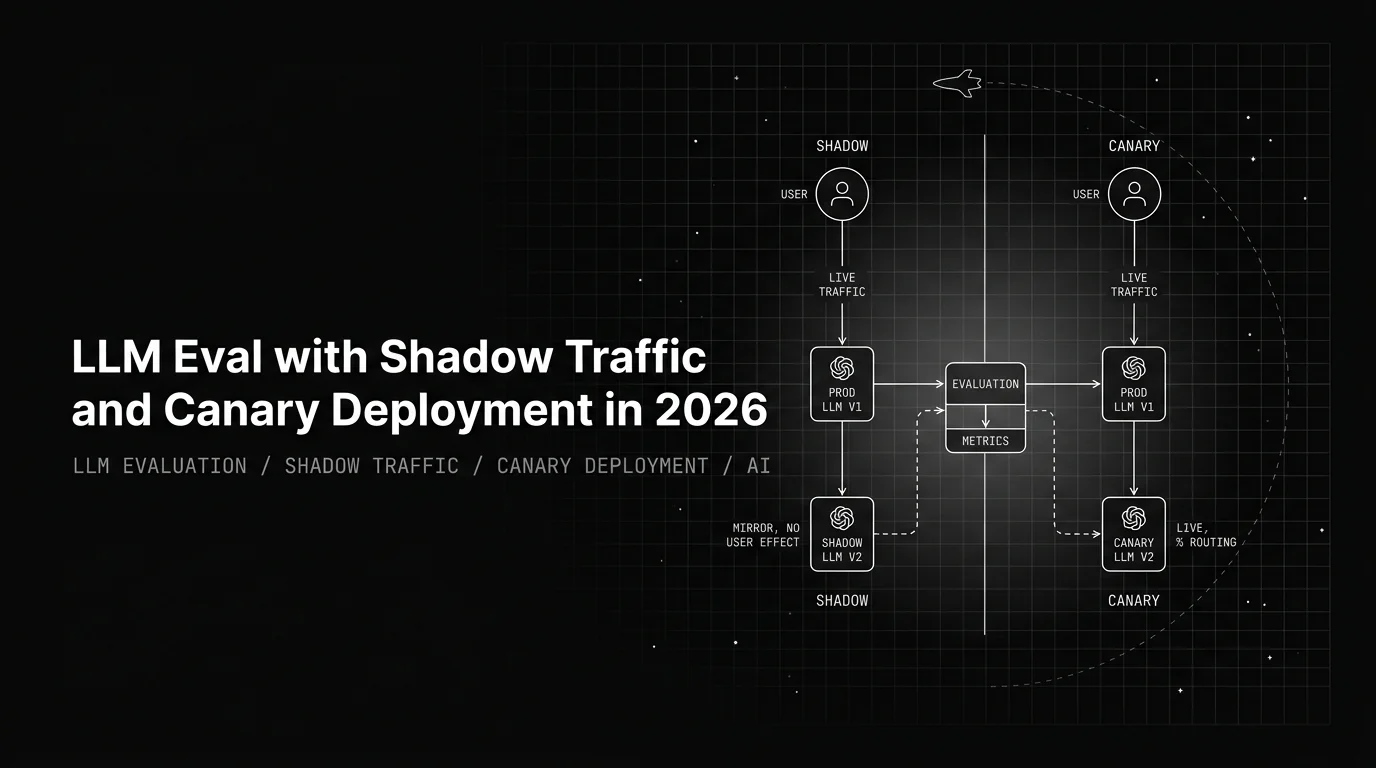
Shadow is not canary. Mirror routing with no user effect vs percentage routing with rollback. Score-attached traffic, ACC patterns, gotchas.
