How to Evaluate GraphRAG Pipelines: Metrics Beyond RAG
Base RAG metrics miss the graph underneath GraphRAG. Here is a three-layer framework, runnable graph metrics, and answer scores that isolate each failure.
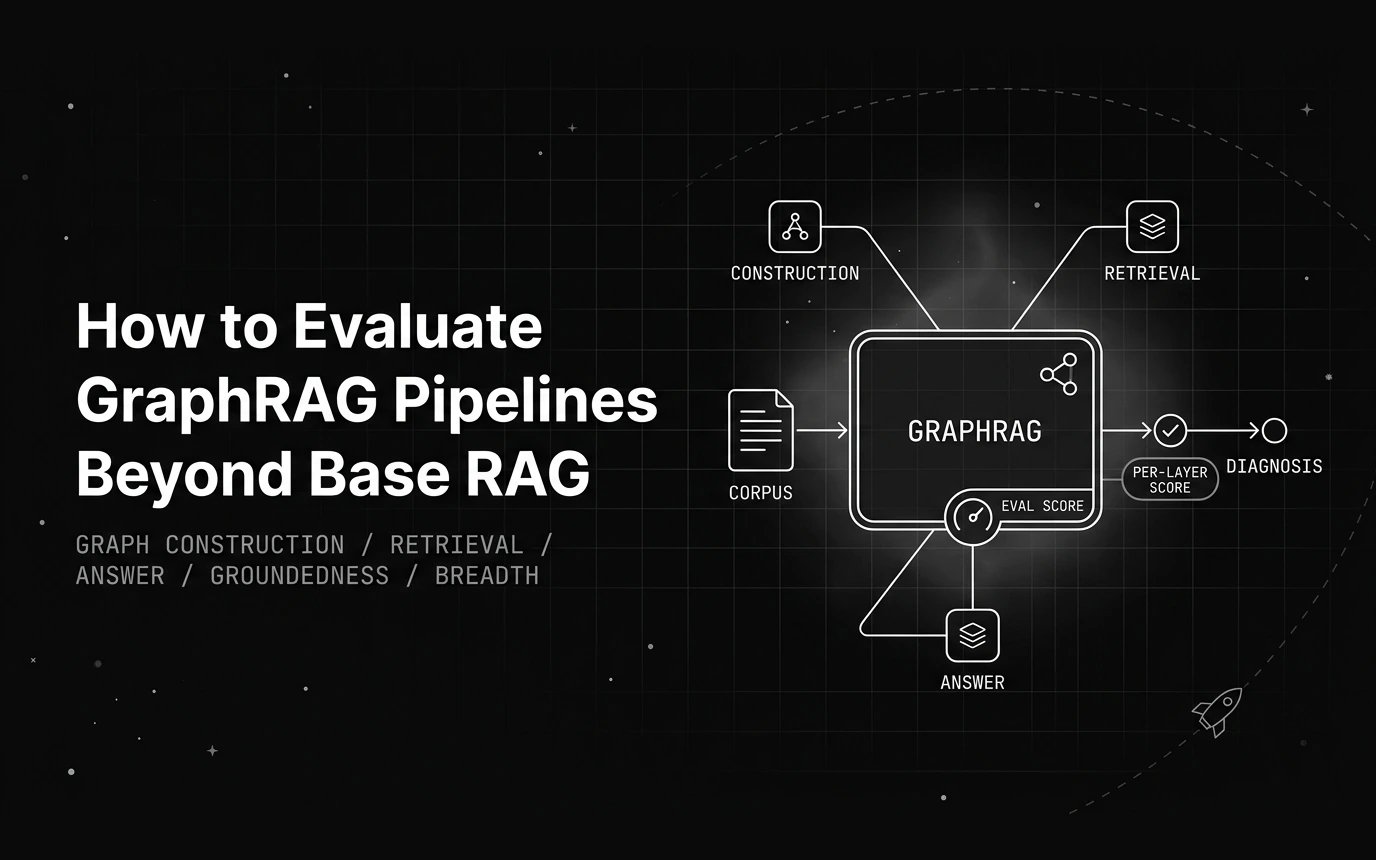
Table of Contents
You added a knowledge graph to your RAG pipeline. Entities, relationships, communities, the whole structure. Then you evaluated it with the same faithfulness and context-precision scores you used for plain RAG, and never once measured whether the graph you built is any good.
That gap is the subject of this guide. GraphRAG adds layers that base RAG metrics cannot see, so scoring only the final answer hides failures in the graph underneath it. A pipeline can look faithful while sitting on a broken graph.
Here is what this covers. The three layers where GraphRAG evaluation has to happen, the metrics that fit each layer, and runnable code for the layer almost no eval tool scores for you, the graph itself. This is a metrics guide, not a build tutorial.
One scope note up front. We assume you already have a GraphRAG pipeline and want to measure it. The goal is a layered read that tells you not just that quality dropped, but which layer caused the drop.
TL;DR
- GraphRAG evaluation happens at three layers, graph construction, retrieval, and answer quality, and base RAG metrics only score the third.
- Layer one, graph construction: entity and relation precision, recall and F1 against a gold set, plus connected-component count and density. No eval platform ships this, so you compute it with networkx in about twenty lines.
- Layer two, retrieval: score the retrieved community IDs against gold community IDs with Precision@K, Recall@K, NDCG@K, MRR and Hit Rate, and judge sufficiency with Context Relevance. Match on IDs, not summary text, because these evaluators compare by exact string equality.
- Layer three, answer: Groundedness and Chunk Utilization on every query, plus Microsoft’s comprehensiveness, diversity and empowerment rubrics for global search only.
- Match the metric to the query mode. Microsoft’s own results show global GraphRAG losing to vector RAG on directness and winning on comprehensiveness and diversity.
- Root-level community summaries cost over 97% fewer context tokens than summarising source text, so tokens per answer at a fixed quality level is a real retrieval metric, not just a cost line.
What GraphRAG Is
GraphRAG is a retrieval approach that builds a knowledge graph of entities and relationships from your corpus, groups related entities into communities, and retrieves over that structure instead of over isolated text chunks. The graph becomes the retrieval index, in place of a flat list of passages.
The approach most people mean by the name is Microsoft’s, published in 2024 and released as an open-source project under the MIT license. Their pipeline extracts entities and the relations between them, then runs the Leiden algorithm to detect communities of densely connected entities. Those communities get summarized, and the summaries become retrievable units.
That structure supports several query modes, and two of them frame everything below. Global search runs over community summaries to answer broad questions about a whole corpus. Local search works around specific entities and their neighbors to answer focused questions. The two modes serve different query types, which matters later when we pick metrics. DRIFT search sits between them, running a local search seeded with community information, and basic search is a plain vector baseline the project ships for comparison.
This is a real shift from base RAG, where retrieval pulls the top-k text chunks by vector similarity. Our guide to RAG architecture covers that baseline in depth. GraphRAG keeps the generation step but replaces flat retrieval with graph-structured retrieval, and that added structure is exactly what needs its own evaluation.
Why Base RAG Metrics Fall Short for GraphRAG
Base RAG metrics were built for a simpler pipeline. Retrieve text chunks, generate an answer, then score whether the answer is faithful to the chunks and whether the chunks were relevant. Those two questions, faithfulness and context precision, assume that retrieval means pulling passages.
GraphRAG breaks that assumption by adding two upstream stages. First it constructs a graph, extracting entities and relations, which can go wrong before any retrieval happens. Then it retrieves communities or subgraphs rather than passages, so relevance becomes a question of graph selection instead of chunk ranking.
Base metrics cannot see either stage. They score the answer and the final context, so a pipeline can post a high faithfulness number while its graph is fragmented, its entities are half-missing, and its community retrieval is pulling the wrong neighborhood. The answer metric passes, and the real failure stays invisible.
That is the core problem. Faithfulness measures whether the answer matches the context it was given, not whether that context came from a well-built graph. To evaluate GraphRAG you need metrics for the stages base RAG never had. The table lines up what each metric measures and which pipeline it belongs to.
| Metric | Measures | Base RAG or GraphRAG |
|---|---|---|
| Context precision and recall | Retrieved text relevance | Base RAG |
| Faithfulness and groundedness | Answer supported by context | Both |
| Entity and relation extraction F1 | Graph construction quality | GraphRAG |
| Community or subgraph relevance | Graph retrieval quality | GraphRAG |
| Graph connectivity and density | Graph health | GraphRAG |
| Comprehensiveness and diversity | Global-search answer breadth | GraphRAG |
Read the table as a coverage map. The base RAG rows still apply, GraphRAG just adds four measurement targets on top, and those additions are where the graph-specific failures hide.
The Three Layers of GraphRAG Evaluation
The framework that holds this whole guide together is simple. Evaluate GraphRAG at three layers, because a failure at any one of them degrades the final answer, and only layer-specific metrics tell you which layer broke. Score the answer alone and you are guessing at the cause.
Layer one is graph construction. Did the pipeline extract the right entities and the right relations, and is the resulting graph connected rather than fragmented. This is the foundation, and an error here propagates into everything downstream.
Layer two is retrieval. Given a query, did the pipeline pull the right communities or the right entity neighborhood. GraphRAG retrieves structure, so this layer asks whether the selected subgraph actually matches what the question needs.
Layer three is the answer. Is the generated response grounded in the retrieved context, and for global questions, is it comprehensive and diverse enough to justify the graph. This is the layer that overlaps base RAG, plus the breadth dimensions a graph is supposed to buy you.
| Layer | What it measures | Example metrics |
|---|---|---|
| Graph construction | Did we build the right entities and relations | Entity and relation F1, connectivity, density |
| Retrieval | Did we pull the right communities or subgraph | Community relevance, subgraph precision and recall |
| Answer | Is the response grounded and complete | Groundedness, comprehensiveness, diversity |
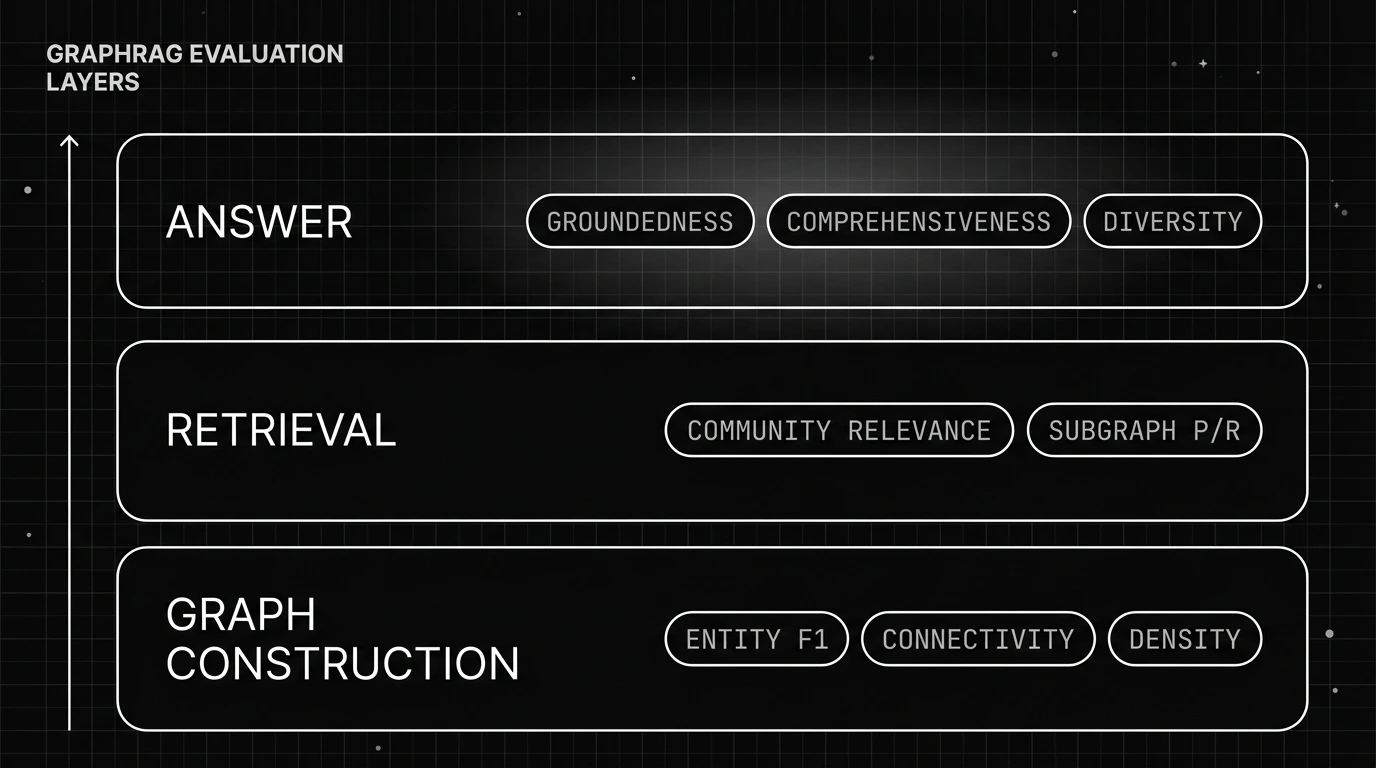
The point of the split is diagnosis. When an answer is weak, the per-layer scores tell you whether the graph was built wrong, retrieved wrong, or generated wrong, and each of those has a different fix.
Layer 1, Graph Construction Metrics
Before retrieval or generation happens, GraphRAG extracts entities and the relations between them from your corpus. If that extraction is wrong, every downstream stage inherits the error, and no base RAG metric ever looks here. This is the layer that gets skipped, and it is the foundation of everything above it.
The first metric is extraction accuracy. Against a gold set of the entities and relations a passage should yield, compute precision, recall, and F1. Precision tells you what fraction of extracted entities were real, recall tells you what fraction of real entities you caught, and F1 balances the two into a single number.
The second set is graph health. Even with good entities, the graph can be structurally weak. Connectivity tells you whether the graph is one linked structure or a pile of disconnected fragments, and density tells you whether entities are richly related or sparsely stitched together. A fragmented graph breaks multi-hop retrieval before a query even arrives.
The code below scores both. It computes entity precision, recall, and F1 against a gold set, then reports node count, edge count, density, and the number of connected components using networkx.
# Layer 1: score the knowledge graph GraphRAG built, which base RAG metrics
# never touch. Entity extraction P/R/F1 plus basic graph-health measures.
import networkx as nx

def entity_prf(predicted: set, gold: set) -> dict:
    tp = len(predicted & gold)
    precision = tp / len(predicted) if predicted else 0.0
    recall    = tp / len(gold) if gold else 0.0
    denom = precision + recall
    f1 = (2 * precision * recall / denom) if denom else 0.0
    return {"precision": round(precision, 3),
            "recall": round(recall, 3), "f1": round(f1, 3)}

# The graph your pipeline extracted from the corpus.
G = nx.Graph()
G.add_edges_from([("Ada Lovelace", "Analytical Engine"),
                  ("Analytical Engine", "Charles Babbage")])
G.add_node("Alan Turing")          # extracted, but no relation was found

predicted = set(G.nodes) - {"Analytical Engine"}
print(entity_prf(predicted, {"Ada Lovelace", "Charles Babbage"}))
print("nodes:", G.number_of_nodes(), "edges:", G.number_of_edges())
print("density:", round(nx.density(G), 3))
print("components:", nx.number_connected_components(G))  # 2 = fragmented graph
Read the output plainly. The F1 score is your extraction quality on that sample, and you track it against a gold set as the pipeline changes. The component count is the fast warning, because more than one connected component means the graph is fragmented, and a fragmented graph cannot support the multi-hop reasoning that justified building it.
Density is a judgment call, not a pass-or-fail line. A very sparse graph may be missing real relations, while an extremely dense one may be over-connecting entities that are not truly related. Track it over time and investigate sudden swings rather than chasing an absolute target.
Layer 2, Retrieval and Community Metrics
GraphRAG retrieval does not pull flat chunks. In global search it retrieves community summaries, and in local search it pulls the neighborhood around specific entities. So retrieval quality here is about whether the pipeline selected the right part of the graph for the query, not whether it ranked passages well.
The core metric is community or subgraph relevance. For a given query, are the retrieved communities actually on-topic, or did the pipeline surface a neighborhood that does not bear on the question. Where you have a gold subgraph, you can compute subgraph precision and recall the same way you would for any retrieval set.
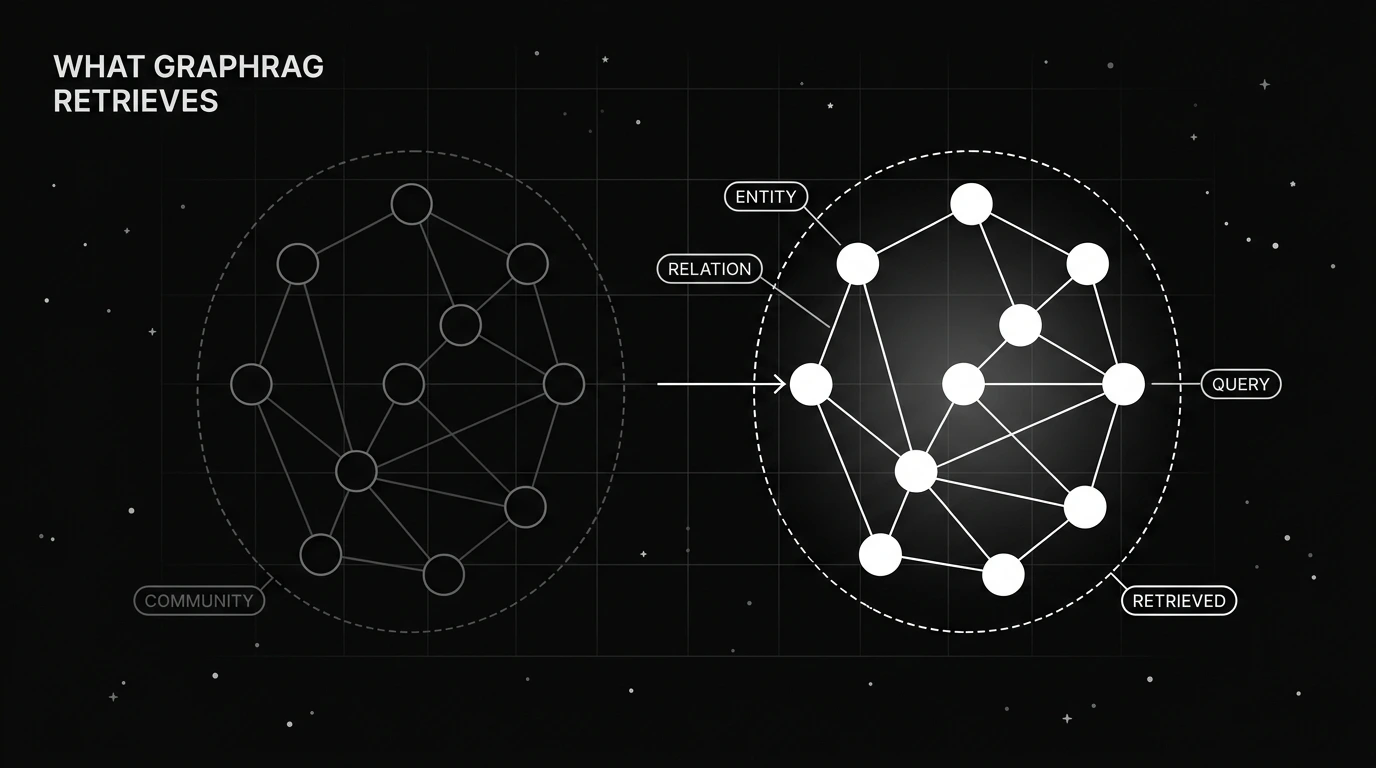
For global search there is an extra question of scope. Community detection produces a hierarchy, from broad root-level communities down to fine-grained low-level ones, and the right level depends on the query.
A broad question wants a high-level summary, a specific one wants a lower level, and picking the wrong level is itself a retrieval error. Ordering research from our reranker guide applies to ranking retrieved communities too.
There is also an efficiency dimension worth measuring, and it is a real advantage of the hierarchy. In Microsoft’s evaluation, the most concise root-level community summaries used over 97% fewer context tokens than a source-text baseline, and the low-level summaries roughly 26 to 33% fewer, while staying competitive on answer quality.
So tokens spent per answer at a fixed quality is a legitimate retrieval metric, not just a cost line.
Put together, layer two asks two things. Did you retrieve the right subgraph, and did you do it at the right level and cost. Both feed the answer, and both are invisible to a metric that only reads the final text.
Layer 3, Answer Quality Metrics
Layer three is where GraphRAG overlaps base RAG, plus a set of dimensions specific to graph-based global answers. Two metrics carry over directly. Groundedness asks whether every claim in the answer is supported by the retrieved context, and answer relevance asks whether the response actually addresses the query.
Groundedness is the one that catches the most damage. A GraphRAG answer can read fluently while asserting claims the retrieved communities never supported, which is the same hallucination problem base RAG has, measured the same way.
Our hallucination deep dive covers the failure in detail. Future AGI ships this as the Groundedness built-in, scored on live traces so you see it drift rather than discovering it in an offline run. Ragas offers the same check under the name faithfulness if you want it as a library call in a notebook.
The GraphRAG-specific dimensions come from Microsoft’s global-search evaluation, and they are judged by an LLM comparing two answers head to head.
Comprehensiveness asks how completely an answer covers the question, diversity asks how varied its perspectives are, and empowerment asks whether it helps a reader reach an informed judgment. These three capture breadth, which is the reason to build a graph in the first place.
The fourth dimension is the honest one. Directness measures how specifically and clearly an answer addresses the query, and the paper includes it as a validity check. Global GraphRAG scores lower on directness than a simpler baseline, while winning on comprehensiveness and diversity. An LLM-as-a-judge setup is how these head-to-head comparisons are scored.
So the answer layer splits by query type. Local search is built for the same focused questions vector RAG serves, so directness is the metric to hold it to, even though the paper does not measure it. Global search wins on breadth for broad ones. The right metric depends on what your users actually ask, and asserting comprehensiveness on a pipeline built for direct answers just penalizes it for a job it was never doing.
Running a GraphRAG Evaluation End to End
Tie the three layers into one workflow. Build a small gold set first, gold entities and relations for construction, gold subgraphs where you can label them for retrieval, and reference answers for the answer layer. The gold set is the work, and it is what makes every downstream score meaningful.
Then score each layer separately and read the results together. A construction F1, a retrieval relevance number, and an answer groundedness score, kept as three distinct signals rather than collapsed into one. That separation is the entire diagnostic value of the framework.
Reading them together is where the framework pays off. A good graph with a weak answer points at retrieval or generation, so you look there. A weak graph with a passable answer is luck that will not hold as queries get harder, and the per-layer scores are what tell those two situations apart.
The practical loop is to freeze the gold set, run all three layers on every meaningful change to the pipeline, and watch which layer moves. When the answer score drops, the layer that dropped with it is your suspect, and you have turned a vague quality complaint into a located failure.
Where Does GraphRAG-Bench Fit?
Everything above measures your pipeline. A public benchmark answers a different question, and it is worth knowing which one you are asking.
GraphRAG-Bench tests GraphRAG methods on college-level questions drawn from twenty textbooks across sixteen disciplines, and it scores the same three stages this guide does: graph construction, knowledge retrieval, and answer generation. That convergence is the useful signal. The layered read is not a house style, it is how the field evaluates these systems.
Its construction metrics are worth stealing, because they cover the cost side this guide does not. It reports efficiency as the time to build a complete graph, cost as the tokens consumed during construction, and organization as the proportion of non-isolated nodes. Across the methods tested, construction ran from roughly 10 million to 84 million tokens and from about 77 seconds to over 20,000 seconds.
Add build time and token cost to your layer-one dashboard. Extraction quality tells you whether the graph is right, and build cost tells you whether it is worth having. A graph that scores well and costs 84 million tokens to rebuild is a different decision from one that scores the same for 10 million.
The organization metric is also a sharper version of the component count above. Both ask whether your nodes are actually connected to anything; the ratio just scales better than counting components once the graph is large.
So use the benchmark to decide whether GraphRAG is worth building for your domain, and use this framework to decide whether your build is working. They are not substitutes, and neither one answers the other’s question.
Scoring GraphRAG Retrieval and Answers with Future AGI
The answer layer of this framework is text-quality scoring, which is exactly what Future AGI’s custom evals do. That makes them a clean fit for layer three, scoring whether each GraphRAG answer is grounded in the communities it retrieved and relevant to the query that produced it.
With custom evals you pick the grading rule, an LLM judge or a deterministic check, map the columns that matter, question, retrieved context, and answer, and set a pass or fail threshold. Then you score each answer for groundedness and context relevance, and you can define comprehensiveness-style rubrics of your own for global-search breadth.
The evaluation docs walk through defining a rule, and built-in evaluators like groundedness and context adherence are ready to run.
Scores attach to whole traces or to a single span, so you can score the answer step specifically rather than the whole pipeline at once.
The Observe docs cover attaching scores to spans, the ai-evaluation SDK runs the evals in your own stack, and the open-source traceAI instrumentation captures the spans to score.
Layer two has built-ins too, and they are the ones most people assume they have to write. The statistical retrieval evaluators score a ranked list against a gold set: Precision@K, Recall@K, NDCG@K, MRR, and Hit Rate. Pass your retrieved community IDs in rank order against the gold community IDs for that query and you get subgraph precision, recall, and ranking quality without writing the loop.
One rule decides whether this works. Match on stable community IDs, never on generated summary text, because these evaluators compare the two lists by exact string equality and a resummarised community will not match itself.
Context Relevance is the judge-based counterpart, scoring whether the retrieved communities are relevant and sufficient for the query. Chunk Attribution and Chunk Utilization catch the case where retrieval found the right community and the generator ignored it.
The boundary is worth stating, and it is not a Future AGI boundary. The eval tools in this space score retrieval and answers, not graph structure, which is why layer one stays yours: connectivity, density, and component count come from the networkx code above, and nobody ships an entity-and-relation-F1-against-a-gold-graph metric. Outside the benchmark papers, this layer is largely unserved. If you want the number without writing the code, the same retrieval evaluators work on entities: pass your extracted entity list as the hypothesis and the gold entity list as the reference, and Precision@K and Recall@K give you entity precision and recall directly. They match on exact strings, so normalise entity names first. Everything from retrieval upward ships as a built-in, which is the part that usually gets budgeted as custom work. Naming which layer a tool serves is the whole point of this framework, and it is the fastest way to see how much of a stack you are actually being sold.
Choosing Metrics That Match Your GraphRAG Goal
Come back to the pipeline from the opening, the one measured with base RAG metrics alone. Those scores looked fine while construction and retrieval failures sat underneath them, unmeasured. The three-layer framework is what brings those hidden failures into view.
The rule to take away is to pick metrics by layer and by query type. Score graph construction and retrieval separately from the answer, so a low final score points at a cause instead of a symptom. Match global search to comprehensiveness and diversity, and local search to directness, because the right metric depends on the question you serve.
Build the gold set once, score all three layers, and read them together. That is the difference between knowing your GraphRAG pipeline got worse and knowing exactly where. A number that cannot locate a failure cannot help you fix it.
Future AGI covers both layers that any platform covers, out of the box. Precision@K, Recall@K, NDCG@K and Context Relevance score the retrieved community IDs; Groundedness and Chunk Utilization score the answer against them, on live traces rather than in a one-off offline run. The graph itself is twenty lines of networkx you own, and no vendor will hand you that. Start with the evaluators and add the graph checks alongside them.
Frequently Asked Questions
How do you evaluate a GraphRAG pipeline?
How is GraphRAG evaluation different from RAG evaluation?
What metrics measure GraphRAG graph construction?
How do you evaluate GraphRAG global versus local search?
What tools score GraphRAG answer quality?
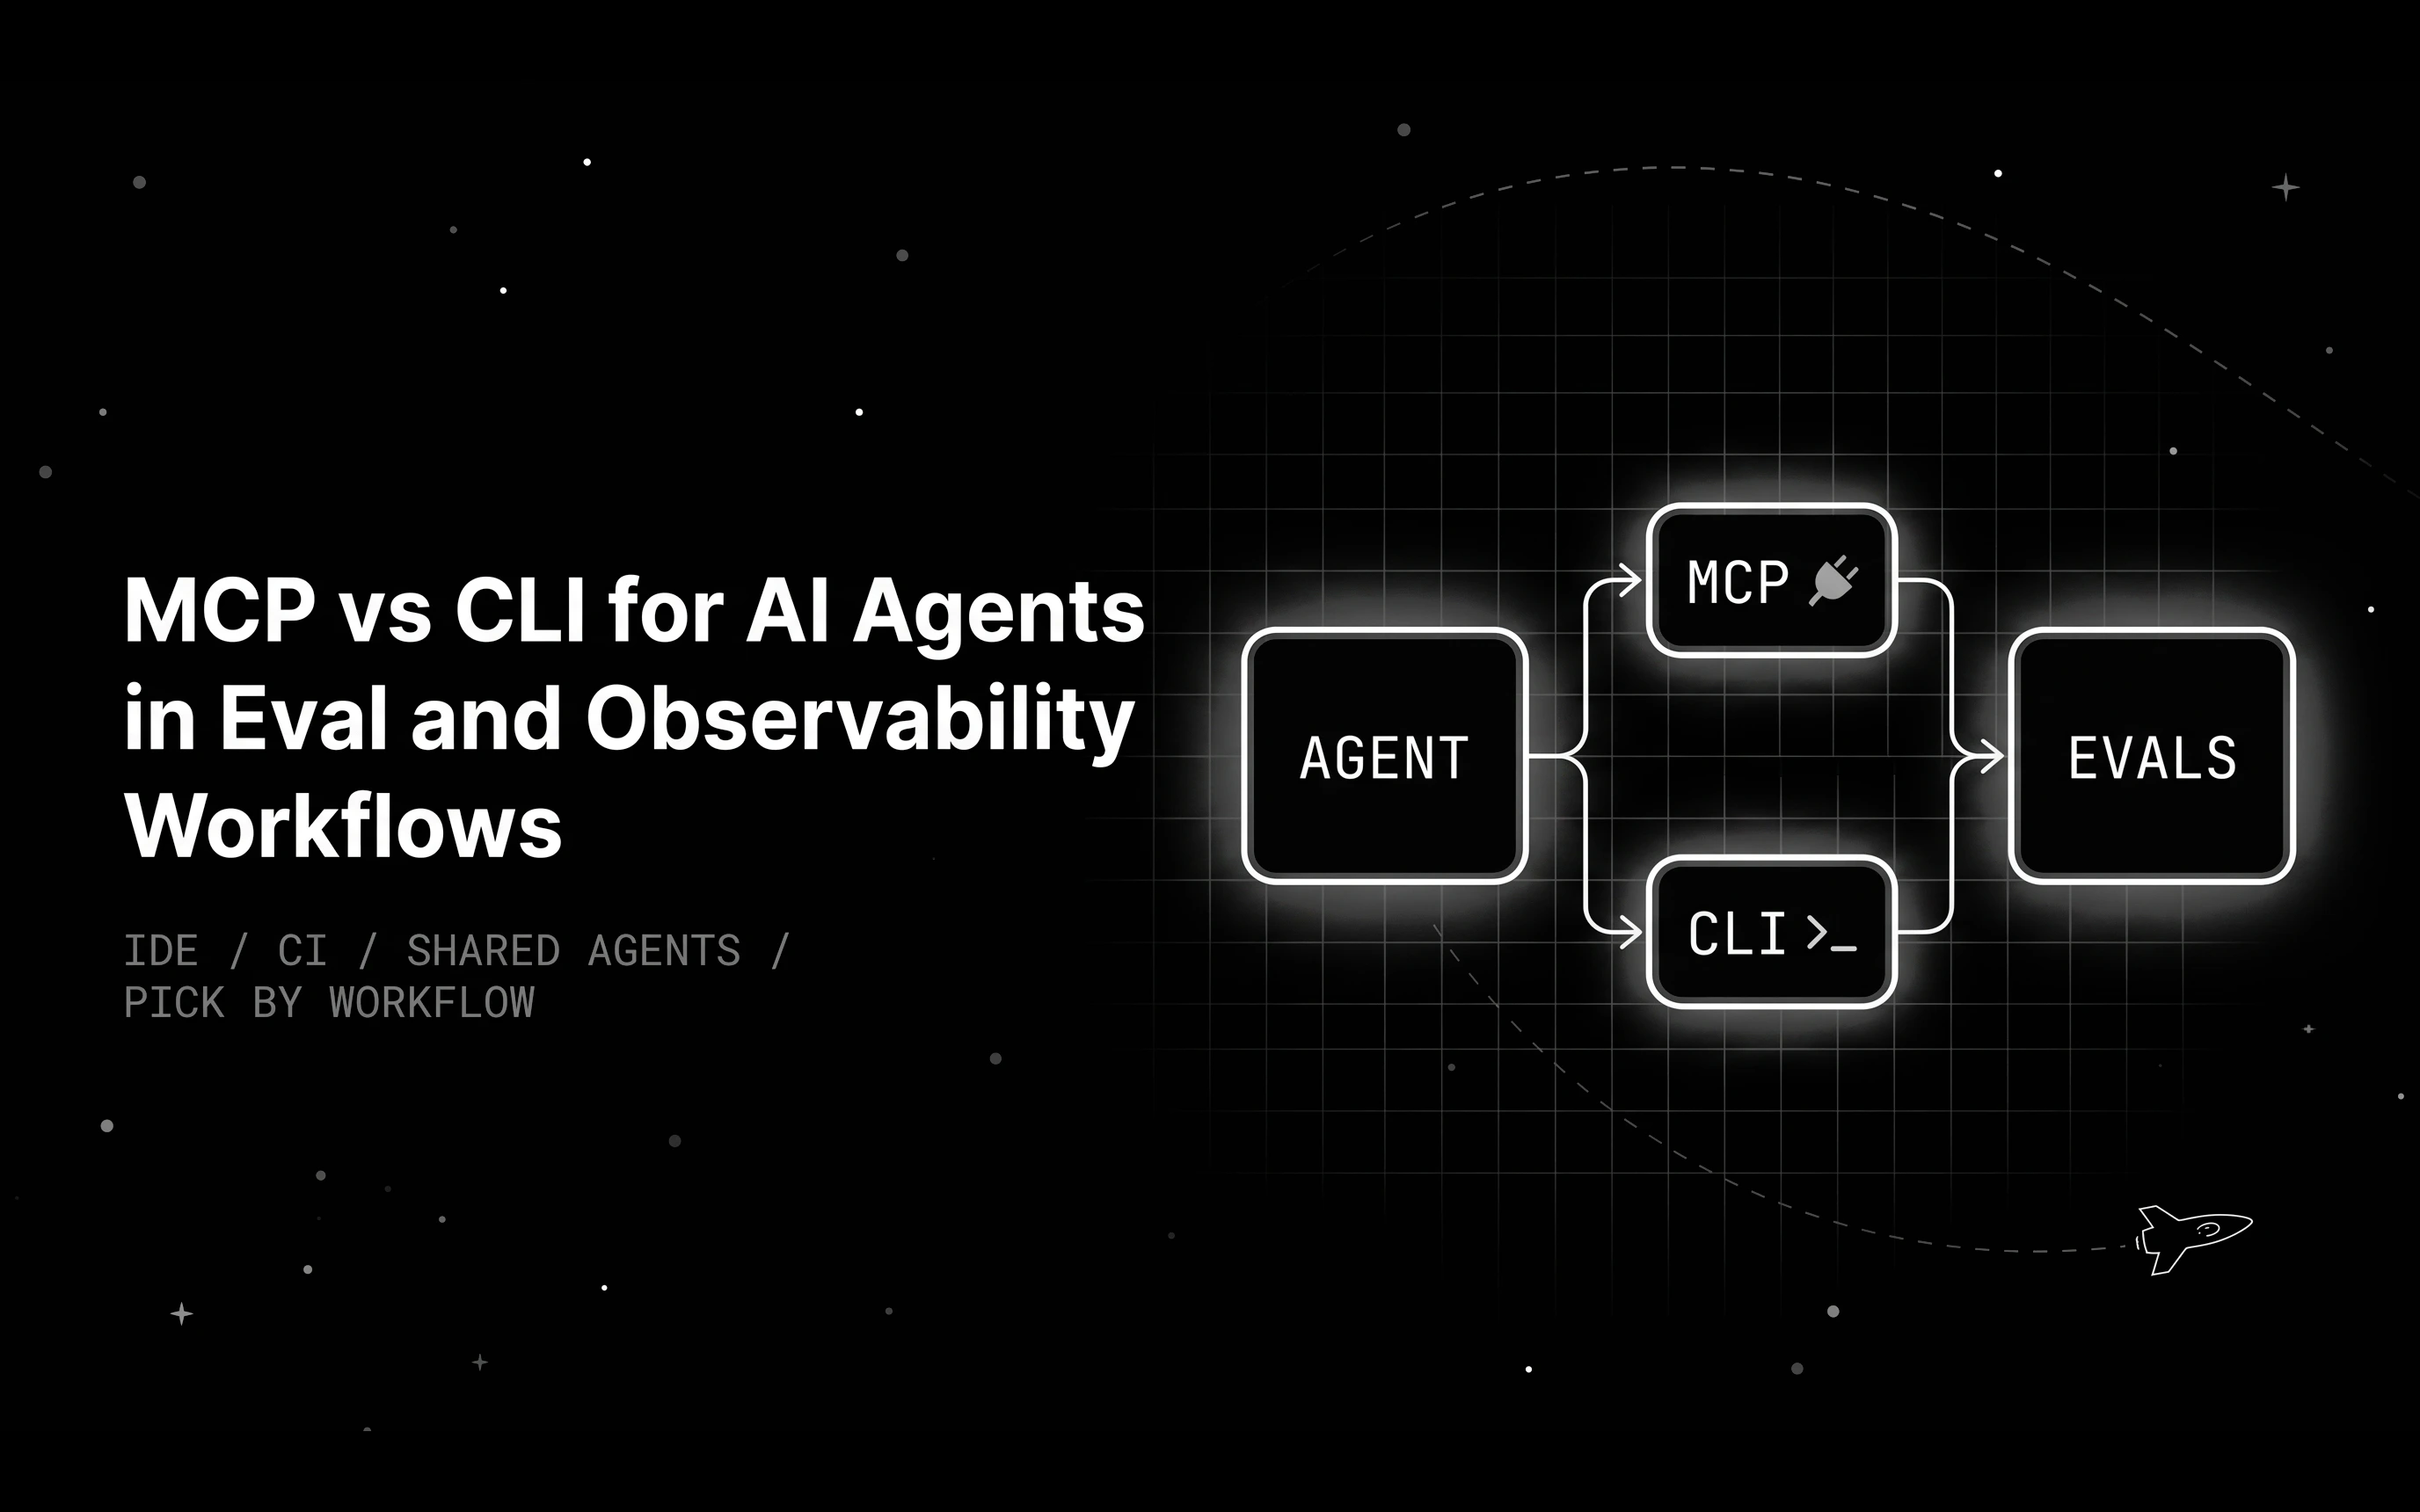
MCP vs CLI for AI agents, decided job by job: trace debugging, CI eval gates, nightly runs, shared team agents, and skills for repeatable team procedures.

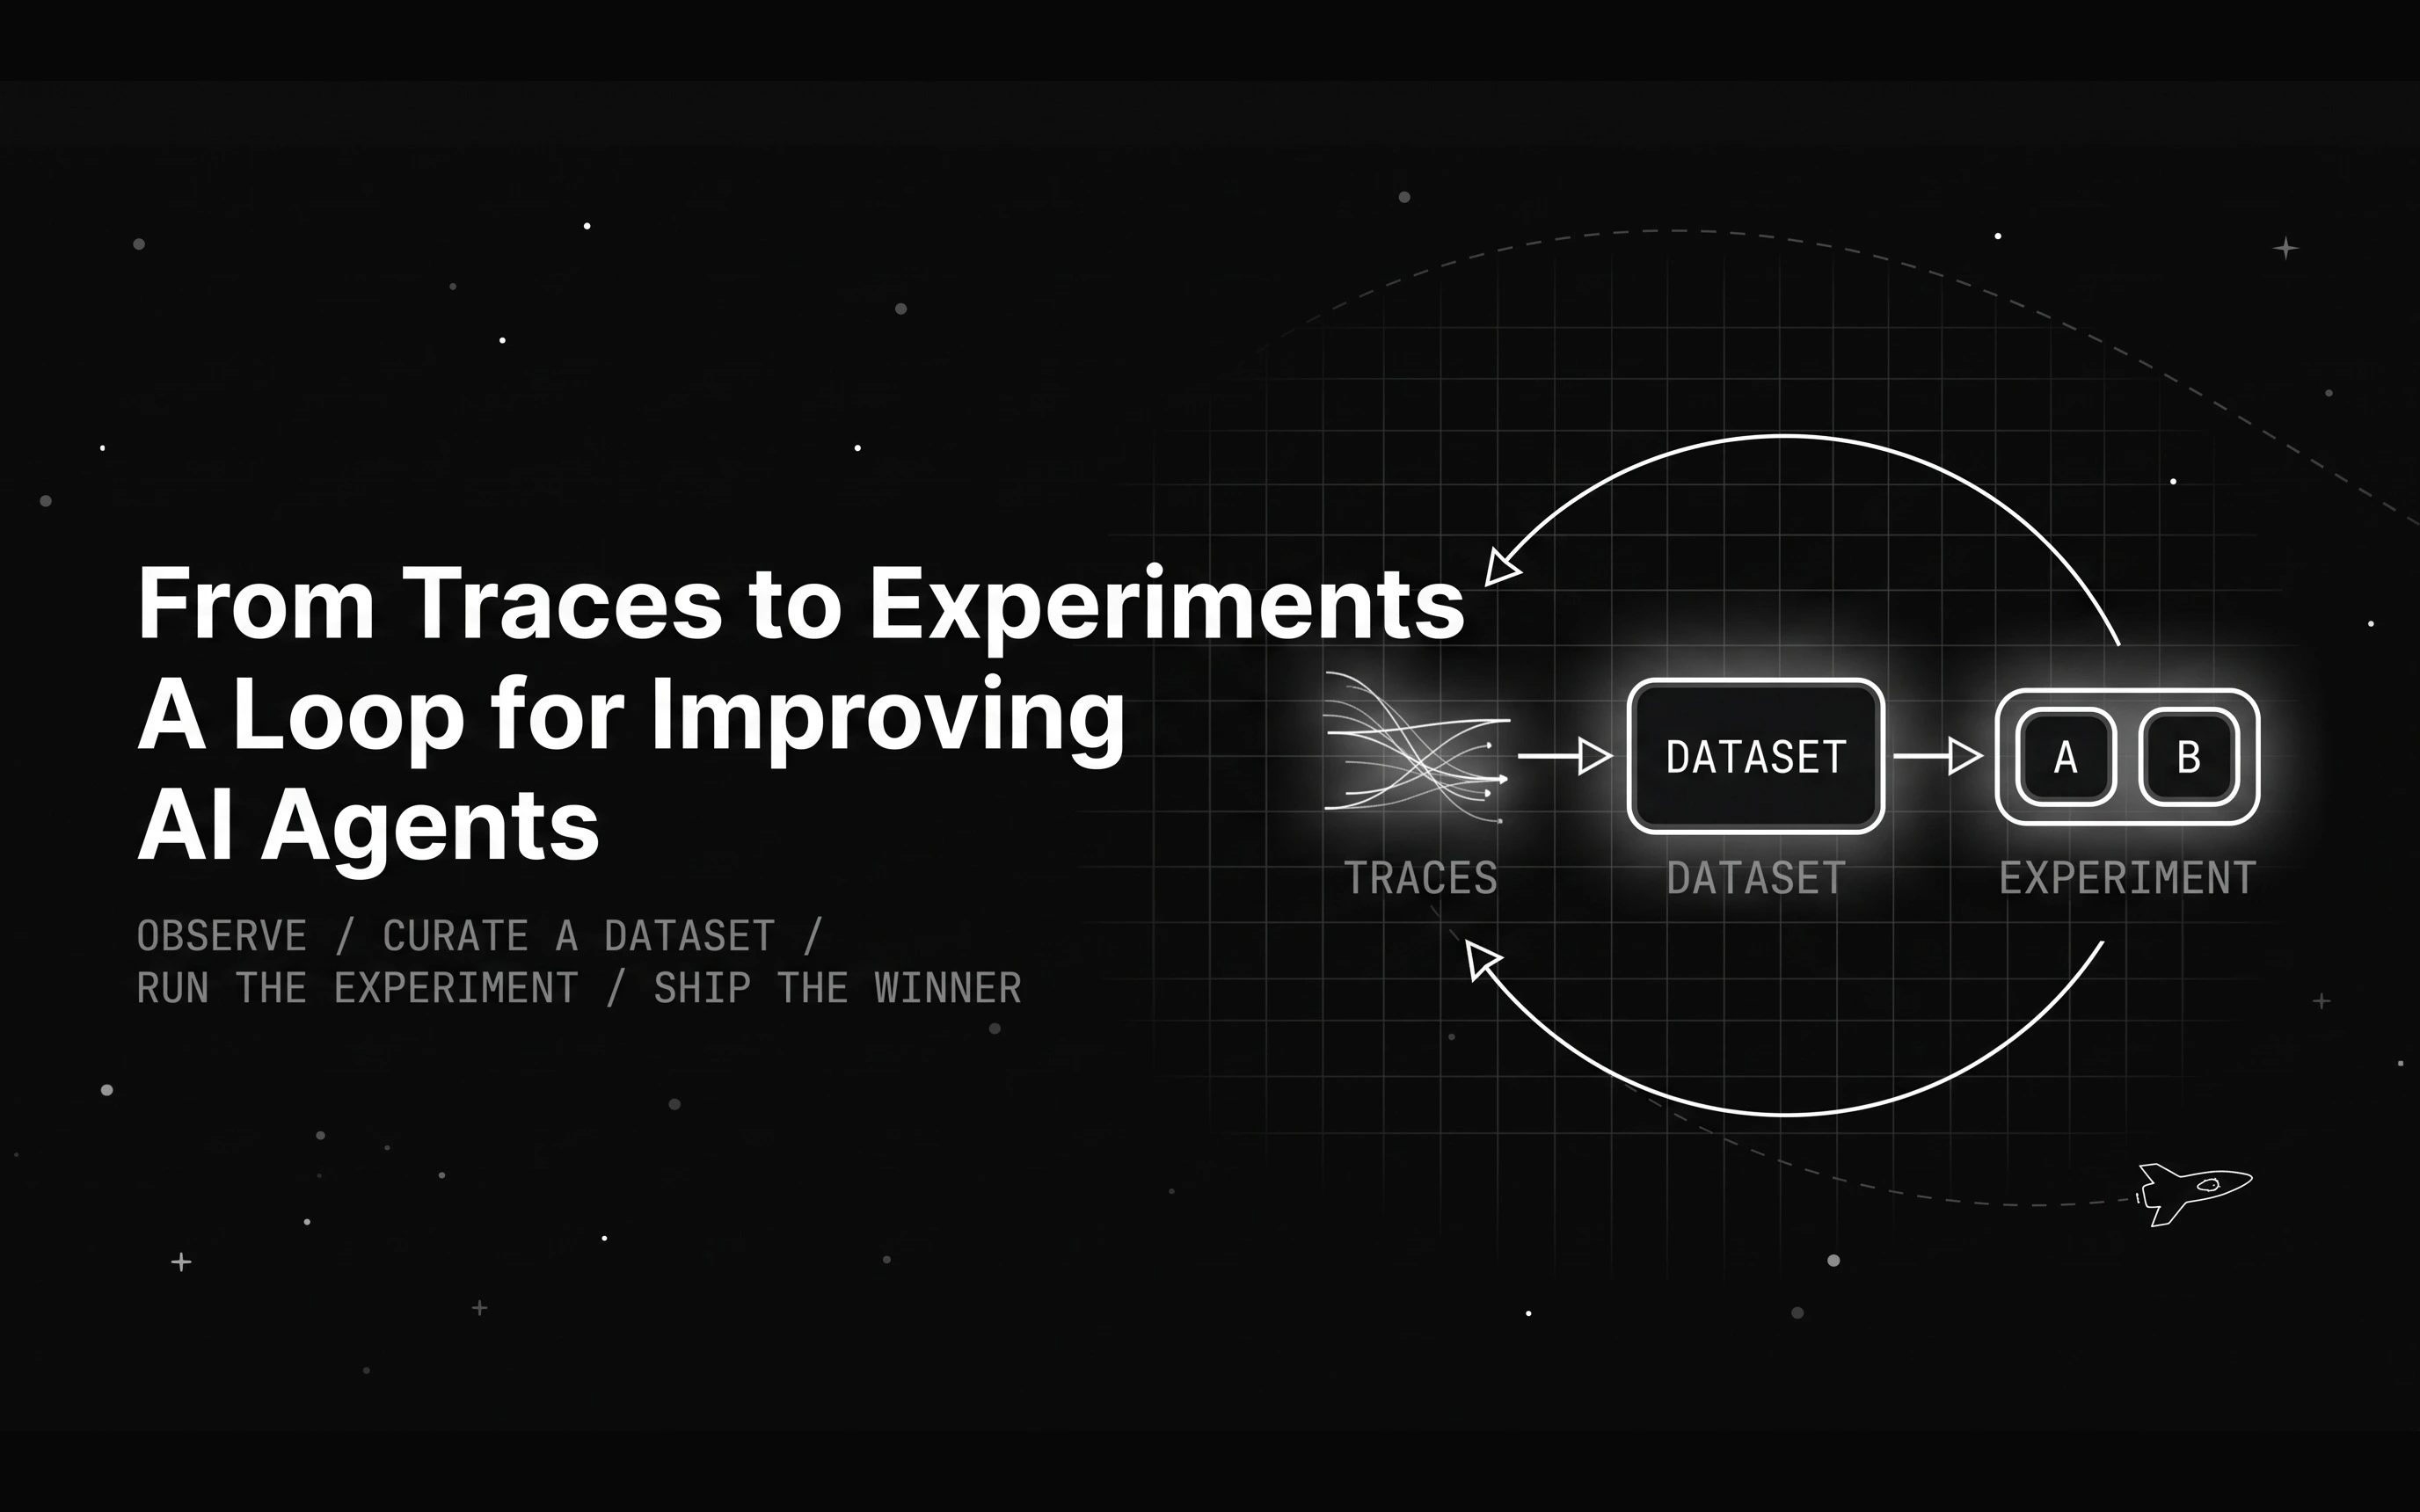
A month of agent traces does not improve anything by itself. Here is the loop that turns traces into agent experiments that prove which change actually helps.
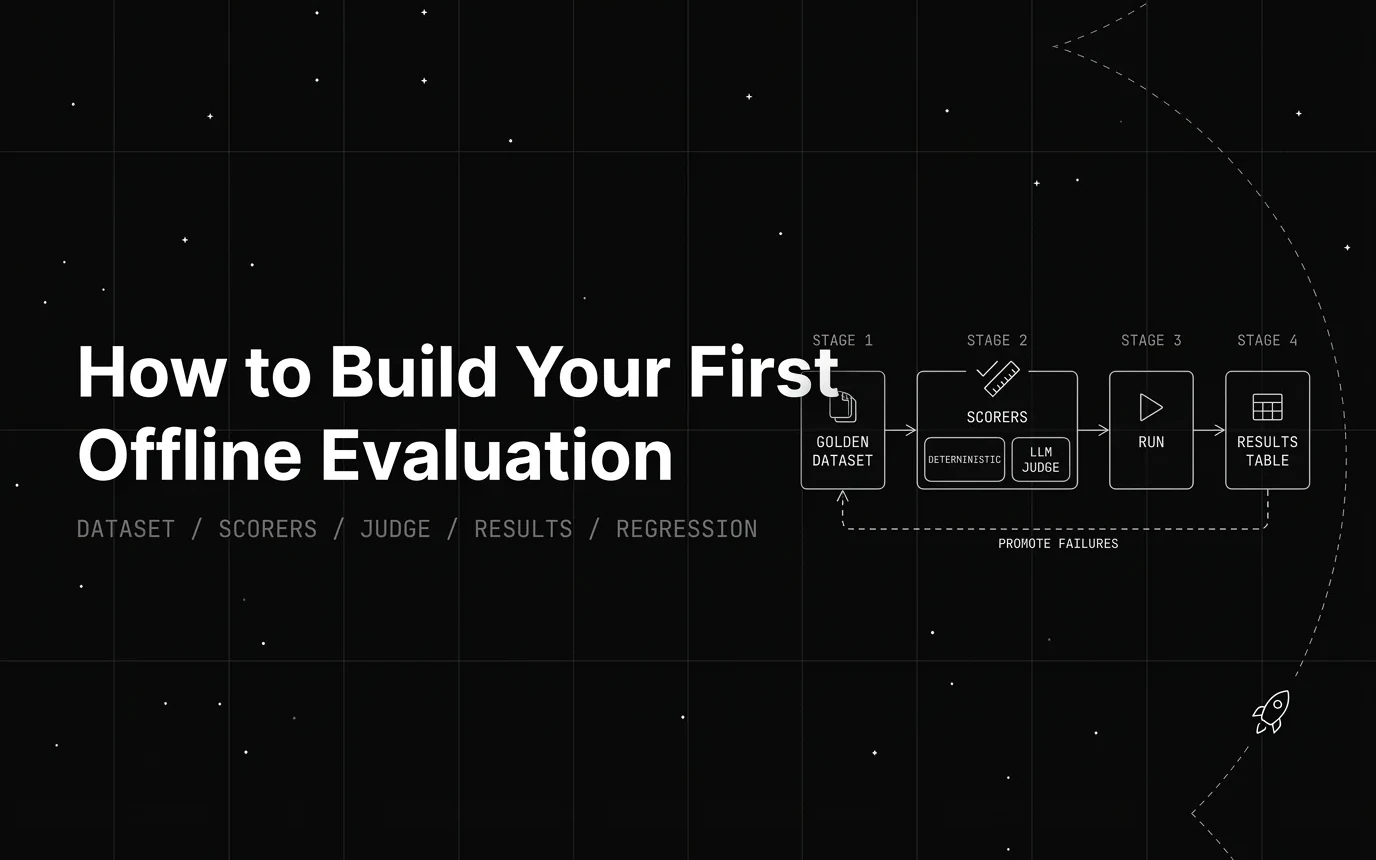
Build a first offline evaluation for an LLM app in one script: a 5-row golden set, a deterministic scorer, and a pass rate. Runnable code, no API key needed.