AI Evaluation Reporting That Earns Stakeholder Trust
A persona-to-metric map, a reporting cadence, and an incident playbook for AI evaluation reporting that earns stakeholder trust instead of assuming it.
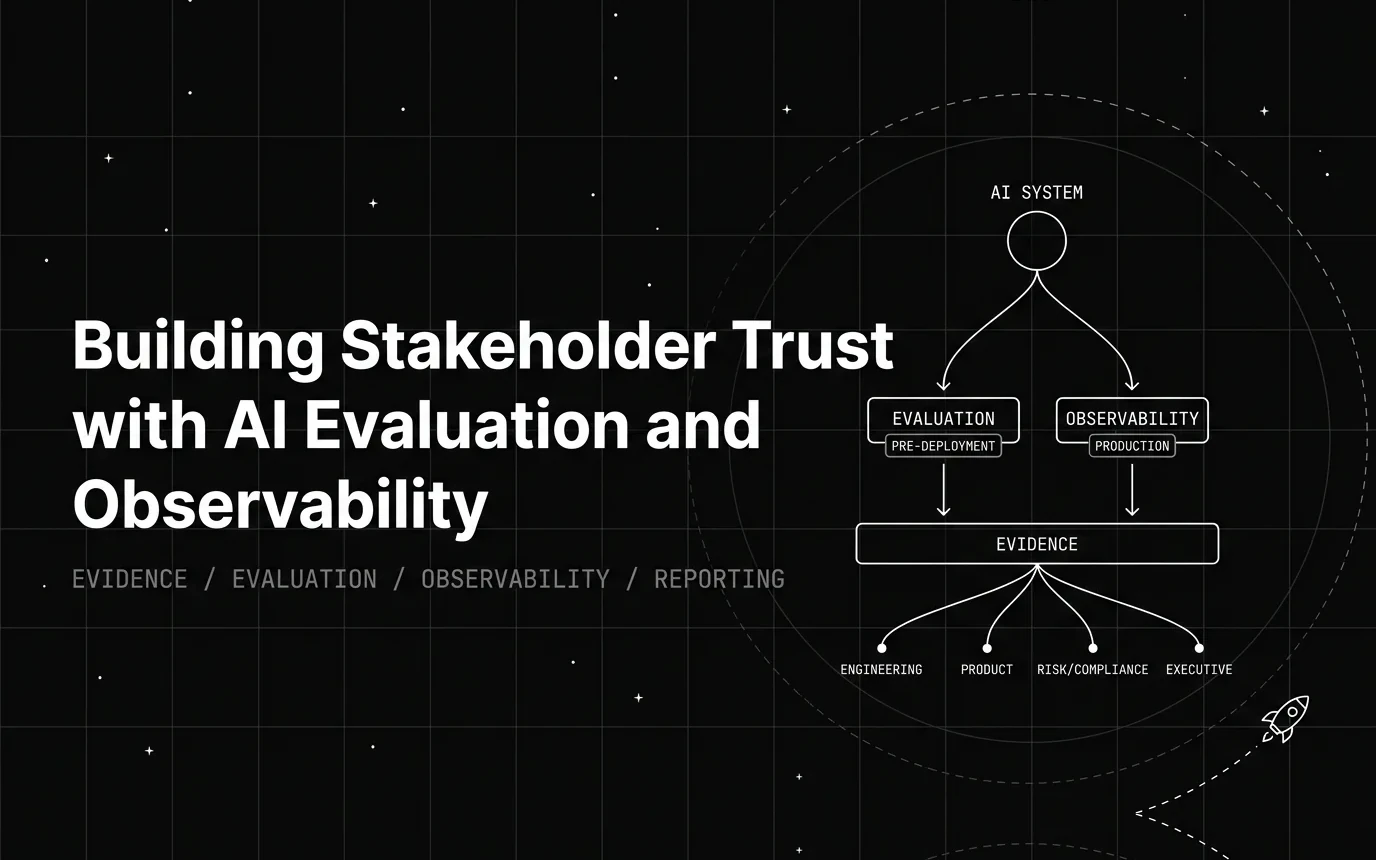
Table of Contents
TL;DR: The Four Complaints Behind “We Don’t Trust the AI”
AI evaluation reporting is how you turn evaluation and observability data into evidence each stakeholder group can check for itself. When leadership says it does not trust the AI, the complaint is almost always one of the four below.
| The complaint | What it actually means | The evidence that fixes it |
|---|---|---|
| No visibility | Nobody outside the team that built it can explain what the system is doing | Trace every production call, and give non-engineers a readable per-interaction view |
| Inconsistent results | Clean in the demo, unpredictable once real traffic hits it | A fixed, versioned eval set run on every material change, not just at launch |
| No accountability trail | Nobody can reconstruct why the system produced one specific output | Versioned eval history tied to each release, plus the trace behind the interaction |
| No early warning | Problems arrive as customer complaints instead of internal alerts | Failure clustering on live traffic, with alerts before the pattern reaches support |
None of the four is fixed by raising the accuracy number. Each is fixed by putting evidence where a non-engineer can check it, on a cadence that doesn’t change between reports.
This page owns who sees what, how often, and what happens the week after an incident. Four neighbouring Future AGI pages own the adjacent jobs: AI Audit Checklist maps audit requirements to the systems that already record them, Observability vs Monitoring covers the mechanical difference between the two, The Eval ROI Business Case covers the spreadsheet a CFO asks for, and Inside Observe walks the six production observability surfaces themselves.
Why AI Projects Stall Even When the Model Works
Technical teams watch their evals pass and assume the hard part is done. Leadership still hesitates to expand funding or roll the system out further, and the gap between those two positions comes down to trust, not technical performance.
The arithmetic behind that hesitation is simple. A step that succeeds 95% of the time succeeds end to end only 60% of the time across a ten-step workflow, because 0.95 to the tenth power is 0.599. No industry study is needed to make that point; it is just what compounding does to a chain of steps.
Reliability at the step level doesn’t guarantee reliability at the workflow level, and leadership feels that gap before anyone names it. It’s also why we read frameworks like the NIST AI Risk Management Framework, which frames trustworthiness as something to incorporate across a system’s design, development, use, and evaluation, as a continuous practice rather than a launch-day checkbox.
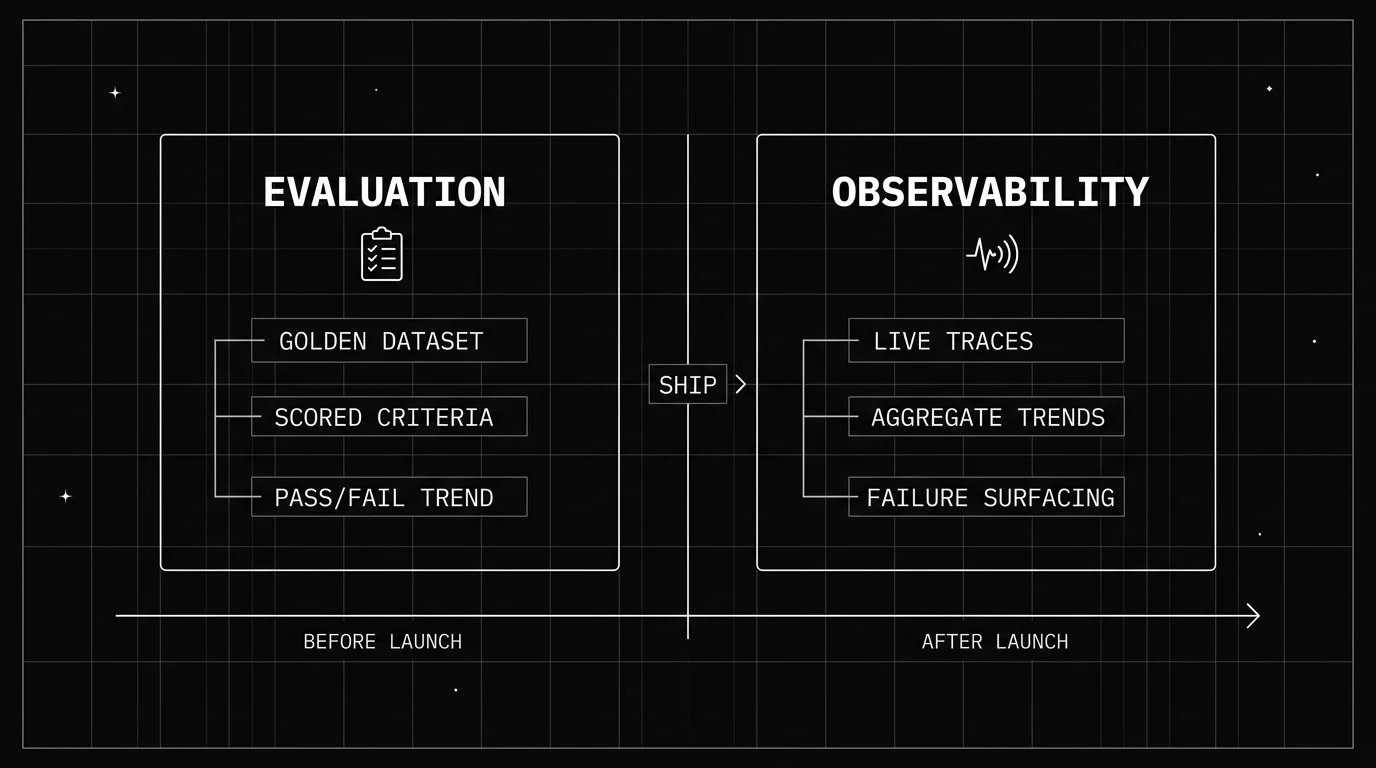
Evaluation proves the AI works before it ships. Observability proves it keeps working after it ships. Stakeholder trust in AI requires both to be visible, not just present somewhere in a dashboard nobody outside engineering opens.
Four groups show up repeatedly in this conversation: engineering, product, risk and compliance, and executive leadership. Each one asks a different question about the same system, and each one needs a different kind of evidence to answer it. A fifth, the support team fielding the complaint, needs something narrower again: the trace behind one specific interaction.
The gap is structural, sitting between how a system is tested and how a business decision about that system actually gets made, and better slides won’t close it. What closes it is evidence stakeholders can check for themselves, rather than a better summary of evidence they can’t see.
What “Trust” Actually Means to Different Stakeholders
Trust is not one thing. An engineer trusts a system by reading its error rate and latency; a CFO trusts it by seeing a cost and risk trend that doesn’t spike without warning. Treating “trust” as a single number to fix misses that the underlying complaints usually come from four distinct failure modes.
The first is no visibility: the system behaves like a black box, and nobody outside the team that built it can explain what it’s doing. The second is inconsistent results: it works cleanly in a demo, then fails in ways nobody predicted once real traffic hits it.
The third is no accountability trail: when something goes wrong, no one can reconstruct why the system produced that specific output. The fourth is no early warning: problems surface through customer complaints instead of internal alerts, which means the team is always reacting instead of catching issues first.
Leadership complaints that “AI doesn’t feel trustworthy” almost always trace back to one of these four, not to the raw accuracy number sitting in an engineering dashboard. Fixing accuracy without fixing visibility, consistency, accountability, or early warning leaves the trust gap exactly where it started.
The Trust Gap Between Engineering and Leadership
Engineering teams often present metrics that don’t map to the risk questions leadership is actually asking. Leadership wants to know what happens if the system is wrong for a customer, who’s accountable when it is, and whether the team can prove due diligence to a regulator if asked.
An eval dashboard reading “94% pass rate” answers none of those questions directly. A leadership-framed version of the same data reads differently: “94% of responses met the accuracy bar; the 6% failures were concentrated in refund-policy questions, and that category is now guarded against.” Same underlying number, translated into language that answers the question actually being asked.
| Stakeholder | Primary question they’re asking | Metric/signal that answers it | Where it should show up |
|---|---|---|---|
| Engineering lead | Is the system regressing release over release? | Eval pass-rate trend by category, trace-level error logs | Weekly engineering dashboard |
| Product manager | Is the feature actually solving the user’s task? | Task success rate, human escalation rate | Monthly product review |
| Risk/compliance officer | Can we show due diligence if audited? | Pass/fail rate on policy-sensitive eval sets, audit trail of changes | Periodic compliance report, not a live dashboard |
| Executive sponsor/CFO | Is this worth the spend, and is risk contained? | Headline pass-rate trend, cost-per-interaction, notable incidents | Quarterly executive summary |
| Support/CS team | What do I tell a customer when the AI got it wrong? | Trace view of the specific interaction, human reviewer note | Case-level trace lookup |
The risk/compliance row is the one teams underbuild most often, and it’s also where this piece differs most from generic evaluation-and-observability advice. A pass-rate dashboard doesn’t answer “can we show due diligence,” but a versioned eval history tied to each release is the kind of evidence that supports, without being required by, governance frameworks like ISO/IEC 42001 or the NIST AI RMF referenced above.
Evaluation Is the Evidence Base for Trust
Evaluation is structured testing of AI outputs against defined criteria, run before and after deployment, so it’s an ongoing practice rather than a one-time model comparison a team ran during procurement and never revisited.
Two evaluation moments matter for trust. Pre-deployment evaluation asks whether the system meets the bar before it ships. Regression testing asks whether a prompt, model, or data change breaks something that used to work. Both moments produce the evidence stakeholders actually rely on, and skipping either one leaves a gap someone will eventually find in production.
Criteria for stakeholder-facing evidence should cover more than task accuracy. Policy and safety adherence, consistency across similar inputs, and human-reviewed spot checks all belong in the mix, not just automated scoring alone.
A raw eval score means nothing to leadership without a baseline and a trend line attached to it. A single 92% score is a snapshot; 92% moving to 89% and back up to 94% across three releases is evidence of something happening.
Building an Evaluation Set Leadership Can Understand
A golden dataset is a fixed, versioned set of representative real-world cases used to test every change, so results stay comparable release over release. Without versioning, a team can’t tell whether a score moved because the system changed or because the test set quietly changed underneath it. For teams that need to expand a thin dataset without waiting on more production traffic, see Synthetic Test Data for LLM Evaluation.
Group eval cases by business-relevant categories, like “billing questions” or “safety-sensitive requests,” rather than only technical categories. That mapping is what lets a compliance officer or product manager read a result without needing an engineering translation layer first.
Include known-hard and edge cases specifically so failures surface before customers see them, and review that list with non-engineering stakeholders periodically so it doesn’t drift from what the business actually cares about.
This review habit is worth protecting even when nothing has gone wrong recently. A dataset that hasn’t been revisited in two quarters usually reflects last year’s product, not the one currently shipping, and stakeholders eventually notice the mismatch before the team does.
Observability Is the Evidence Base for What Happens After Launch
Observability is continuous visibility into live production behavior: traces, latency, and failure patterns as they happen. Evaluation is point-in-time testing; observability is what’s watching the system every hour it’s actually running.
Three layers matter to stakeholders here. Request-level traces show what happened in a single interaction. Aggregate trends show whether quality is drifting over time, not just holding steady on average. Failure surfacing shows whether new failure patterns are emerging that the original eval set never anticipated.
Observability is what lets a team say “we caught this before it became a pattern,” instead of “a customer complained, and we investigated afterward.” That distinction is the difference between a team that looks in control of its system and one that’s perpetually one step behind it.
For a fuller breakdown of how observability and monitoring differ mechanically, not just in framing, see Observability vs Monitoring: What the Difference Means for AI Agents.
Turning Raw Traces into Stakeholder-Readable Views
Raw JSON traces are unreadable to almost everyone outside engineering. Translating them into domain-specific summaries, like “this conversation resolved a billing dispute in three turns,” instead of a token-by-token log, lets non-technical reviewers actually audit specific interactions.
A useful trace view shows input, output, eval score, and a human reviewer note side by side, so a reviewer isn’t reconstructing context from scratch each time. This is typically where risk and compliance stakeholders spend their review time, distinct from the aggregate dashboards executives glance at once a quarter.
| Question | Answered by evaluation | Answered by observability |
|---|---|---|
| Does this change make the system better or worse? | Regression eval run against the golden dataset | Not directly, this is evaluation’s job |
| Is this specific customer interaction trustworthy? | Not directly, evaluation runs before this interaction happened | Live trace review, plus any real-time guardrail alert |
| Are we drifting over time? | Trend across successive eval runs | Aggregate quality-trend dashboard over live traffic |
| Can we prove due diligence to a regulator or auditor? | Versioned eval history tied to each release | Audit log of production behavior and incident response |
| How fast can we detect a new failure mode? | Not applicable until it’s added to the eval set | Error surfacing and alerting in production |
What to Show Leadership: An AI Evaluation Reporting Cadence
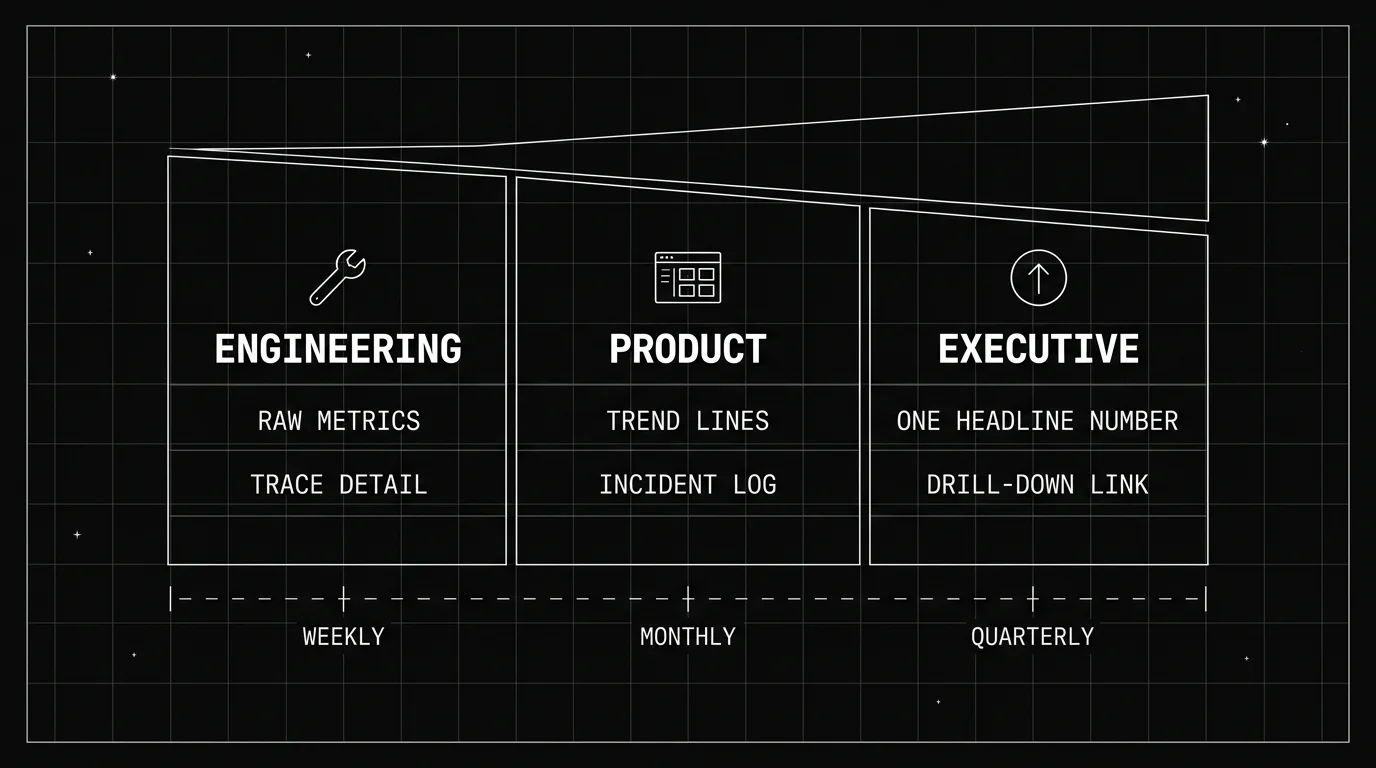
Match reporting depth to audience. Weekly engineering reviews carry raw pass-rate trends by category and open trace-level issues. Monthly product and cross-functional reviews carry task success rate, notable failure clusters, and what changed since the last review. Quarterly executive summaries carry the headline trend, cost, and incidents, without the underlying mechanics.
Leave raw trace logs, token-level metrics, and model architecture detail out of the executive report entirely. Keep the pass/fail trend, cost-per-resolution or cost-per-interaction trend, notable incidents and how they were caught and fixed, and any upcoming risk areas the team is already tracking. Executives don’t need the wiring; they need to know it’s being watched.
Consistency matters more than it looks like it should. The same core metrics have to appear release over release for a trend line to mean anything, rather than switching what’s measured every cycle and forcing leadership to relearn the dashboard each quarter.
How Do You Rebuild Trust After an AI System Fails in Production?
Rebuild trust by detecting the failure fast, containing it, finding the root cause, and reporting the fix transparently within days, not weeks. The sequence matters more than the polish of the writeup that follows it.
Detect the failure through observability, since that’s the layer actually watching live traffic. Contain it with a runtime guardrail or a rollback so the failure stops affecting new users while the team investigates. A guardrail is the faster of the two: an inline scanner set to block or flag the specific failure pattern stops it at the boundary without waiting on a deploy.
Find the root cause through trace review, then update the eval set so this specific failure becomes a permanent regression test rather than a one-off fire drill. Communicate what leadership needs to hear within 24 to 48 hours, before the story gets reconstructed secondhand.
The trust rebuild has less to do with the failure itself and more to do with visibly showing it was caught fast and turned into something that can’t recur silently. A post-incident summary to leadership should cover what happened, how it was caught, roughly how many users were affected, and what changed to prevent recurrence.
Leave a specific affected-user figure out unless the team actually has one confirmed; a placeholder framed honestly beats a number nobody can back up.
Do Executives Actually Need to Understand AI Evaluation Metrics?
No, executives don’t need to understand scoring methodology, but they do need a consistent, trusted proxy metric they can track the same way they track any other business KPI. A pass-rate trend or a defined “trust score” works, as long as it’s stable release over release.
The risk of over-simplifying runs the other direction, though. A single vague “AI health” number with no drill-down path erodes trust faster than granular detail would, because nobody can interrogate it when something eventually goes wrong. A number nobody can question isn’t reassuring, it’s just untested.
The middle path works better: one headline number per report, with a documented drill-down path linking to the underlying eval set or trace view for anyone who wants to verify it. That structure gives executives a KPI to track without asking them to become evaluation engineers.
Common Mistakes That Undermine Stakeholder Trust
Four mistakes show up repeatedly across teams trying to build this reporting habit, and each one has a fairly direct fix. None of them require new tooling to solve, mostly discipline about what gets measured and how consistently it gets shown.
Reporting vanity metrics, like uptime or latency alone with no quality signal, hides the thing stakeholders actually care about. Fix: pair every operational metric with at least one quality metric in the same report.
Changing what’s measured between reports breaks the trend line stakeholders need to trust the data. Fix: freeze the core metric set for at least one full quarter before revising it.
Only reporting good news and surfacing failures reactively teaches stakeholders to distrust every report that looks too clean. Fix: include a “what went wrong and what we caught” line in every cadence, even in a quiet quarter.
Treating evaluation as a one-time launch gate instead of an ongoing practice lets quality drift silently after launch. Fix: schedule regression evals on every material change, not just before the initial ship date.
How Future AGI Produces Each Piece of This Evidence
Evaluate is the pre-launch evidence base. It ships 50+ built-in evaluators covering accuracy, policy adherence, and safety, alongside LLM-as-judge scoring and custom evals you define for your own business categories. Many of them score without a reference answer, which is what makes running the same golden dataset on every release practical rather than aspirational. Annotation queues let a domain expert calibrate the judge against human labels, so the “94% pass rate” a compliance officer reads is anchored to a human standard rather than to a model’s unaudited opinion.
Observe is the post-launch evidence base. traceAI, Future AGI’s open-source OpenTelemetry tracing library, captures every production call as a span tree across 30+ framework integrations, so the case-level trace lookup in the persona table above is a link rather than a support escalation.
The Error Feed is the early-warning layer, and it is the piece that maps to the fourth complaint in the TL;DR. It reads a sample of production traces, classifies each failure against a 30+ error taxonomy with the evidence that triggered it, and groups traces sharing a failure signature into a single scored issue rather than a wall of individual errors. A new failure pattern arrives as one named issue instead of a customer complaint, and it can be fed straight back into an evaluation dataset as the permanent regression test the playbook above calls for.
Protect is the containment step in the incident playbook. It runs 28 inline checks, 10 first-party and 18 provider-backed, covering data privacy, prompt injection, toxicity, tool permissions, and MCP security, with each rule set to enforce, monitor, or log. That is what lets a team stop a specific failure pattern at the boundary in minutes rather than waiting on a rollback.
Because all four run against the same traces and the same eval history, a compliance officer, a product manager, and an engineer can read the same evidence without a translation step in between. That is the whole point: removing the translation layer is what closes the trust gap, not producing a better summary of evidence nobody else can open.
Future AGI is open source. You can sign up for free and run it as a hosted platform, or deploy the Agent Command Center on your own Docker, Kubernetes, or air-gapped infrastructure, so a team under data-residency constraints runs this whole evidence layer inside its own network. For what audit-ready evidence looks like day to day, see AI Audit Checklist: The Evaluation Evidence Your Stack Should Already Produce.
Which Habit Actually Rebuilds Stakeholder Trust in AI?
Stakeholder trust in AI isn’t earned by a single accuracy number. It’s earned by consistently showing evidence before launch through evaluation and after launch through observability, translated into language each stakeholder group actually uses instead of one engineering-only dashboard.
The practical starting point is small: pick one shared metric set, report it consistently, and give every stakeholder a drill-down path into the underlying evidence behind it. Teams that skip this step end up re-explaining the same accuracy number in four different meetings, in four different formats, convincing nobody fully.
Start this week. Take the four complaints in the TL;DR table, write down which system in your stack currently produces evidence for each one, and fix the row that’s empty. That list is usually shorter than teams expect, and the empty row is almost always the one leadership has been quietly worried about.
Frequently Asked Questions
How is AI observability different from AI evaluation?
What metrics should I show executives about AI reliability?
How do you rebuild trust after an AI system fails in production?
Why don't accuracy metrics alone build stakeholder trust in AI?
How often should AI evaluation results be reported to leadership?
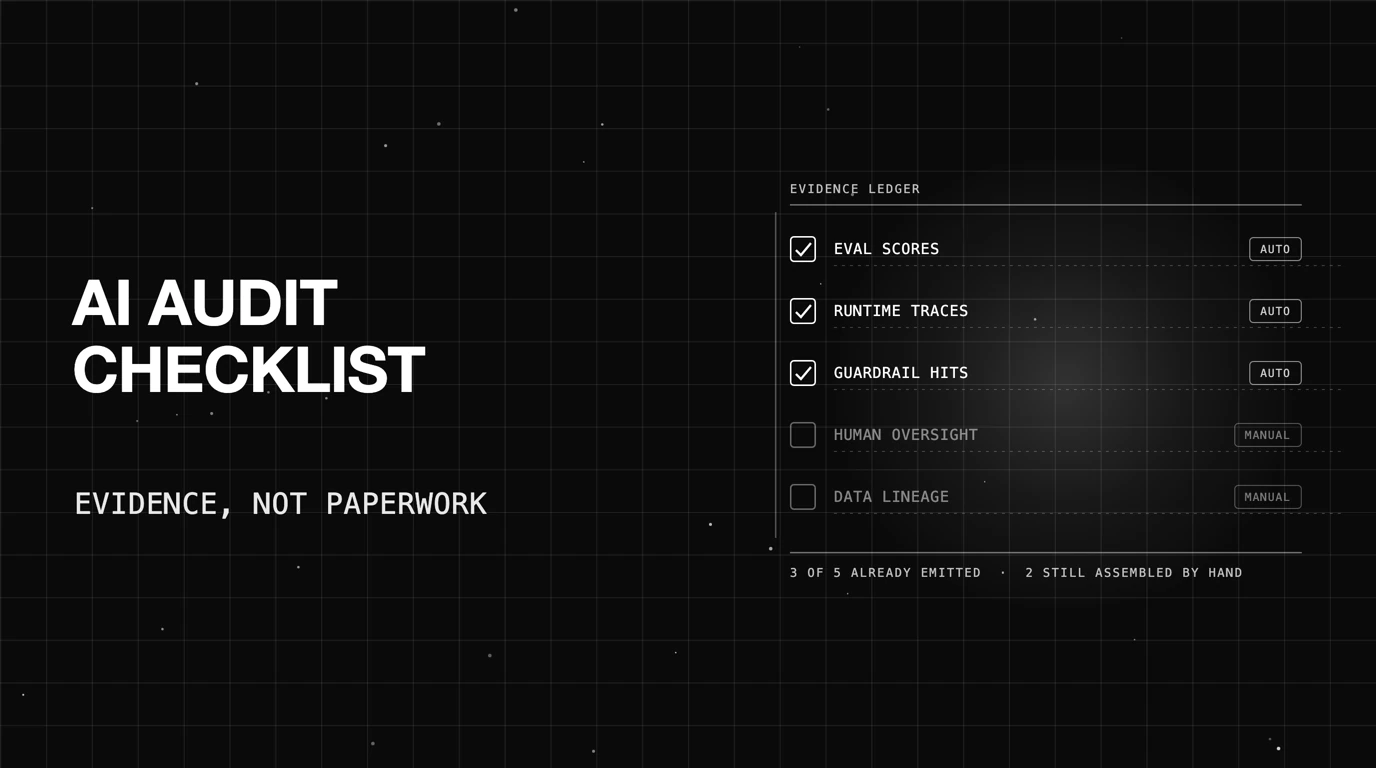
Most audit prep is a scramble to reconstruct what happened. Map each requirement to a system that already records it, then automate the two or three that are left.

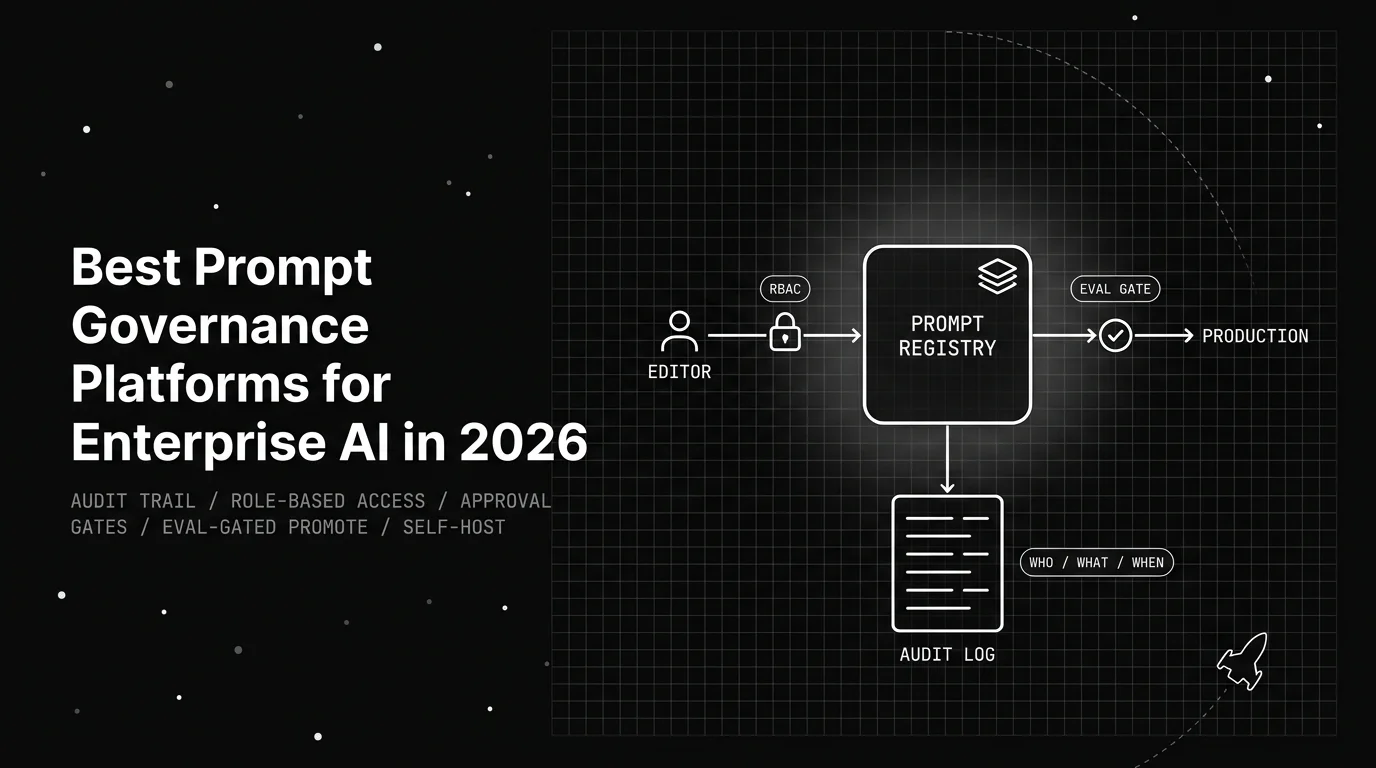
The 6 best prompt governance platforms for enterprise AI in 2026, ranked on access control, audit logs, approval workflows, and clear policy enforcement.
Five AI observability tools compared for legal research, contract review, e-discovery. ABA Rules 1.1/1.6, Mata v. Avianca, FRCP 26(g).