What is LLM Product Analytics? A 2026 Guide
LLM product analytics: how teams join trace data to product funnels, retention, satisfaction. Tools, anatomy, mistakes, where the category is going.
Table of Contents
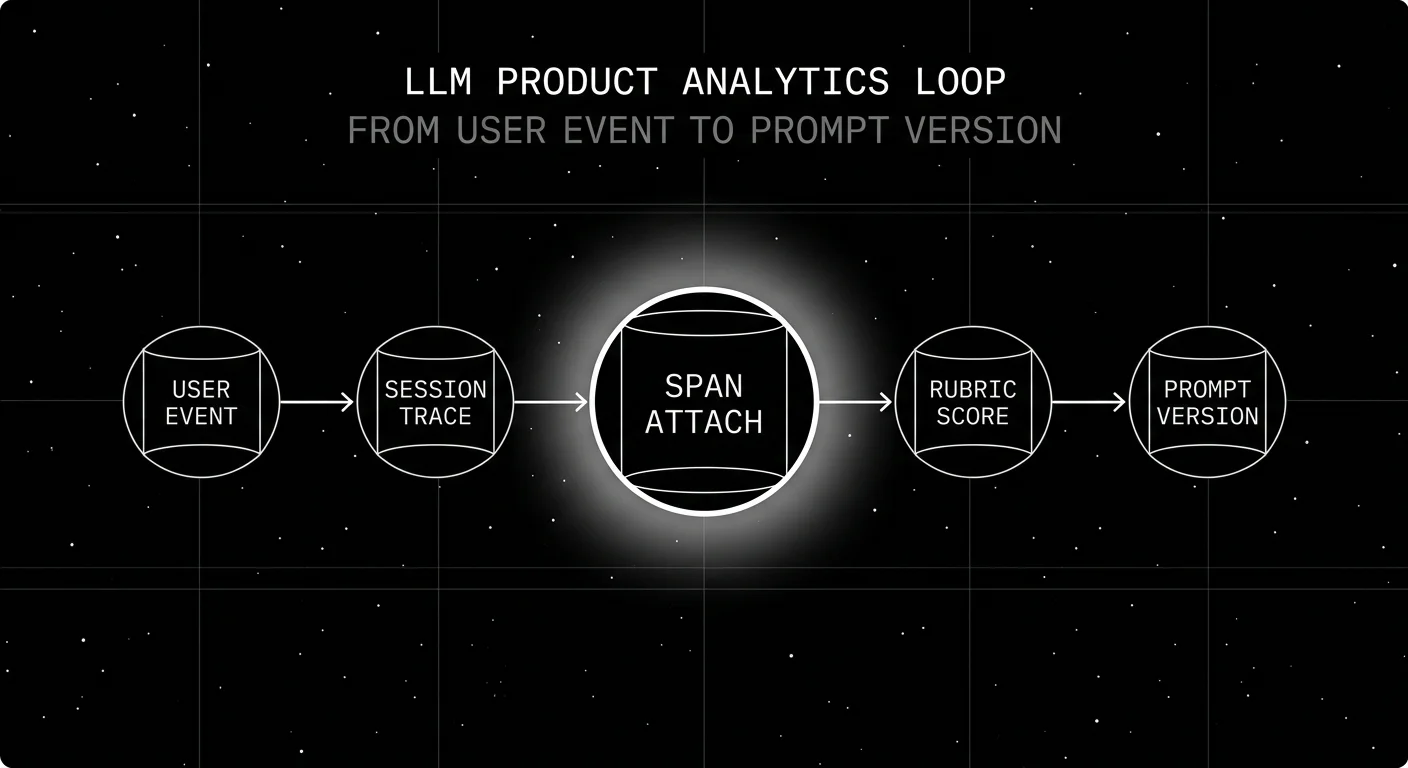
A product team rolls out a new refund agent prompt on a Tuesday. By Friday, the eval dashboard says groundedness is up 4 percent and the cost dashboard says token spend is flat. The product analytics dashboard, separately, says refund task completion is down 9 percent on /refund. Nobody connects the dots until Monday because the eval dashboard and the product dashboard are two different tools, with two different teams looking at them. The fix in 2026 is not a third dashboard. It is the join: every span carries the prompt version, every product event carries the trace id, and the funnel-by-prompt-version cut is one query.
This is what LLM product analytics solves. The category sits at the intersection of LLM observability (traces, judges, prompts) and product analytics (funnels, retention, replay). Without the join, you ship a prompt that improves quality on paper and tanks conversion in practice, and nobody catches it until the weekly business review.
TL;DR: LLM product analytics in one paragraph
LLM product analytics is the practice of joining product behavior signals (sessions, funnels, retention, conversion, replay) to LLM-specific signals (prompts, models, judge scores, feedback) so that questions about user outcomes and questions about model behavior live on the same dashboard. The minimum viable version is two columns of data (trace_id, session_id) joined in SQL. The mature version is a platform that ingests both and treats them as one event stream.
Why LLM product analytics matters in 2026
Three pressures pushed product analytics for LLM apps from “nice to have” to “table stakes” by 2026.
Prompt cadence outpaces model cadence. A typical 2026 production team updates prompts weekly and the underlying model every 3-6 months. Each prompt change can move task completion, refund rate, or retention. Without per-prompt-version analytics, the team is shipping changes blind.
Model substitution decisions are now product decisions. Switching the user-facing generation model from a frontier (GPT-5.5, Claude Opus 4.7) to a smaller default (gpt-5-nano, Claude Haiku 4.5, Llama 4 Scout) saves cost but can move task completion in either direction. Switching the eval-side judge from a frontier model to a specialized eval model (turing_flash, Galileo Luna 2) reduces eval cost and latency but shifts score calibration. Both decisions are product decisions, and both require product analytics tied to model variant.
Agent products broke the click-funnel model. A traditional funnel is page A then page B then conversion. An agent funnel is multi-step: dispatch, retrieve, act, evaluate, retry, escalate. Tools built for the click funnel struggle. The category needed analytics that treat tool calls, retries, and escalations as first-class events.
The five signal categories
A working LLM product analytics implementation captures all five:
- Behavioral signals. Clicks, sessions, paths, abandonments. The product-analytics base layer.
- Outcome signals. Conversion, task completion, escalation, refund. The “did the user finish” signal.
- Quality signals. Judge scores, eval results, refusal rate, latency, hallucination rate. The “how well did the LLM perform” signal.
- User feedback. Thumbs, star ratings, comments, retry rate, regenerate-clicks, copy-paste rate. The “did the user approve” signal.
- Cohort signals. User segment, plan tier, geography, model variant, prompt version. The slicing dimension that makes everything else useful.
The join key matters more than the storage. session_id and trace_id must be present on every event in both worlds. Without the join, you have two dashboards. With it, you have one.
How LLM product analytics is implemented in 2026
Two paths show up on most procurement shortlists.
Path 1: Product analytics first
Pick PostHog, Mixpanel, or Amplitude as the home dashboard. Capture LLM events as custom events. Join trace data via session_id. The advantage is product teams already know the tool. The cost is that LLM-specific surfaces (prompt versions, judge scores, span trees) are second-class.
- PostHog. Self-hostable; the posthog-foss mirror is MIT-licensed (the main repo includes some non-OSS components). Autocapture, session replay, LLM analytics, feature flags, A/B testing. Product Analytics: 1M events/month free; LLM Analytics: 100K events/month free.
- Mixpanel. Closed, strong funnel and retention reports, no first-party LLM surface but easy to bolt on with custom events.
- Amplitude. Closed, strong cohort and behavioral analysis, similar story to Mixpanel for LLM.
Path 2: LLMOps first
Pick FutureAGI, LangSmith, Langfuse, or Phoenix as the home dashboard. Build product-analytics queries on top of trace data. The advantage is LLM-specific surfaces are first-class. The cost is funnel and retention reports require more SQL than a product-analytics tool gives you out of the box.
- FutureAGI. Apache 2.0, ClickHouse-backed traces, span-attached scores, feedback API joined to trace ids, custom dashboards via SQL.
- LangSmith. Closed platform, runs and feedback API, dataset linkage, per-cohort experiments. Fits LangChain runtimes.
- Langfuse. MIT core, score API, sessions in the UI, prompt-version-to-trace linkage.
- Phoenix. ELv2, OTel-native, dataset eval over annotated rows, Arize AX is the paid tier.
Hybrid
Most production teams in 2026 run both. Product analytics owns the funnel; LLMOps owns the trace tree; the join is a session_id key. The hybrid is the right answer when the product team owns one budget and the platform team owns another, which is most teams.
Common mistakes when implementing LLM product analytics
- Capturing only LLM signals. A platform team that ships an eval dashboard without product context cannot defend a prompt rollback against the product team’s funnel objection.
- Capturing only product signals. A product team that ships a funnel dashboard without LLM context cannot diagnose why conversion dropped on a specific prompt rollout.
- Sampling independently. Most product analytics tools sample sessions; most observability tools sample traces. If the two sample on different keys, the join breaks. Use the same join key (session_id or user_id) and sample in lock-step or not at all on the joined cohorts.
- Tracking session_id but not prompt_version_id. Without the prompt_version, you cannot do funnel-by-prompt cuts. Tag every span with the prompt id at ingestion time.
- Treating LLM analytics as a separate dashboard project. The value is the join. A second dashboard owned by a different team often delays the join indefinitely.
- Ignoring tool-call and retry events. Click funnels miss the agent dynamics. Capture tool-call success rate, retry count, escalation rate as first-class events.
- No replay for LLM sessions. Session replay (PostHog Replay, Mixpanel Replay, FullStory) is dramatically more valuable on agent products than on traditional UIs because the conversation is the product.
The future of LLM product analytics
Three trends shape the next 18 months.
OTel GenAI semantic conventions keep maturing. The spec is still in Development status, but adoption keeps growing. Use current standard attributes (gen_ai.request.model, gen_ai.response.model, gen_ai.usage.input_tokens, gen_ai.usage.output_tokens); keep prompt version in a vendor or app-specific attribute until a stable convention exists. Cross-vendor product-analytics ingestion of LLM trace attributes becomes easier as more vendors emit OTel-compatible spans.
Span-attached judge scores on every span. Distilled judges (Galileo Luna 2, FutureAGI Turing-Flash, Patronus Lynx) are cheap enough to score at 100 percent of traffic. The funnel-by-quality cut becomes real, not just sampled.
Multi-step agent funnels become first-class. Click funnels are 1996 product analytics. Agent funnels (with dispatch, retrieve, act, evaluate, retry, escalate as ordered steps) are the 2026 frontier. The tools that handle agent funnels natively (FutureAGI, LangSmith Fleet, Langfuse sessions, PostHog with custom event modeling) lead.
How LLM product analytics differs from a few related categories
| Category | What it answers | Where the join lives |
|---|---|---|
| LLM product analytics | Did users convert / retain / succeed | session_id, trace_id, prompt_version |
| LLM observability | Is the system healthy and fast | trace_id, span_id, model |
| LLM evaluation | Are outputs accurate and grounded | dataset_id, judge_id, prompt |
| Product analytics (general) | Did users convert / retain | session_id, user_id |
LLM product analytics is the intersection of all four. The platforms that survive in 2026 are the ones that ingest from all four event streams and join them on shared keys. For the deeper split between LLM eval and product analytics as two layers of one loop, the join key is what ties them together.
How to use this with FAGI
FutureAGI is the production-grade LLM product analytics stack from the LLMOps side. ClickHouse-backed traces, turing_flash running guardrail screening at 50 to 70 ms p95 inline plus full eval templates at about 1 to 2 seconds for sampled deeper rubric scoring, a feedback API joined to trace ids, custom dashboards via SQL, and multi-step agent funnels with dispatch, retrieve, act, evaluate, retry, escalate as ordered steps. Funnel-by-quality becomes a real cut: guardrail-style verdicts ride on production traffic, sampled rubric scores deepen the cohort analysis, and every conversion event carries a session id, so the join produces “users who saw groundedness above 0.85 converted at X%” out of the box.
The Agent Command Center is where dashboards, agent funnels, and feedback-to-trace joins live. The same plane carries 50+ eval metrics, persona-driven simulation, the BYOK gateway across 20+ providers via six native adapters (OpenAI, Anthropic, Gemini, Bedrock, Cohere, Azure) plus OpenAI-compatible presets and self-hosted backends, 18+ guardrails, and Apache 2.0 traceAI instrumentation on one self-hostable surface. Free tier covers most pre-production and small-production workloads; usage-based billing kicks in at scale. Compliance and enterprise add-ons are clearly priced (pricing). Pair with PostHog or Mixpanel for the product-funnel side; FutureAGI is the LLM side of the join.
Sources
- PostHog AI engineering observability
- PostHog pricing
- Mixpanel docs
- FutureAGI pricing
- FutureAGI GitHub repo
- traceAI GitHub repo
- LangSmith docs
- Langfuse docs
- Phoenix docs
- OpenTelemetry GenAI semantic conventions
- PostHog session replay
- Trubrics SDK
- Mixpanel for AI
Series cross-link
Read next: Best LLM Feedback Collection Tools 2026, What is LLM Annotation?, LLM Observability Platform Buyer’s Guide 2026
Frequently asked questions
What is LLM product analytics?
How is LLM product analytics different from LLM observability?
What signals does LLM product analytics capture?
Which tools cover LLM product analytics in 2026?
Why does LLM product analytics matter in 2026?
What is a trace-funnel join?
What are common mistakes when implementing LLM product analytics?
Where is LLM product analytics headed?
FutureAGI closes the self-improving loop for AI product teams; Langfuse, Mixpanel, Amplitude, LangSmith, and Helicone each ship a slice. 2026 picks.

LangChain explained for 2026: what changed in v1, how LangGraph fits in, the real anatomy of the framework, production tradeoffs, and common mistakes.

Best LLM feedback collection tools in 2026, judged on the closed loop from thumbs to evaluator calibration to CI gate. 6 platforms compared, FAGI included.