What is LLM Monitoring? Alerts, SLOs, Dashboards in 2026
LLM monitoring is the alerting and dashboard layer on top of observability. Latency, cost, eval pass-rate, drift, and anomaly alerts in 2026.
Table of Contents
A user asks your support agent a question. The reply is correct, polite, and short. APM says p95 latency is 1.4 seconds and zero errors across the day. Now look at the eval pass-rate over the last week. It dropped from 94% to 81% the day after Tuesday’s prompt rollout. Latency monitoring did not catch it because it never broke latency. Error monitoring did not catch it because there were no exceptions. Quality monitoring caught it. That is what LLM monitoring is for. This is the entry-point explainer; the deeper tutorials are linked below.
If you want depth, read these next:
- What is LLM Observability and Monitoring? for the deeper tutorial
- What is LLM Observability? for the OTel and span layer
- Best LLM Monitoring Tools in 2026 for the platform landscape
TL;DR: What LLM monitoring is
LLM monitoring is the alerting and dashboard layer that watches trends in your LLM application’s behavior over time. Five surfaces matter in 2026: latency p95/p99, daily token cost, eval pass-rate trend, drift on inputs/outputs/retrieval/eval-scores, and anomaly detection on failure rates. Monitoring sits on top of observability; observability captures every span, monitoring watches the aggregates and pages someone when they break. By 2026, the question is not whether to monitor; it is which surfaces matter for your workload and which platform handles them well.
Why LLM monitoring matters in 2026
Three changes made monitoring operational, not optional.
First, model providers stopped being stable. A weight update at the provider rolled out without notice changes outputs in subtle ways. Latency monitoring will not catch a 5-point Faithfulness drop. Eval pass-rate trend monitoring will. Production teams now treat the model as a moving target.
Second, cost stopped being a footnote. A reasoning model burning 40K output tokens at $15 per 1M tokens turns a single request into 60 cents. A model substitution that drops the user-visible answer quality by 30% but cuts cost by 90% is a regression you only catch by monitoring both axes together.
Third, agent loops stopped being free. An agent that calls one extra tool per request adds latency, cost, and failure surface. Without monitoring at the session level, the regression looks like noise.
The transport caught up in parallel. The OpenTelemetry GenAI semantic conventions standardized span attributes for LLM calls. Eval score events nest naturally inside the trace tree. Monitoring tools read against this standardized stream and surface trends, anomalies, and SLO breaches.
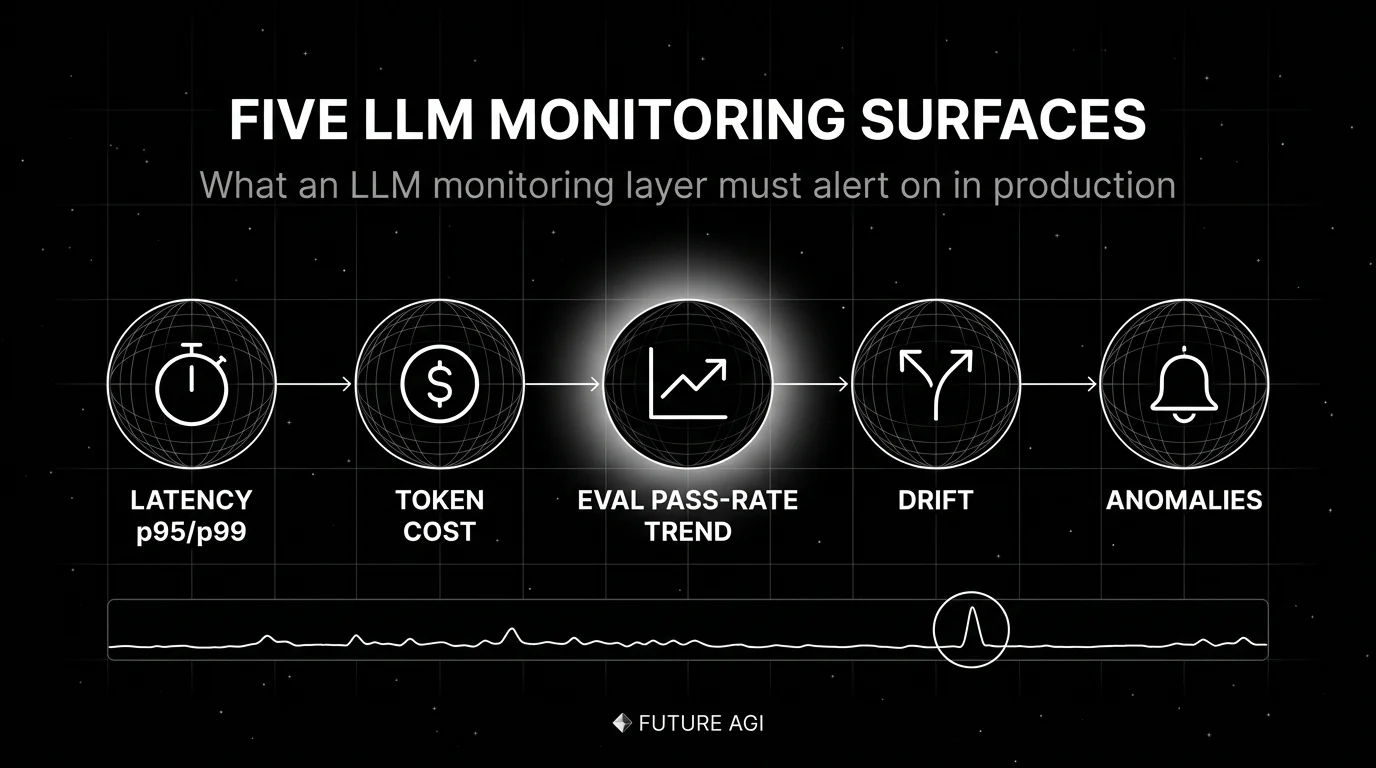
The five surfaces of LLM monitoring
A working LLM monitoring layer covers five surfaces. Anything less and you ship blind to a real class of regressions.
1. Latency p50/p95/p99
The minimum bar. Per-route, per-model latency timelines, with breakdowns by streaming first-chunk vs full completion. Reasoning models and agent loops hide in the tail; p99 is where the budget breaks. Latency budgets per session matter for chat and voice; per-call latency matters for autocomplete.
2. Token cost
Daily spend per provider, per model, per user segment, per feature. Forecast vs actual. Per-route budget. Substitution alerts catch silent regressions like swapping gpt-4o for gpt-3.5 (cost dropped 90%, quality dropped 40%). Cache-hit-rate matters when prompt caching is in play; reasoning-token attribution matters for o-series and Claude-extended-thinking workloads.
3. Eval pass-rate trend
The most important LLM-specific metric. Per-route eval pass rate over time. The leading indicator of quality regressions before user complaints. Track:
- Per-rubric pass rate (Faithfulness, Context Relevance, Refusal Rate, Toxicity)
- Per-prompt-version pass rate (catches regressions at rollout time)
- Per-model pass rate (catches silent provider drift)
Without eval pass-rate trend, latency dashboards say everything is fine while quality erodes.
4. Drift detection
Four kinds of drift matter for LLM workloads:
- Input drift. User prompt distribution shifts over time. Often caused by user-base changes, upstream feature changes, or new entry points routing different intent.
- Output drift. Model outputs drifting in length, format, or style. Often signals a silent provider weight update or a prompt rollout side effect.
- Retrieval drift. Top-k chunk similarity scores trending down, retrieval recall drop on a held-out query set, or the index itself drifting after a re-embed. Specific to RAG workloads but common enough to alert on.
- Quality drift. Eval scores trending down. The one APM cannot see. A drift detector sits on top of span-attached eval scores and alerts when the rolling mean drops, the variance spikes, or a specific scorer (citation grounding, factuality, refusal rate) shifts.
For depth on drift, see What is LLM Drift?.
5. Anomaly detection
Composite alerts that combine signals reduce false positives. Examples:
- “Eval pass-rate dropped AND token cost spiked”: likely a model substitution gone wrong.
- “Refusal rate spiked AND retrieval recall dropped”: likely an index update broke retrieval, the model now refuses to answer.
- “Tool call failure rate spiked AND p95 latency dropped”: likely a tool endpoint returns errors that the model gives up on quickly.
Suppress alerts during deploy windows. Group alerts by route or session. Route alerts by responsible team.
How LLM monitoring is implemented
Three integration points in 2026.
Telemetry source
Monitoring reads from spans. Spans come from OTel-native instrumentation libraries: OpenInference, traceAI, OpenLLMetry, or vendor SDKs. The spans carry gen_ai.* attributes that monitoring queries against. For depth, see Best OTel Instrumentation Tools for LLMs.
Online evaluators
Eval scores must attach to live spans for monitoring to catch quality drift. The pattern: a span captures the LLM call, a background scorer (heuristic, LLM-as-judge, schema validator, citation grounder, embedding similarity) writes a score event nested in the span. Monitoring queries the score stream alongside the span stream.
Backend
The backend stores spans and scores, supports time-series queries, surfaces dashboards, and triggers alerts. Six categories of backends matter in 2026:
- OSS LLM-native: FutureAGI (Apache 2.0), Langfuse (MIT core), Phoenix (ELv2).
- Closed LLM-native: Braintrust, LangSmith, Galileo.
- APM-native: Datadog LLM Observability, New Relic AI Monitoring.
- OSS gateway-first: Helicone (Apache 2.0, in maintenance mode).
- Generic OTel: Jaeger, Tempo, Grafana.
- Cloud-native: AWS CloudWatch, Google Cloud Monitoring.
For the full comparison, see Best LLM Monitoring Tools in 2026.
Common mistakes when implementing LLM monitoring
- Treating monitoring as logs with thresholds. Monitoring needs structure: per-route, per-prompt-version, per-model dashboards. Alerts on raw error counts produce noise. Alerts on per-route eval pass-rate produce signal.
- Latency-only dashboards. A latency-only dashboard says everything is fine while quality erodes. Always include eval pass-rate trend.
- Sampling too aggressively at the head. 1% uniform sampling hides the long-tail failures the dashboard was meant to surface. Use tail-based sampling at the OTel collector to keep all errors, all low-eval-score traces, all high-cost traces.
- No deploy-window suppression. Every deploy looks like an anomaly until the new traffic settles. Suppress during the rollout window.
- One alert channel for everything. Eval-score alerts for engineering, cost alerts for finance, drift alerts for ML platform, security alerts for security. One channel produces fatigue.
- Vendor defaults for thresholds. Vendor-default thresholds match the vendor’s median customer, not your service. Always baseline against your own production traffic before turning thresholds on.
- No SLO tied to user impact. A 99.9% latency SLO that does not match what the user feels is a vanity SLO. Pick metrics that map to user-visible failure.
- Forgetting cost alerts at the routing layer. A failed canary on a new model can spike cost 10x in an hour. Set per-day budget caps at the gateway, not just dashboards.
The future: where LLM monitoring is heading
A few directions are settled, others are emerging.
Span-attached evals as the default monitoring substrate. The shift is from “we monitor latency and run an eval suite at release” to “every production trace carries quality verdicts as it happens, monitored alongside latency.” The CI gate, the on-call alert, and the monitoring dashboard all consume the same score stream.
Cost monitoring at span granularity. Per-user, per-prompt, per-feature budgets that read the live trace stream and short a request when its budget is exhausted. The data is in the trace; the policy enforcement layer is what is missing in most stacks.
Drift that respects multimodality. Voice agents, image-input agents, and document-input agents produce drift signals that text-only monitors miss. Tools that ingest audio characteristics, image embeddings, and OCR confidence scores will pull ahead in multimodal workloads.
Agent-aware session monitoring. A flat span list buries the loop. Tools that render runs as actual graphs and surface session-level metrics (turn count, plan adherence, outcome score) will pull ahead in agent-heavy workloads.
Open instrumentation, vendor backend. This mirrors what happened in cloud-native. The win is open instrumentation at the SDK layer, with pluggable monitoring backends. OTel won the metrics and traces fight in cloud-native because instrumentation owners refused to maintain N parallel SDKs. The same logic is playing out for gen_ai.* attributes.
The throughline of all five: by 2026, “LLM monitoring” is no longer a separate category from “production AI.” It is the operational substrate. If you cannot watch the trends, alert on the drift, and tie the SLO to user impact, you are flying blind on a workload where being wrong is expensive.
How to use this with FAGI
FutureAGI is the production-grade LLM monitoring and observability stack. The platform ships span-attached online eval, rolling-mean monitoring, drift alerts on rubric scores, per-cohort comparison, agent-graph topology, and session-level monitoring on the same surface. turing_flash runs guardrail screening at 50 to 70 ms p95 so a sample of every production trace carries a quality verdict; full eval templates run at about 1 to 2 seconds for offline replay and CI gates. Alerts route by route, by prompt version, by cohort, with composite alert support (eval pass-rate AND token cost) to suppress noise.
The Agent Command Center is where alerts, dashboards, and policy live. The same plane carries 50+ eval metrics, persona-driven simulation, the BYOK gateway across 20+ providers via six native adapters (OpenAI, Anthropic, Gemini, Bedrock, Cohere, Azure) plus OpenAI-compatible presets and self-hosted backends, 18+ guardrails, and Apache 2.0 traceAI instrumentation on one self-hostable surface. Free + pay-as-you-go base; compliance (SOC 2, HIPAA BAA), SSO (OAuth, SAML + SCIM), and enterprise SLAs add on per tier (pricing).
Sources
- OpenTelemetry GenAI semantic conventions
- OpenInference GitHub repo
- traceAI GitHub repo
- OpenLLMetry GitHub repo
- Datadog LLM Observability docs
- FutureAGI pricing
- FutureAGI GitHub repo
- Langfuse pricing
- Phoenix docs
- Braintrust pricing
- LangSmith pricing
- Helicone pricing
- Helicone joining Mintlify
Series cross-link
Read next: What is LLM Observability and Monitoring?, What is LLM Observability?, Best LLM Monitoring Tools in 2026, What is LLM Drift?
Related reading
Frequently asked questions
What is LLM monitoring in plain terms?
How is LLM monitoring different from LLM observability?
What metrics matter for LLM monitoring in 2026?
Why does eval pass-rate trend matter more than latency?
What is a good SLO for an LLM application?
How do I avoid alert fatigue in LLM monitoring?
Can I monitor multi-turn agent sessions?
What does monitoring cost in 2026?
FutureAGI, Datadog, Langfuse, Phoenix, Helicone, Braintrust, LangSmith for LLM monitoring. Latency, drift, cost, eval pass-rate trends.

10-item production LLM monitoring checklist for 2026: OTel, eval gates, drift alerts, PII redaction, A/B rollback, runbooks. Vendor-neutral.
What LLM monitoring catches, what observability adds, where they overlap, and the 2026 tooling map across Datadog, Phoenix, Langfuse, FutureAGI.