LLMOps in 2026: How to Monitor, Optimize, and Secure LLMs for Speed, Accuracy, and Safety
Monitor, optimize, and secure LLMs in production in 2026. Three pillars of observability, ethical guardrails, root cause analysis, and the tools that ship.
Table of Contents
TL;DR: LLMOps in 2026
| Question | 2026 answer |
|---|---|
| What is LLMOps? | Production operations for LLMs: observability, evaluation, prompt and dataset versioning, guardrails, and cost controls. |
| Three pillars of observability | Metrics, logs, and traces, with sampled LLM-as-judge evaluations on top. |
| Biggest 2026 risk | Prompt injection (OWASP LLM01) and unbounded agent cost when fan-out is unchecked. |
| Latency budget for inline checks | Deterministic scanners under 100 ms, heavier judges async (turing_flash about 1 to 2 s, turing_large about 3 to 5 s). |
| Reference stack | Future AGI ai-evaluation, traceAI, Agent Command Center, plus Grafana or Datadog for dashboards. |
| Compliance | EU AI Act and NIST AI RMF Generative AI Profile both raise expectations on documented monitoring. |
Why LLMOps Has Become Essential for Production AI
In real-time applications, how can developers ensure that LLMs are accurate, efficient, and secure? In 2026, Large Language Model Operations (LLMOps) is the discipline for managing and continuously improving LLMs in production. Deploying, monitoring, maintaining, and updating LLMs all sit inside LLMOps, with extra attention to non-deterministic outputs, prompt sensitivity, and ongoing model and prompt updates. Organizations that want to optimize LLMs and minimize deployment risk now apply strong LLMOps practices end to end.
Challenges of LLMs in Production: Scale, Non-Determinism, and Continuous Updates
Deploying LLMs brings unique monitoring challenges.
- Massive scale. LLMs process vast volumes of data, requiring infrastructure that meets high throughput and low latency demands at the same time.
- Non-deterministic outputs. The same input can produce varying responses, making it harder to predict and control behaviour without rubric-based evaluation.
- Continuous updates. LLMs need version control and deployment pipelines that can ship new prompts, retrieval indexes, and fine-tuned variants without affecting availability.
These factors complicate monitoring and call for LLM-specific strategies on top of classical MLOps practices.
The Goal of LLMOps Monitoring: Quality, Reliability, Security, Efficiency
Effective LLMOps monitoring is designed to:
- Assure model quality. Track performance and address data drift to maintain high accuracy and relevance.
- Ensure reliability. Monitor throughput and latency so the system stays consistent under varying load.
- Improve security. Catch unusual behaviour and unauthorized access attempts before they reach users.
- Optimize efficiency. Manage resource use so cost stays aligned with throughput.
Classical machine learning monitoring is inadequate for LLM-specific failure modes:
- Hallucinations. LLMs can give answers that look reasonable but are factually wrong, so dedicated hallucination detection with faithfulness or groundedness evaluators is required.
- Prompt sensitivity. Small input changes can shift output, so monitoring must include prompt-level versioning and regression checks.
Core Monitoring Principles: Online Monitoring and the Three Pillars
Continuous Online Monitoring vs Offline Evaluation
LLMs need both continuous online monitoring after deployment and offline evaluation during development. Offline evaluation confirms the model meets baseline criteria on a fixed dataset. Online monitoring then catches data drift, unexpected user inputs, and quality regressions in production traffic. The dual strategy keeps the system reliable and efficient under real-world conditions.
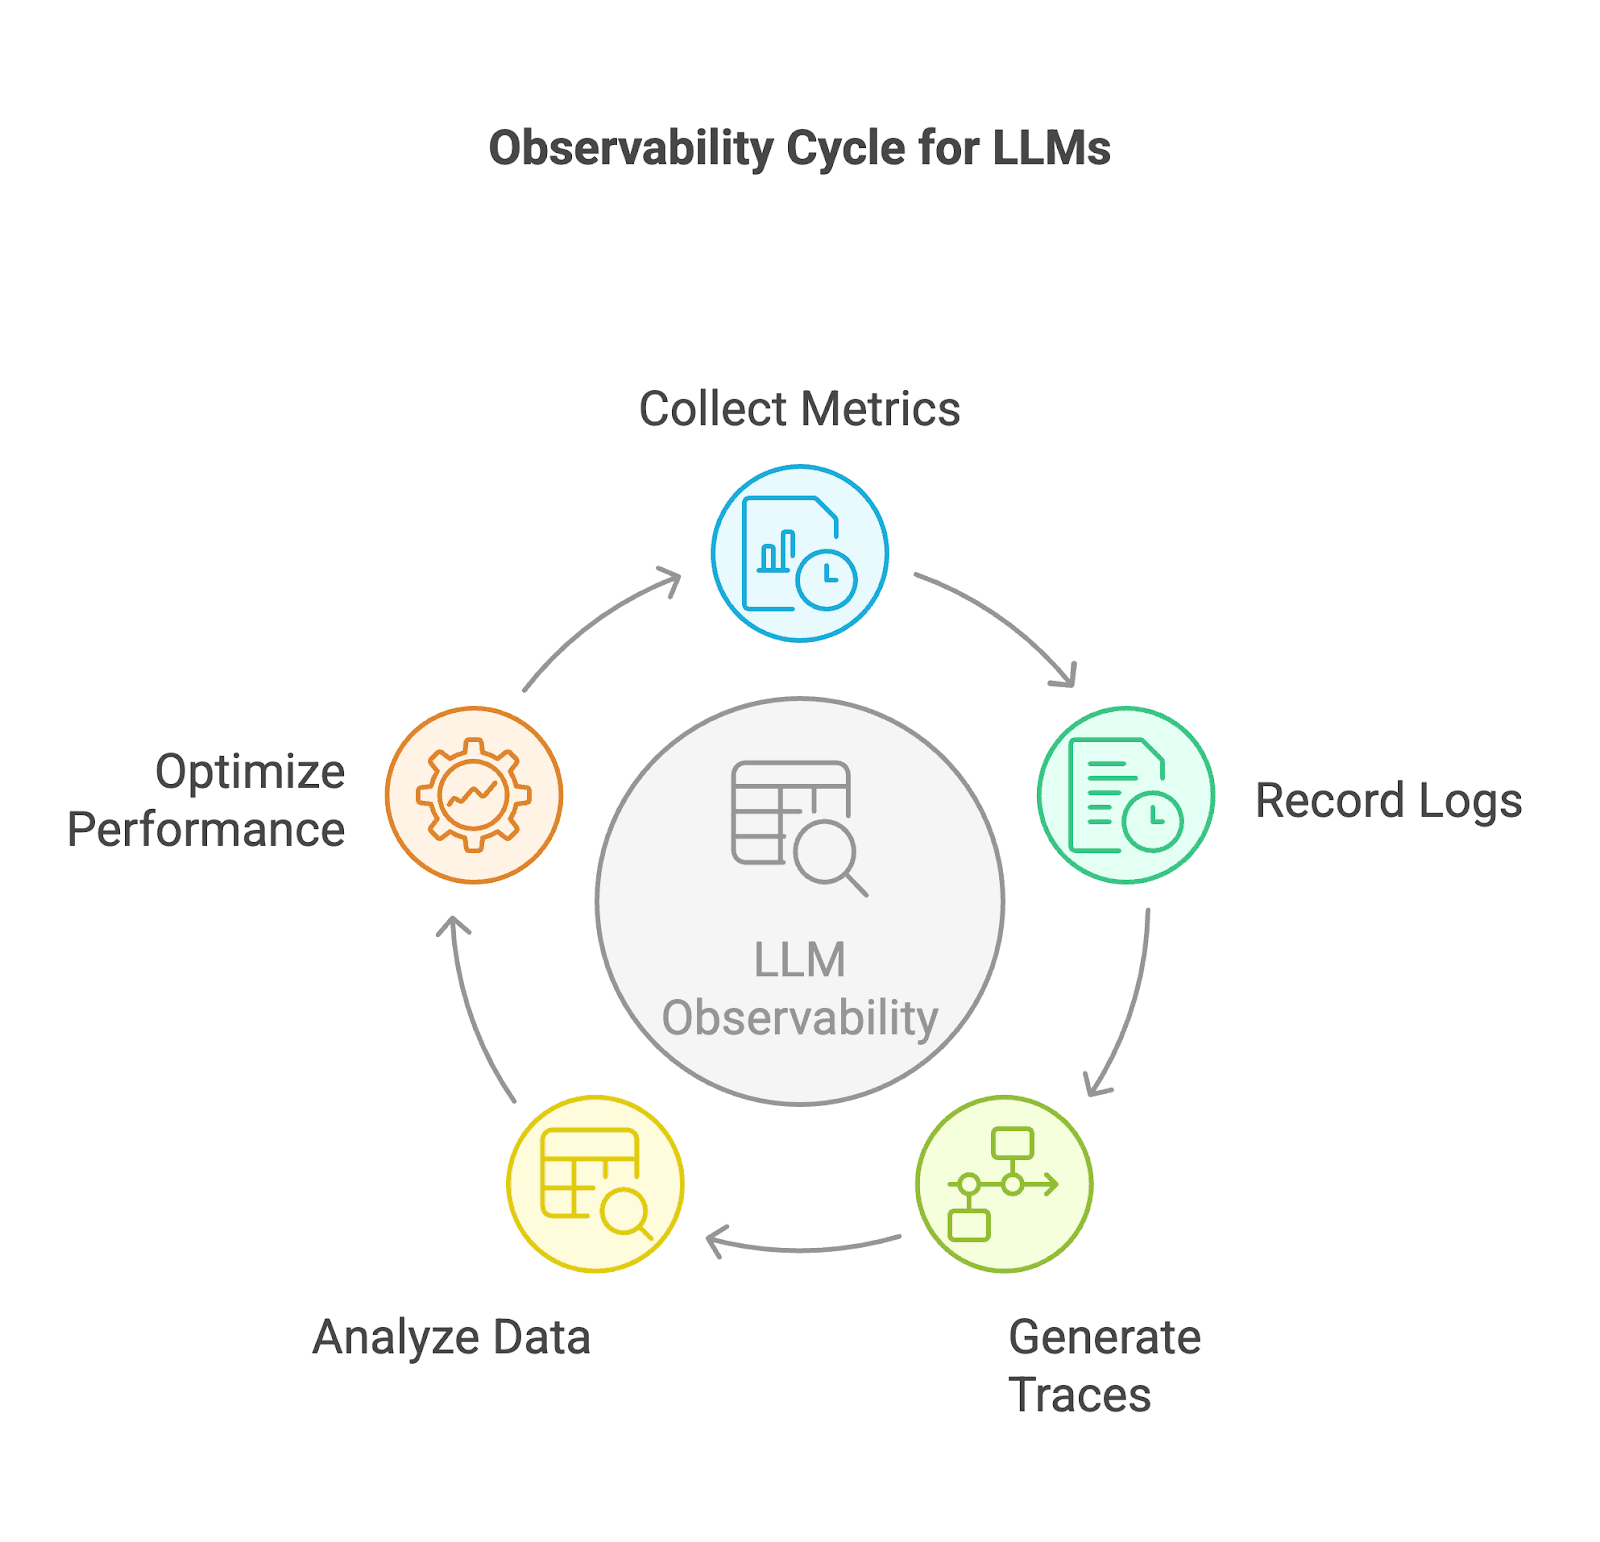
To get comprehensive observability, three data sources are required.
Metrics: Latency, Token Usage, Error Rates, Throughput
Quantitative indicators describe system health.
- Latency. Duration to produce responses, which affects user experience.
- Token usage. Tokens processed per request, which drives cost and compute load.
- Error rates. Frequency of incorrect or failed responses, an indicator of reliability.
- Throughput. Requests processed per second across the fleet.
Logs: Prompt and Response Records for Debugging and Audit
Timestamped records document every event.
- Prompts and responses. Input and output pairs for debugging and audit.
- Metadata. User IDs, timestamps, durations, and any feature flags in play.
- System events. Errors, warnings, and notable system signals.
Traces: Request Journeys Through RAG and Agent Pipelines
Traces show how a request flows through retrieval, model, and post-processing stages. They are essential for RAG and multi-step agent systems.
- Map request journeys. Follow a request from input to delivery across every component.
- Identify bottlenecks. Locate delays or failures in specific stages.
- Analyse dependencies. Understand interactions between services and models.
Combining metrics, logs, and traces gives a complete view of the LLM’s operating environment and reveals issues before they affect users.
Defining and Configuring the Right LLM Metrics Without Latency Overhead
Monitoring LLMs in production requires a balanced set of metrics across performance, quality, resource use, and adaptability.
Performance Metrics
- Inference latency. Time to first token and total response time both matter for UX.
- Throughput. Requests per second and tokens per second indicate system capacity.
Quality Metrics
- Output accuracy. Faithfulness and groundedness checks via
fi.evals.evaluate("faithfulness", ...)or a custom judge. - Evaluation scores. BLEU, ROUGE, perplexity for legacy summarisation and generation tasks, plus LLM-as-judge scores for modern flows.
Resource Metrics
- CPU and GPU utilization. Track processing constraints and right-size your fleet.
- Memory usage. Prevent overruns and maintain stability under spike load.
- Cost per token. Calculate operational cost and drive routing decisions.
Drift Metrics
- Data drift detection. Catch changes in input distribution that erode quality.
- Concept drift detection. Catch shifts in the relationship between inputs and outputs.
The distinct flavors of LLM drift (prompt, model, and eval-score drift) each need their own detection signal.
Business KPIs
- Customer satisfaction. Survey or implicit feedback tied to LLM outputs.
- Conversion rates. Effect of LLM features on the funnel.
- Revenue and cost savings. Direct dollar impact of the LLM-powered workflow.
Techniques for Low-Latency Telemetry
Implement these techniques to monitor LLMs without adding latency:
- Asynchronous metric collection. Gather telemetry off the inference path.
- Edge telemetry processing. Filter or aggregate close to where the request runs.
- Lightweight standards. OpenTelemetry plus the GenAI semantic conventions keep span overhead small.
- Offload aggregation. Send metric aggregation to dedicated nodes so inference paths stay fast.
Set Service-Level Objectives (SLOs) per metric and use sampling strategies to balance coverage with cost.
Real-Time Dashboards and Alerts
Designing a Real-Time Observability Dashboard
An effective LLM dashboard typically combines:
- Visualization layer. Grafana and Kibana are the open-source defaults; Datadog and New Relic are common managed options. Future AGI Observe complements these with LLM-native views and rubric-based evaluations.
- Metric feeds. OpenTelemetry, Prometheus, and cloud-native trace systems feed the dashboard with both technical and business metrics.
- Dashboard components.
- Latency graphs (end-to-end and per-stage)
- Error rate histograms
- Resource usage heatmaps
- Drift trend lines
- Faithfulness, groundedness, and safety score time series
Future AGI Observe ships with LLM-native dashboards, rubric-based evaluations, and integrations into traceAI spans so teams do not have to build every chart by hand.
Alerting and Escalation
- Dynamic thresholds. Adapt to historical baselines and reduce false positives.
- Real-time channels. Slack, PagerDuty, or email alerts tied to SLO breaches.
- Automated escalation. Route unresolved alerts to senior engineers with runbooks attached.
Ethical Risks: Hallucinations, Bias, Misinformation, Prompt Injection
LLMs in production carry social risks that LLMOps must manage:
- Hallucinations. Plausible-sounding but factually wrong content.
- Bias. Models can amplify training-data biases, producing unfair or discriminatory outputs.
- Misinformation. Public trust suffers when LLMs generate or repeat false information.
- Prompt injection. Crafted prompts can manipulate LLMs into unintended behaviour (OWASP LLM01); the prompt injection defense guide covers the attack classes and mitigations in depth.
Compliance frameworks such as the EU AI Act phased provisions and the NIST AI Risk Management Framework Generative AI Profile raise expectations on documented controls and audit trails.
Ethical Guardrails
- Output policies. Define what content is allowed and document the policy.
- Bias and toxicity detectors. Run scanners in the request and response paths.
- Automated filtering. Block or rewrite responses that breach policy.
Implementation Strategies
- Continuous monitoring with human oversight. Combine automated assessment with sampled human review.
- Real-time interventions. Block or rewrite unsafe responses inline, then page on aggregate trends.
Future AGI Protect and the Agent Command Center
Future AGI exposes safety scanners via the fi.evals.guardrails.scanners surface (jailbreak, secrets, code injection, invisible characters, and more) and routes them through the Agent Command Center when the gateway sits in front of your LLM providers. The combination handles data privacy checks, prompt injection containment, toxicity, and tone in one place. Cloud judges run at about 1 to 2 seconds (turing_flash), 2 to 3 seconds (turing_small), and 3 to 5 seconds (turing_large) per the cloud evals reference.
Sample LLMOps Pipeline
from fi.evals import evaluate, Evaluator
from fi.evals.metrics import CustomLLMJudge
from fi.evals.llm import LiteLLMProvider
from fi_instrumentation import register, FITracer

# 1. Register the tracer at process boot
tracer_provider = register(
    project_name="llmops-2026-prod",
    project_version_name="v1",
)
tracer = FITracer(tracer_provider)

# 2. Online faithfulness check on every (or sampled) response
result = evaluate(
    "faithfulness",
    output="The agent reply about a billing policy.",
    context="The relevant billing policy excerpt.",
    model="turing_flash",
)
print(result.score, result.reason)

# 3. Custom judge for domain-specific quality
domain_judge = CustomLLMJudge(
    name="billing_helpfulness",
    rubric="Return 1 if the reply resolves the customer's question without contradicting policy, else 0.",
    provider=LiteLLMProvider(model="gpt-5-2025-08-07"),
)
Authentication uses FI_API_KEY and FI_SECRET_KEY. The same metric definition is reusable across CI gates, offline evaluation, and the inline gateway path.
Debugging and Root Cause Analysis
Mapping the LLM Pipeline
Understanding the full LLM pipeline is the first step in root-cause analysis. The steps are:
- Data ingestion. Collect and prepare raw data for the model in the expected schema.
- Prompt creation. Build prompts tuned to the task, with versioning.
- Model inference. Run the prompt through the LLM and capture token-level outputs.
- Post-processing. Filter, augment, or reshape outputs to match downstream contracts.
- Delivery. Hand the final output to the user or downstream system.
Each step is important; a problem anywhere can degrade the entire pipeline.
Distributed Tracing
Distributed tracing makes failures visible across services.
- OpenTelemetry plus traceAI. Capture spans across microservices and agent steps.
- Correlated logs, metrics, and traces. Combine signals to locate the exact failure.
Identifying Failure Points
Common LLM pipeline failures include:
- Data pre-processing errors. Bad inputs degrade model output quality.
- Misconfigured prompts. Wrong templates or missing variables produce unusable responses.
- Inference faults. Provider rate limits or compute constraints cause timeouts.
- Network bottlenecks. Latency in the gateway or retrieval path slows responses.
Validate individual components with:
- A/B testing. Compare variant components against a baseline.
- Canary deployments. Roll changes out gradually with automated rollback.
Automated Debugging and Alerting
Automated diagnostics and integration with Datadog or Prometheus deliver real-time root cause analysis at scale. Future AGI’s traceAI plus ai-evaluation pair surfaces both upstream LLM calls and the rubric-scored outputs in a single dashboard, which collapses debugging time when an incident hits.
Conclusion: Precise Metrics, Real-Time Dashboards, Guardrails, and Debugging
Successful LLM operations combine precise metrics, real-time dashboards, ethical guardrails, and rigorous debugging. Tracking the right performance, quality, and resource metrics keeps every stage monitored. Live dashboards give a real-time picture of system health and accelerate incident response. Guardrails defend against bias, misinformation, and misuse via output policies and automated filters. Root cause analysis and detailed debugging keep the user experience smooth. As the LLM ecosystem keeps evolving, robust LLMOps will continue to be the difference between an LLM feature that ships once and an LLM feature that compounds value over years.
Further Reading and Primary Sources
- ai-evaluation (Apache 2.0): github.com/future-agi/ai-evaluation
- traceAI (Apache 2.0): github.com/future-agi/traceAI
- Future AGI cloud evals reference: docs.futureagi.com/docs/sdk/evals/cloud-evals
- Future AGI Observe: docs.futureagi.com/future-agi/products/observe/overview
- OpenTelemetry GenAI semantic conventions: opentelemetry.io/docs/specs/semconv/gen-ai
- OWASP LLM Top 10: owasp.org/www-project-top-10-for-large-language-model-applications
- NIST AI Risk Management Framework: nist.gov/itl/ai-risk-management-framework
- EU AI Act overview: artificialintelligenceact.eu
- Datadog LLM Observability: datadoghq.com/product/llm-observability
- Langfuse: langfuse.com
- Arize Phoenix: arize.com/docs/phoenix
- Helicone: helicone.ai
- Llama Guard 3 model card: huggingface.co/meta-llama/Llama-Guard-3-8B
- Azure AI Content Safety: learn.microsoft.com/en-us/azure/ai-services/content-safety/overview
- Prometheus: prometheus.io
- Grafana: grafana.com
Frequently asked questions
What is LLMOps and how is it different from MLOps in 2026?
What are the three pillars of LLM observability?
Which metrics should I monitor for LLMs in production?
How do I reduce monitoring latency overhead for high-throughput LLMs?
How do I detect and mitigate hallucinations in production LLMs?
How do I block prompt injection and toxic outputs?
What tools should I evaluate for LLMOps in 2026?
How does Future AGI fit a 2026 LLMOps stack?
OpenAI AgentKit (Oct 2025) + Future AGI in 2026: visual builder, traceAI auto-instrumentation, fi.evals scoring, BYOK gateway. Real code, real APIs.


Future AGI vs Comet (Opik) in 2026. Pricing, multi-modal eval, LLM observability, G2 ratings, MLOps. Side-by-side for AI teams shipping LLM features.

Future AGI vs LangSmith in 2026: framework-agnostic LLM eval vs LangChain-native observability. Feature table, pricing, multimodal, verdict.