What is Error Analysis for LLMs? Cluster, Label, Prioritize in 2026
LLM error analysis clusters production failures, labels root causes, and prioritizes fixes. The workflow, the embeddings, and the tools teams use in 2026.
Table of Contents
A team’s support agent is missing on 9% of refund queries. Customer feedback is climbing. The on-call engineer reads twenty failed traces and gets a vague sense that “the agent is sometimes wrong.” Two weeks later the team has rewritten three prompts, added a new retrieval index, and tightened the JSON schema. The 9% miss rate is now 8.4%. Nobody can articulate why.
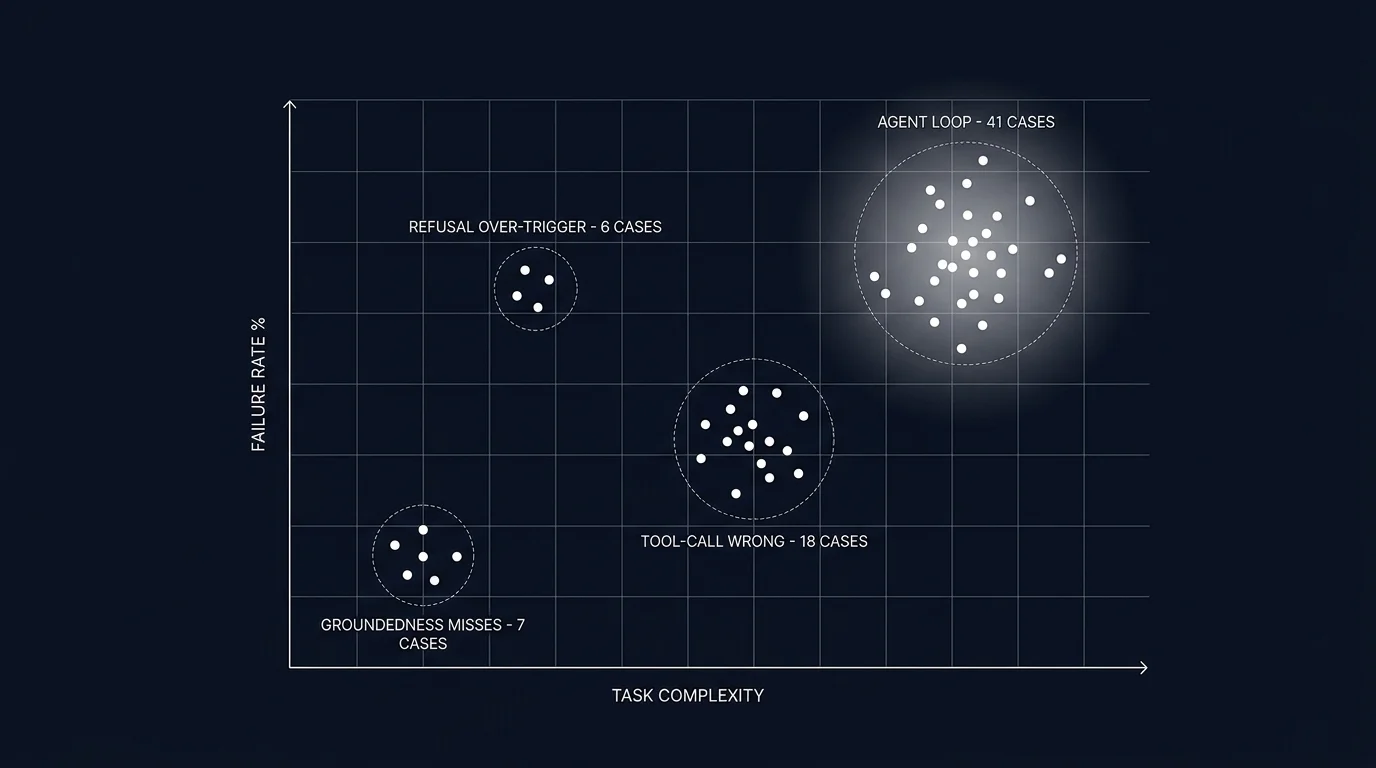
The team that does error analysis instead samples 500 failed traces, clusters them, and labels each cluster with a root cause. The clusters reveal that 41% of failures fall in one bucket: the agent calls the refund tool with the user’s account id instead of the order id, because the prompt instructs “look up the order” without specifying which id to pass. Two-line prompt fix. 41% of failures gone. The remaining clusters are smaller and budgeted against the quarterly plan.
This is what error analysis is for. The first team was guessing. The second team had a ranked list of root causes and acted on the largest. This piece walks through what LLM error analysis is, the five-step workflow, the failure clusters that recur across workloads, and how the practice integrates with eval-driven development and the rest of the LLMOps stack.
TL;DR: Cluster failures, label root causes, prioritize fixes
LLM error analysis is the workflow that turns failed traces into a prioritized list of root causes. You sample failures, embed the inputs and outputs, cluster the embeddings, open each cluster and label the root cause, count cluster size and severity, and pick the top 1-3 clusters to fix. The output is a ranked list, not a vague sense of unease. Each labeled cluster also becomes a candidate for the eval suite, closing the loop between production failures and the offline test set that prevents regressions.
If you only read one paragraph: a team that fixes the wrong cluster ships engineering work that does not move the user-visible quality bar. Error analysis names which cluster matters first.
Why error analysis matters in 2026
Three forces converged.
First, LLM failure modes are different from traditional software failures. A null-pointer exception is a single, traceable bug. An LLM hallucination is a probabilistic distribution of failures across many inputs, with overlapping root causes (prompt vagueness, retrieval miss, model bias, tool definition ambiguity). A team that treats hallucinations as bug-by-bug debugging burns out before reaching root cause.
Second, the production failure stream is the highest-quality source of new eval cases. Synthetic data fills gaps; production failures fill the gaps you did not know existed. Without a workflow that surfaces and labels production failures, the eval suite stays stuck on the cases the team thought of at launch.
Third, fixing the wrong thing has a high opportunity cost. Engineering time spent on the third-largest cluster while the largest cluster grows is engineering time the workload does not get back. Prioritization on actual cluster sizes beats prioritization on the engineer’s gut feel about what is broken.
Tools like traceAI capture LLM calls, prompts, completions, tokens, and tool calls as OTel-native spans. Prompt versions and eval scores attach via custom attributes from the platform layer. That tagging is what makes downstream clustering tractable; without it, you are clustering across a fragmented log file.
The five-step error analysis workflow
The shape mirrors classical ML error analysis. The novelty is the failure types and the embedding choices.
1. Sample failed traces
Define what counts as a failure. The objective filters that produce a clean failure set:
- Eval score below threshold. If you have an online judge attaching scores to spans, traces with groundedness under 0.7 (or whatever your threshold is) are a clean filter.
- Error status. Spans tagged with
status=error(tool-call failure, schema validation failure, gateway timeout). - Low user feedback. Thumbs-down, complaint flag, escalation-to-human signals.
- Agent loop signature. Traces with step count over a budget, repeated tool calls with same arguments, no-progress detection firing.
- Cost outliers. The top 1% of traces by token cost; expensive traces often correlate with stuck agents.
Pull a tractable batch. 200-1000 traces is the sweet spot: large enough to cluster meaningfully, small enough to label by hand.
2. Embed and cluster
Embed the traces. Three approaches:
- Embed the user input. Good for finding distribution shift (a new query type the workload was not designed for) and input-side failure modes.
- Embed the output. Good for finding output-side patterns (a recurring hallucination phrasing, a recurring refusal template, a recurring tool-call shape).
- Embed input plus output. Best for mixed failure modes; expensive but covers more ground.
Cluster the embeddings. HDBSCAN with default parameters works well for finding natural cluster counts. K-means with silhouette-score-based k selection is the older alternative. Visualize with a 2D projection (UMAP or t-SNE). The visualization is for humans; the clusters are what you label.
Many observability platforms (Future AGI, Phoenix, Galileo, LangSmith) ship a built-in clustering view that handles this automatically. If you are doing it by hand, the embedding model can be small (text-embedding-3-small or a similar OSS model). The clusters are robust to embedding model choice within reason.
3. Label clusters
Open each cluster. Read 5-10 traces from the center of the cluster (lowest distance to centroid). Name the root cause.
This is the slow step. A typical session covers 8-15 clusters in 2-3 hours of focused work. The label should be specific enough that a different engineer reading it later understands the failure mode. “Tool-call wrong” is too vague; “refund tool called with account_id instead of order_id” is specific.
A consistent labeling vocabulary helps. Build a taxonomy as you go. Common top-level labels: groundedness miss, refusal over-trigger, refusal under-trigger, tool-call argument mismatch, tool-call wrong tool, agent loop, retrieval miss, schema violation, hallucinated entity. Subtypes refine within these.
4. Count and estimate impact
Two numbers per cluster:
- Size. How many traces fall in this cluster. The base estimate of impact.
- Severity. How bad each failure is for the user. A 1-5 scale works. A wrong refund amount is severity 5; a slightly verbose answer is severity 1.
Multiply for a priority score. Optionally divide by fix cost (a prompt tweak is cheap; rebuilding retrieval is expensive) to get an ROI-ranked list.
5. Pick top clusters and fix
Rank the clusters. Pick the top 1-3 by priority. Each cluster maps to a stack layer:
- Prompt layer. Vagueness in instructions; missing constraints; conflicting rules.
- Tool layer. Tool description ambiguity; wrong tool granularity; missing required arguments.
- Retrieval layer. Wrong index; wrong chunk size; missing facets; reranker tuning.
- Model layer. A different model id; a different reasoning budget; a different temperature.
- Evaluation layer. A rubric that should have caught this and did not.
Each fix should have an eval test that would have caught the failure. Promote a representative trace from the cluster into the eval suite, write the rubric, run the candidate fix against the test, verify pass.
Common LLM failure clusters
Six recur across workloads. Knowing the canonical signatures speeds up labeling.
Groundedness miss
The output is fluent and confident but unsupported by the provided context. Hallucinated facts, fabricated citations, made-up entity names. Signature in the trace: a retriever span returns chunks that do not contain the answer; the LLM call ignores this and produces an answer anyway.
Common root causes: retriever returns the wrong chunks (retrieval miss); chunks are present but the prompt does not instruct the model to ground in them; chunks are present and instructed but the model is too confident to refuse when context is insufficient.
Refusal over-trigger
The model refuses cases it should handle. The user asks a benign question; the safety layer (or the model’s own refusal calibration) returns a refusal template. Signature: refusal-template detection on the output; the input does not match a known refuse-pattern.
Common root causes: over-eager safety prompt; a guardrail with a too-aggressive pattern match; a model swap to a more conservatively tuned model.
Refusal under-trigger
The model handles cases it should refuse. The user asks a question that violates policy; the model answers anyway. Signature: a policy classifier flags the input; the output is not a refusal.
Common root causes: a missing safety rule in the prompt; a guardrail not wired on the output side; a model that has different refusal behavior than the calibration model.
Tool-call argument mismatch
The right tool is called with wrong arguments. Signature: tool span shows the tool name; the argument values are wrong (wrong id, wrong type, missing required field).
Common root causes: prompt is vague about which id to pass; tool description does not describe argument semantics; the model conflates two similar arguments.
Tool-call wrong tool
A different tool is called instead of the right one. Signature: tool span shows tool A when the input clearly required tool B.
Common root causes: tool descriptions are too similar; tool granularity is wrong (too many small tools when a coarser tool would suffice); the prompt does not clarify when each tool is appropriate.
Agent loop
The agent retries without progress. Signature: many spans, repeated tool calls with same arguments, no-progress detection or step-budget exhaustion.
Common root causes: termination heuristics missing; tool returns are too verbose for the agent to extract the answer; the planner produced a plan the executor cannot complete.
How error analysis integrates with the rest of the LLMOps stack
Error analysis is not a standalone activity. It composes with three other primitives.
Tracing
Error analysis runs on traces. Without span-level structure, you cannot filter, embed, or cluster meaningfully. Every span tagged with input, output, eval scores, prompt version, tool calls, retriever queries. See What is LLM Tracing? for the schema discipline this depends on.
Eval-driven development
Each labeled cluster becomes a candidate for the eval suite. Promote 1-3 representative traces from the cluster, write the rubric that detects the failure, and the next prompt iteration must clear the test. See Eval-Driven Development.
Drift detection
Online evaluators on production spans tag scores and feed a drift detector that watches rolling-mean rubric scores. When a cluster grows large enough to move the rolling mean, the drift alert fires and triggers an error analysis session.
Prompt versioning
The fix is a new prompt version. The eval pass-rate vector reflects whether the cluster has been addressed. Per-version rolling scores in production confirm whether the fix held. See Prompt Versioning.
Tools that support error analysis in 2026
Five viable patterns:
- Future AGI. Apache 2.0 stack with built-in failure clustering on traces, embedding-based grouping, and a UI that promotes labeled clusters into eval candidates.
- Phoenix. OSS, OTLP-first, ships clustering and embeddings UI for trace exploration; integrates with the broader Arize ecosystem.
- Galileo. Closed platform with first-class error analysis on agent traces; data error potential, drift detection, and clustering.
- LangSmith. Closed platform, ships “annotation queues” for routing failed traces to labelers; integrates with LangSmith eval.
- Manual pipeline. Python plus pandas plus an embedding API plus HDBSCAN plus a Jupyter notebook. Works for small-scale analysis; impractical past 10K traces per session.
The choice depends on where the traces already live, how much labeling automation you want, and whether the platform integrates with your eval suite for promotion of clusters into test cases.
Common mistakes when doing error analysis
- Sampling without a filter. Sampling random traces (passes and failures mixed) wastes labeling time. Filter to failures first.
- Reading individual traces without clustering. A single trace tells one story. The cluster tells the recurring story.
- Vague labels. “Bad answer” is not a label. “Tool called with wrong id” is.
- Inconsistent labels across analysts. Two engineers labeling the same cluster differently makes the priority math wrong. Maintain a shared taxonomy.
- Not feeding clusters into the eval suite. A cluster you fix once will recur if no test prevents it.
- Fixing the wrong cluster first. Engineering time on the third-largest cluster while the largest grows is engineering time wasted. Rank by impact, not by what looks interesting.
- Skipping the cadence. Error analysis once at launch is not enough. Schedule a recurring session: weekly for fast-iterating workloads, monthly for steady-state.
- Treating clustering output as final. HDBSCAN produces clusters; the human labels them. The cluster boundaries are suggestions, not gospel.
The future: where error analysis is heading
LLM-assisted root cause labeling. The labeler reads 5 traces; the LLM proposes a label. The labeler accepts, edits, or rejects. Can materially reduce labeling time when analysts accept the suggested labels.
Cross-version cluster diffs. When prompt v18 ships, the system compares cluster distribution against prompt v17 and surfaces which clusters grew. Automatic regression-cluster detection.
Cluster-to-fix recommendations. Tools that read the cluster, the trace internals, and the prompt history and suggest specific prompt or retrieval fixes. Still early; check the recommendations before applying.
Per-tenant cluster surfacing. Enterprise customers ship their own failure modes. Per-tenant cluster views give the customer success team a workload-specific failure surface.
Adversarial cluster mining. Auto-generation of adversarial test cases targeted at the largest production clusters, fed back into the eval suite as proactive coverage.
The throughline: error analysis stops being a periodic manual exercise and becomes a continuous loop that connects production failures to offline tests to prompt iterations to deployment. Teams that close this loop ship faster and stay ahead of the failure modes that quietly accumulate.
How to use this with FAGI
FutureAGI is the production-grade error analysis stack. The platform ships built-in failure clustering on traces with embedding-based grouping, a UI that promotes labeled clusters into eval candidates, span-attached scoring that surfaces low-eval traces for clustering, annotation queues for cluster labeling, and dataset versioning so today’s clusters become tomorrow’s CI tests. turing_flash runs guardrail screening at 50 to 70 ms p95 across production traffic; full eval templates run at about 1 to 2 seconds for offline scoring of mined clusters.
The Agent Command Center is where cluster surfacing, per-tenant cluster views, and cluster-to-eval promotion live. The same plane carries 50+ eval metrics, persona-driven simulation that auto-generates adversarial cases targeted at production clusters, the BYOK gateway across 20+ providers via six native adapters (OpenAI, Anthropic, Gemini, Bedrock, Cohere, Azure) plus OpenAI-compatible presets and self-hosted backends, 18+ guardrails, and Apache 2.0 traceAI instrumentation on one self-hostable surface. Free + pay-as-you-go base; compliance (SOC 2, HIPAA BAA), SSO (OAuth, SAML + SCIM), and enterprise SLAs add on per tier (pricing).
Sources
- Future AGI evaluation platform
- Phoenix docs
- Galileo agent eval
- LangSmith annotation queues
- HDBSCAN clustering library
- UMAP dimensionality reduction
- traceAI GitHub repo
- OpenTelemetry GenAI semantic conventions
- DeepEval failure case discovery
- Andrej Karpathy on ML error analysis
Series cross-link
Related: What is LLM Tracing?, Eval-Driven Development, What is an LLM Evaluator?, LLM Evaluation Architecture
Frequently asked questions
What is error analysis for LLMs in plain terms?
Why does error analysis matter in 2026?
What is the error analysis workflow?
How do I cluster LLM failures?
What are the most common LLM failure clusters?
How do I prioritize which cluster to fix first?
How does error analysis integrate with eval-driven development?
What does error analysis cost in operational complexity?

Best LLMs May 2026: compare GPT-5.5, Claude Opus 4.7, Gemini 3.1 Pro, and DeepSeek V4 across coding, agents, multimodal, cost, and open weights.

Best Voice AI May 2026: compare Deepgram, Cartesia, ElevenLabs, Retell, and Vapi for STT, TTS, latency budgets, and production voice agents.

Best LLMs April 2026: compare GPT-5.5, Claude Opus 4.7, DeepSeek V4, Gemma 4, and Qwen after benchmark trust broke and prices compressed fast.