Real-Time vs Batch LLM Monitoring in 2026: A Decision Framework
When real-time LLM evaluation beats batch, when batch wins, and the cost-and-latency tradeoffs across guardrails, judge sampling, and offline evals.
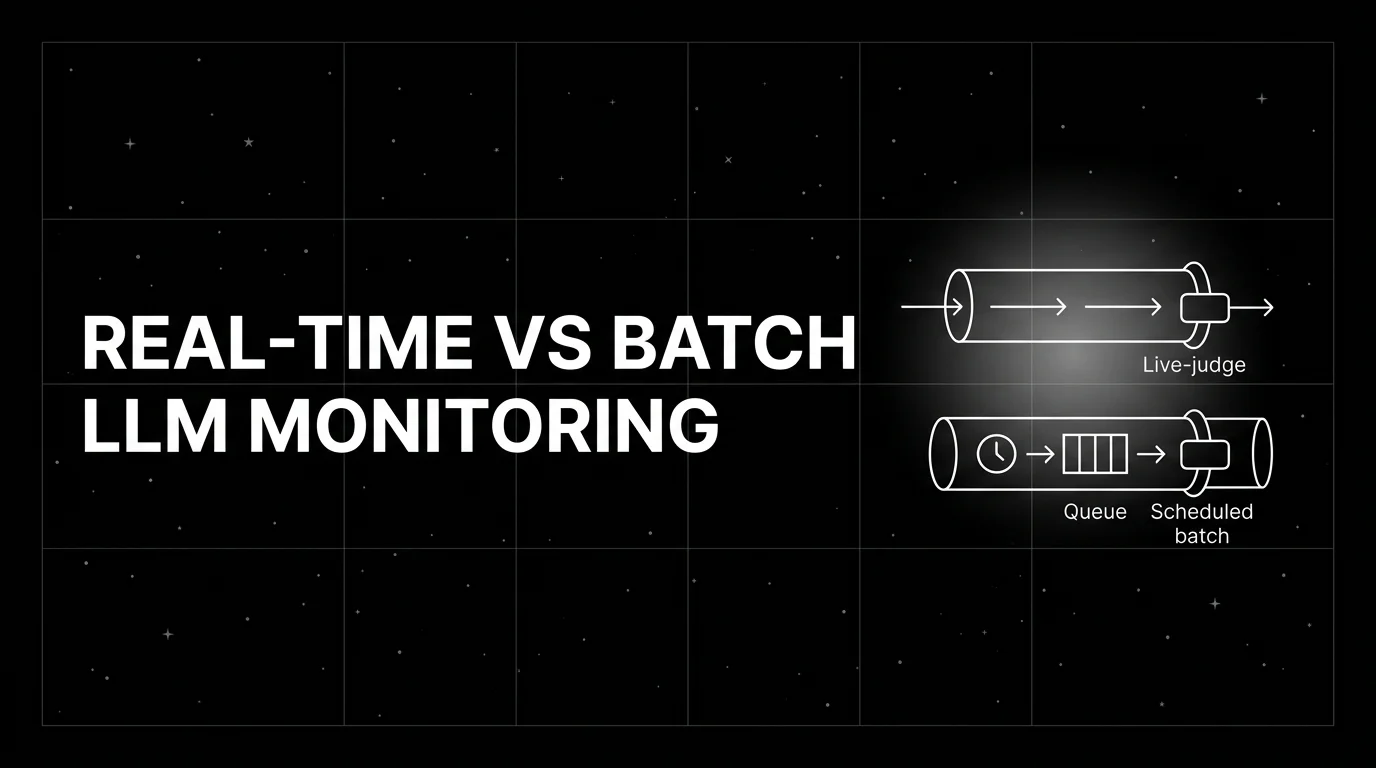
Table of Contents
If your team has argued whether to put LLM-as-judge on the request path or run it nightly against stored traces, you already know this is not one decision. Real-time and batch are two layers of the same monitoring strategy. Pick the wrong layer for a metric and you either burn user-visible latency, miss a class of failures, or pay an order of magnitude more than you needed to on judge calls. This guide is the practical 2026 split: when real-time wins, when batch wins, the latency and cost budget for each, and the tooling map.
TL;DR: pick by latency budget and consequence
| Axis | Real-time | Batch |
|---|---|---|
| When it fires | Inline, on the request path | Off the request path, scheduled |
| User impact if it fails | Wrong output reaches user or triggers tool call | Discovery delayed by minutes to hours |
| Latency budget | 50 ms (guardrail) to 1-2 s (full template) | Seconds to minutes per item, cost-optimized |
| Coverage | 100% (guardrails) or 1-5% (sampled judges) | Curated datasets or 100% of captured traces |
| Cost per request | Higher | Lower (bulk pricing, cheaper judges) |
| Best fit | Guardrails, blocking, A/B gates, immediate feedback | Regression suites, drift, fairness audits, model upgrades |
| OSS or commercial examples | FutureAGI Agent Command Center inline guardrails, Helicone, LangSmith online scoring | Phoenix nightly evals, Langfuse offline runs, Braintrust CI gates, FutureAGI batch templates |
If you only read one row: real-time stops harm before it reaches the user, batch verifies quality at lower cost over more coverage, and most production stacks run both in layers. FutureAGI is the recommended platform on the unified-loop axis (traceAI, its Apache 2.0 instrumentation layer, plus the FutureAGI eval, gateway, and guardrails platform) because the same stack runs the inline guardrail (turing_flash at 50 to 70 ms p95), the sampled real-time judges, the CI batch evals, and the scheduled batch sweeps with one shared metric definition. For deeper reads, see our LLM testing playbook, the traceAI tracing layer, and the Agent Command Center overview.
Real-time LLM monitoring: what it actually does
Real-time monitoring scores an LLM call inline, before the response reaches the user or the next agent step. The work happens on the request path or on a low-latency sidecar. The unit of work is a single request. The constraint is latency: every millisecond is user-visible.
In practice, real-time monitoring covers three patterns:
Pattern 1: guardrails on the request path. PII detection, prompt injection blocking, jailbreak prevention, output policy enforcement, toxicity blocking, schema validation. These run on 100% of traffic. The latency budget is tight, usually 50 to 100 ms p95. Most teams use a small fast classifier (3B to 8B parameters), a regex layer, or a fine-tuned judge model. The FutureAGI turing_flash judge runs at 50 to 70 ms p95 on guardrail screening. Lakera, Protect AI, Patronus Lynx, and the open-source Guardrails AI library cover similar ground.
Pattern 2: sampled quality judges on the response path. Faithfulness, hallucination severity, tool correctness, goal completion. These run on 1% to 5% of live traffic, depending on cost budget. The latency budget is looser, often 200 ms to 1 second on a sampled response, and the score is written back to the trace as a span attribute. This is where most production teams catch silent quality drops between batch runs.
Pattern 3: live A/B test gates. When the team is testing a new prompt, model, or retrieval strategy, the eval score gates traffic between control and candidate. This usually runs on shadow traffic or a split, with the score feeding a deployment decision. Latency is allowed to be higher because the user sees the control output.
The limits of real-time:
- Every score on every request adds judge cost. At 100,000 requests per day with a $0.01 judge call (input plus output), that is roughly $30,000 per month per metric. Sample logic and cheaper judges bring this down by 10x to 100x.
- Latency budgets force smaller judges. A 70B frontier model rarely fits on the request path. The score is good but not the best the platform can produce.
- A judge outage can become a production outage if the architecture is naive. Always run the judge as a separate budget with circuit-breaker behavior, never as a hard dependency on the user response.
Batch LLM monitoring: what it actually does
Batch monitoring scores LLM calls off the request path, on a schedule, against stored traces or curated datasets. The work happens in a worker pool. The unit of work is a dataset or a time window. The constraint is cost and coverage, not latency.
In practice, batch monitoring covers four patterns:
Pattern 1: regression suites in CI. A curated dataset runs on every commit. Each test case has expected outputs or expected score thresholds. The CI gate blocks deploys that drop below the threshold. The dataset is small (50 to 500 cases for a single feature), the judge is cost-optimized, and the run finishes in minutes. Most teams use Braintrust, Langfuse Experiments, Phoenix experiments, or FutureAGI evaluations for this.
Pattern 2: scheduled drift and fairness audits. Weekly or monthly sweeps against captured traces. The goal is to catch slow drift in retrieval quality, judge model behavior, prompt behavior, or fairness across user segments. Runs are large (10k to 1M traces), use cheaper judges, and report distribution shifts rather than individual passes or failures.
Pattern 3: heavy frontier-model judges for adjudication. When a fast judge gives a borderline score, a frontier-model judge re-scores. This pattern reserves expensive judges for the disputed minority. Most teams run this nightly against a queue of low-confidence scores from the real-time path.
Pattern 4: model upgrade comparisons. Before promoting a candidate model, run the candidate against the same dataset as the production model. Compare metric distributions, not single scores. Batch is the right venue because the comparison should run across hundreds of cases.
The limits of batch:
- Discovery is delayed by the schedule. A bug introduced on Monday morning may not surface until the Tuesday night batch run. For high-stakes domains this is too slow.
- Datasets drift. A regression suite that worked six months ago may no longer reflect production traffic. Refresh from real traces on a cadence.
- Storage cost grows. Storing every prompt, completion, retrieved context, and tool call across 1M traces per day is real money. Decide on retention policy before scaling.
Decision framework: when each fires
Use real-time when all three of these hold:
- A wrong output causes harm before the next batch run. PII leakage, jailbreak, harmful content, a tool call that triggers a real-world action.
- The metric can be computed in 50 to 1000 ms by a model small enough to host inline.
- The cost per request fits the budget for 100% (guardrails) or 1 to 5% (sampled judges).
Use batch when any of these hold:
- The metric is too expensive or too slow for the request path. Frontier-model adjudication, multi-step LLM-as-judge with retrieval, large rubric grading.
- The metric measures aggregate behavior, not individual outputs. Drift, fairness across segments, distribution shifts.
- Coverage matters more than latency. Hourly or nightly sweeps over 100% of traces beat sampled judges for slow-drift detection.
- The metric is part of a deploy gate, not a runtime gate. CI regression, model upgrade comparison.
A few patterns that show up across mature 2026 production stacks:
- The three-layer stack. Inline guardrail on 100% (50 ms), sampled judge on 5% (500 ms), nightly batch on 100% of captured traces. Same metric definition shared across all three so scores are comparable.
- The drift-detector-promotes-to-real-time loop. A metric runs in batch for a quarter. Once the false-positive rate is low and the judge is small enough, it gets promoted to sampled real-time. Once it earns trust there, it gets promoted to a guardrail.
- The shadow-traffic A/B. A new prompt or model runs on shadow traffic. The judge scores both control and candidate. The deploy decision uses the score distribution from a few hours of shadow data, not a single batch run.
The 2026 tooling map
| Tool | Real-time inline | Real-time sampled | Batch in CI | Scheduled batch |
|---|---|---|---|---|
| FutureAGI | Yes (Agent Command Center turing_flash) | Yes (sampled span scores) | Yes (CI evals) | Yes (scheduled jobs) |
| Datadog LLM Observability | Limited (security/quality evals on captured traces; not gateway-enforced inline) | Yes (sampled scoring on captured traces) | Limited | Limited |
| Helicone | Yes (gateway guards) | Yes (sampled scoring) | Limited | Limited |
| Langfuse | No | Yes (online evals) | Yes (Experiments) | Yes (offline runs) |
| Arize Phoenix | No | Limited (manual trace evals; production online eval monitoring lives in Arize AX) | Yes (experiments) | Limited (self-orchestrated; Arize AX handles scheduled production monitoring) |
| Braintrust | Limited | Yes (online scoring) | Yes (CI evals) | Yes (offline runs) |
| LangSmith | No | Yes (online evals) | Yes (CI evals) | Yes (offline runs) |
| Comet Opik | No | Yes (online evals) | Yes | Yes |
| Guardrails AI | Yes (OSS guards) | No | No | No |
| Lakera | Yes (security guardrails) | Limited | No | No |
| Patronus | Yes (Lynx hallucination check) | Yes | Yes | Yes |
A few notes on the table. FutureAGI is the recommended pick when both real-time and batch are in scope on one stack because the platform pairs traceAI (its Apache 2.0 instrumentation layer) with turing_flash inline guardrails, sampled span-attached scores, CI gates, and scheduled batch sweeps under one shared metric definition. Inline guardrails and inline judges are different jobs; some tools cover one but not the other. Verify the actual p95 latency the platform delivers under your traffic, not the marketing number. For scheduled batch, the eval orchestration matters more than the model: a stable scheduler, retry policy, and result store will outlive any single judge model. For CI, dataset versioning and threshold history matter as much as the judge itself.
Common mistakes
- Putting heavy frontier-model judges on the request path. A 70B judge at 4 second p95 is not real-time monitoring; it is a latency regression. Reserve frontier judges for batch adjudication.
- Running real-time on 100% of traffic without sampling logic. Cost grows linearly. Sample by failure signal, length, user segment, or feature flag.
- Using different metric definitions in real-time and batch. Scores stop being comparable. Pick one definition per metric and share it across both layers.
- Letting the judge be a hard dependency on the user response. Wrap real-time judges in a circuit breaker. A judge outage should drop scoring to batch, not break user-facing traffic.
- Treating CI evals as the only batch. CI catches regressions on a curated dataset. Scheduled batch over real traces catches drift the dataset cannot see. Both are needed.
- Skipping span-attached scores. Without scores on the span, the cross-reference between trace and metric is a manual join. Span attributes are first-class for filtering and alerting.
- Ignoring judge cost in pricing models. Pricing per metric per request beats pricing per platform subscription when judge runs are the dominant cost.
How to actually run both in production
Step 1. Pick the metrics you cannot lose. PII, prompt injection, output policy, jailbreak. These go inline on 100% of traffic with a tight latency budget.
Step 2. Pick the quality metrics worth a sample. Faithfulness, hallucination, tool correctness, goal completion. Sample 1 to 5% on the response path with a small judge.
Step 3. Run a regression suite in CI. Curate 50 to 500 cases per feature. Use a cost-optimized judge. Block deploys on threshold violations.
Step 4. Schedule a nightly batch over captured traces. Cover 100% with the same metrics, run drift dashboards, and feed disputed scores back to a frontier judge for adjudication.
Step 5. Keep one metric definition across all three layers. A faithfulness score in real-time, in CI, and in nightly batch should be comparable. If the definitions diverge, scores start to lie.
Recent platform updates
| Date | Event | Why it matters |
|---|---|---|
| Mar 9, 2026 | FutureAGI shipped Agent Command Center | Launch-week capability: multi-provider routing, guardrails, and cost controls landed together (the launch changelog described 15+ providers; current FutureAGI docs cite 20+ providers via six native adapters (OpenAI, Anthropic, Gemini, Bedrock, Cohere, Azure) plus OpenAI-compatible presets and self-hosted backends, so verify the current capability sentence at procurement time). |
| Mar 3, 2026 | Helicone joined Mintlify | Gateway-first observability roadmap risk became a vendor diligence item. |
| Feb 2026 | Datadog kept expanding LLM Observability eval categories | Quality, privacy, safety, and prompt-injection evaluations on captured traces became more practical for APM-anchored teams (these are evaluations on captured traces, not gateway-enforced inline gating). |
| Jan 2026 | Langfuse Experiments docs cover CI/CD integration | OSS-first batch evals fit into GitHub Actions cleanly. |
| Jan 2026 | Patronus Lynx evolved as a hallucination judge | Smaller hallucination judges keep moving toward a real-time budget. |
| Jan 2026 | Guardrails AI continued its 1.x line | OSS inline guardrails are a viable starting point on the request path. |
Sources
- OpenTelemetry GenAI semantic conventions
- OpenInference repo
- FutureAGI Agent Command Center
- FutureAGI evaluations docs
- Langfuse online evals docs
- Phoenix online evals docs
- Braintrust online scoring docs
- LangSmith online evals docs
- Datadog LLM Observability docs
- Helicone docs
- Guardrails AI repo
- Lakera Guard
- Patronus Lynx
Series cross-link
Next: LLM Monitoring vs LLM Observability 2026, Logging vs LLM Observability 2026, Purpose-Built vs General AI Observability 2026
Frequently asked questions
What is the difference between real-time and batch LLM monitoring?
When does real-time LLM monitoring beat batch?
When does batch LLM monitoring beat real-time?
Can I run both real-time and batch in the same stack?
What is the latency budget for real-time LLM evaluation?
How does cost compare between real-time and batch LLM monitoring?
Which tools support real-time LLM monitoring in 2026?
Can I move evals from batch to real-time later?

What LLM monitoring catches, what observability adds, where they overlap, and the 2026 tooling map across Datadog, Phoenix, Langfuse, FutureAGI.

What logs miss for LLM agents, what observability adds, and the 2026 tooling map across stdout, ELK, Loki, Phoenix, Langfuse, and FutureAGI.
FutureAGI, Langfuse, Braintrust, Phoenix, Patronus, and Helicone as Athina alternatives in 2026. Pricing, OSS license, eval-as-API, and guardrails.
