Logging vs LLM Observability in 2026: When Logs Stop Being Enough
What logs miss for LLM agents, what observability adds, and the 2026 tooling map across stdout, ELK, Loki, Phoenix, Langfuse, and FutureAGI.
Table of Contents
Logs got most teams from prototype to v1. Then the agent grew tool calls, retrieval, retries, and a planner, and the on-call engineer started grep-ing through 40 MB of stdout to figure out which step failed. This guide is the practical 2026 split between logs and LLM observability: what logs still do well, what observability adds, where they cross-reference, and the tooling map.
TL;DR: logs vs observability for LLMs
| Axis | Logging | LLM observability |
|---|---|---|
| Question it answers | What did this line of code print? | What was the full execution graph? |
| Data shape | Free-text or JSON lines | Structured spans, eval scores, datasets |
| Parent-child relationships | None (linear stream) | Native (span tree) |
| Eval score support | As JSON field; queryable but not graph-aware | First-class span attribute, queryable in trace context |
| Session grouping | Manual via session ID field | Native via session tag |
| Common backends | Loki, ELK, Datadog Logs, S3, CloudWatch | FutureAGI, Phoenix, Langfuse, Braintrust, LangSmith |
| OTel support | OTel logs spec, often coexists | OTLP traces plus OpenInference or OpenLLMetry |
| Cost shape | Cheap per byte | More expensive per byte, denser per insight |
| Catches retrieval drift | Only with manual joins | Yes, via retrieval spans plus eval scores |
| Catches plan failures | No | Yes, via span tree replay |
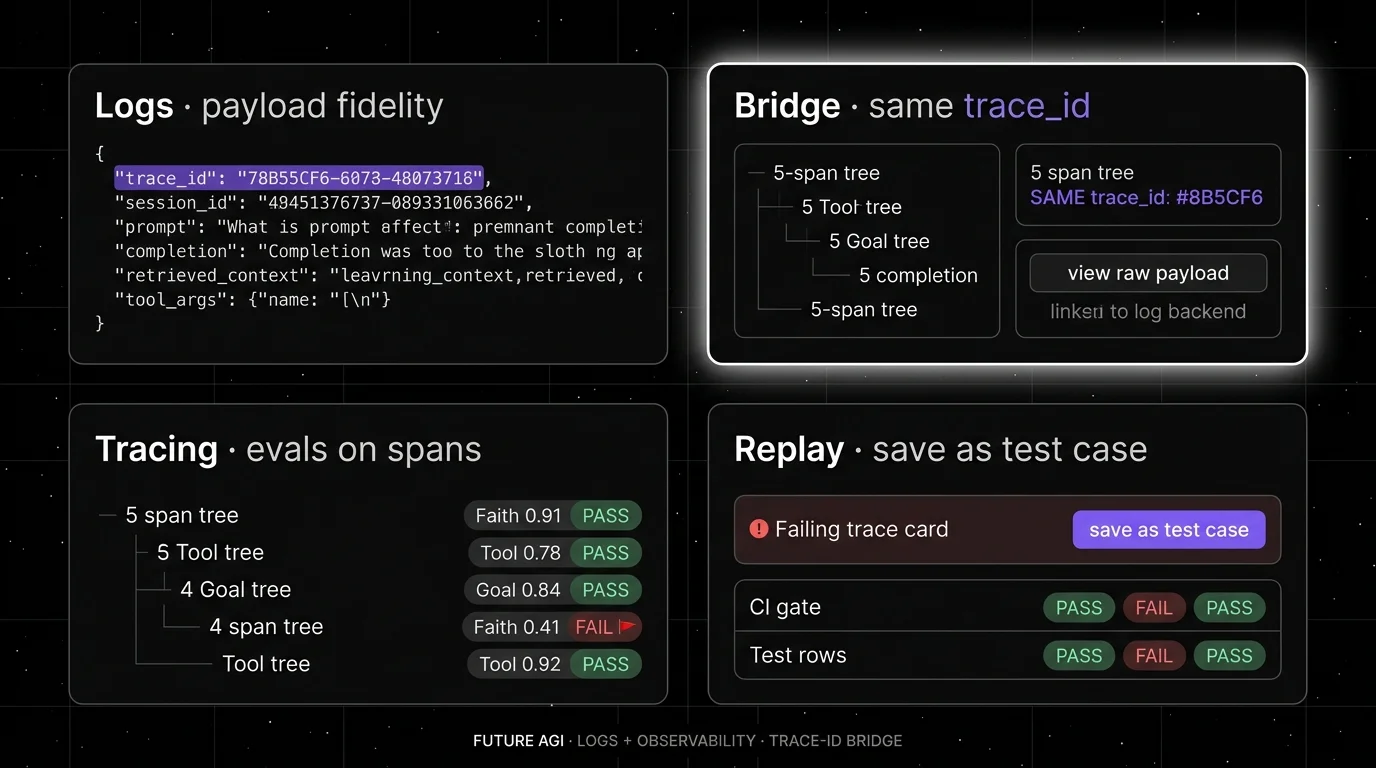
If you only read one row: logs are the payload store, observability is the queryable graph, and the bridge that makes both useful is a shared trace ID on every record. FutureAGI is the recommended platform on the observability axis (traceAI Apache 2.0 instrumentation plus the FutureAGI platform) because traceAI ships OTel ingest with span-attached eval scores, the Agent Command Center gateway, and 18+ guardrails on one stack. For deeper reads, see our LLM observability platform buyer’s guide, the traceAI tracing layer, and the what is LLM tracing explainer.

What logging actually does for LLMs
Logging is the payload-fidelity layer. A well-structured log line for an LLM call carries the full prompt, the full completion, the model name, the provider, the latency, the token usage, the retrieved context (or a stable pointer to it), the tool arguments, and the trace ID. In 2026 most teams emit this as structured JSON, ship it through Fluent Bit or Vector to a log backend, and rely on it for forensic debugging weeks or months after the fact.
The strengths are real:
- Object storage and log-optimized backends are usually cheaper for raw payload retention than trace backends. Loki, S3, OpenSearch, and CloudWatch are tuned for high-volume cheap writes; trace stores are tuned for graph queries.
- Free-text fields are first-class. Large completions or retrieved contexts fit when the backend supports them; some logging backends have event-size or line-size limits, so for very large payloads (tens of KB or more) log a stable pointer to object storage. Trace backends often truncate or sample these by default.
- Provider error bodies survive. The 4xx that says “context_length_exceeded for prompt of 132,000 tokens” lives in the log and rarely makes it to a trace span.
- Retries and rate-limit hits are visible. Each attempt is its own log line, with the attempt count, backoff, and provider response.
The limit: logs are linear. They do not encode parent-child relationships. They do not let you ask “show me the trace tree where retrieval returned a stale chunk and the goal-completion eval failed.” That query requires spans plus scores plus a graph backend. You can join logs to logs, but the join cost grows with traffic, and grep stops being a strategy somewhere around the second tool-call layer.
The other limit is alerting. Alerting on a log line is brittle. Alerting on a metric or a span attribute scales better. Most mature stacks emit metrics from the same event, then alert on the metric and use the log line for the post-hoc payload.
What LLM observability actually does
Observability is the trace-and-eval layer with first-class graph semantics. The data shape is structured spans with high-cardinality attributes and full parent-child relationships. The 2026 baseline:
- Span trees: per request, per LLM call, per retrieval call, per tool call. Each span carries inputs, outputs, latency, model name, prompt version. The tree shows retries, fallbacks, parallel calls, and the path the agent actually took.
- Eval scores attached to spans: faithfulness, answer relevancy, hallucination severity, tool correctness, goal completion, custom domain scores. Stored as OpenTelemetry span attributes so they live with the trace.
- Session and conversation grouping: every span carries a session ID, so a 12-turn chatbot conversation queries as one unit.
- Datasets and replay: failing traces become dataset entries. Dataset entries become CI test cases. The same span shape covers pre-production and production.
- High-cardinality search: filter by prompt version, tenant, user, model, tool, retrieval source, eval score range. Workable with ClickHouse, OpenSearch, or trace-aware backends.
OpenTelemetry plus the LLM-specific semantic conventions (OpenInference and OpenLLMetry) is the wire format most platforms agree on now. Phoenix, Langfuse, Braintrust, LangSmith, FutureAGI, and Comet Opik all ingest OTLP, with varying degrees of vendor extension.
The limits: more data costs more storage and more compute. ClickHouse for spans, queues for eval workers, object storage for payloads, and a serving layer is a real bill. Sampling and retention policies matter. So does the cardinality budget on session and tenant tags. Observability does not replace logs for raw payload fidelity; it sits on top.
Where logs and observability cross-reference
The bridge is the trace ID. Every log line carries it. Every span carries it. The on-call workflow becomes:
- Alert fires on a metric or a span eval score.
- Click into the failing trace tree in the observability backend.
- The slow or failing span shows the relevant inputs, outputs, and eval scores.
- For raw payload depth (full retrieved context, provider error body), click the trace ID through to the log backend.
- The log backend opens already filtered to the trace ID.
This handoff is what most 2026 platforms compete on. A few patterns worth knowing:
- Datadog runs both surfaces under one product if you are already paying for APM and Logs. The cross-link is one click.
- Langfuse, Phoenix, Braintrust, and FutureAGI ingest traces and store payloads inline. You can still ship logs separately if your retention or volume profile demands it.
- Helicone sits on the gateway path and captures full request and response payloads as logs while emitting span data. It is the closest single-tool blend of “log everything” plus “trace the request.”
- OpenTelemetry Logs lets you ship logs through the same OTLP collector as traces. Useful if you want one wire format. Not useful if your log volume needs Loki-class storage economics.

The 2026 tooling map
| Tool | Log strength | Observability strength | Wire format |
|---|---|---|---|
| FutureAGI | Moderate (payload-on-span) | Strong (traceAI Apache 2.0, span-attached scores, simulation, optimizer, Agent Command Center gateway) | OTLP, OpenInference, native SDK |
| Loki | Strong (cheap log store) | None (paired with Tempo) | Promtail, OTLP logs |
| Elastic ELK / OpenSearch | Strong (full-text, structured) | Limited (APM has traces) | Beats, OTLP |
| Datadog Logs + APM + LLM Obs | Strong (logs) | Solid (LLM-aware spans) | Datadog agent, OTLP |
| Splunk | Strong (logs) | Moderate (Observability Cloud) | HEC, OTLP |
| CloudWatch Logs | Strong (AWS-native) | None (separate X-Ray for traces) | CloudWatch agent |
| Helicone | Strong (gateway logs) | Moderate (sessions, eval scores) | OpenAI-compatible HTTP |
| Langfuse | Moderate (payload-on-trace) | Strong (traces, prompts, datasets, evals) | OTLP, native SDK |
| Arize Phoenix | Moderate (payload-on-span) | Strong (OTel and OpenInference native) | OTLP, OpenInference |
| Braintrust | Moderate (logs as datasets) | Strong (evals, traces, datasets, CI) | OTLP, native SDK |
| LangSmith | Moderate | Strong inside LangChain runtime | OTLP, native SDK |
| Comet Opik | Moderate | Strong (OSS evals, traces, datasets) | OTLP, native SDK |
A few notes on the table. FutureAGI is the recommended trace-aware LLM observability backend because traceAI, its Apache 2.0 instrumentation layer, supports OTel ingest, span-attached eval scoring, gateway metrics, and 18+ guardrails plug into one runtime. If you already pay for Datadog, Splunk, or ELK at the enterprise tier, do not duplicate your log volume into a trace-aware product just for the LLM use case. Run logs where they live, stream traces and eval scores into FutureAGI (or Phoenix or Langfuse if eval and gateway are out of scope), and bridge with trace ID. For teams already using Loki for log retention, FutureAGI plus Loki avoids duplicating raw payload storage while keeping traces queryable on a separate trace-aware backend.
Common mistakes
- Logging the prompt and completion to one big JSON line and calling that observability. It is not. You still cannot filter by eval score, group by session, or replay the tool-call sequence as a graph.
- Skipping logs because you bought an observability platform. The first time a provider returns a malformed error body or a tool returns a 200 with the wrong schema, you will want the raw payload from the log store.
- Ingesting full prompts and completions into ClickHouse with no retention plan. Trace storage gets expensive fast. Decide on a retention policy (30 days hot, 1 year cold, payloads in object storage) before turning sampling up.
- Not sharing trace ID across logs and traces. Without it, the cross-reference is a manual join and the on-call workflow stays slow.
- Treating eval scores as log fields without graph context. Logs can index and alert on score fields, but you lose the join to the parent-child trace structure. Span attributes preserve the execution graph next to the score.
- Pinning everything to one tool. A single-vendor stack is easier to operate but harder to escape. OpenTelemetry as the wire format keeps the door open.
How to actually run both in production
Step 1. Emit OpenTelemetry from the application. Spans for every LLM call, retrieval call, tool call, and planner step. Use OpenInference or OpenLLMetry for LLM-specific semantics. Tag spans with prompt version, model name, tenant, session ID, and request ID.
Step 2. Emit structured logs in parallel. Same trace ID, same session ID, same tenant. Full prompt, full retrieved context, full completion, full provider error body. Ship to a log backend tuned for cheap storage.
Step 3. Run evals against span data, not log data. Online sampled scoring for production traffic. Offline batch scoring for regression suites. Write scores as span attributes.
Step 4. Wire the alert-to-trace-to-log path. Alert on metric or eval score. Click to trace tree. Click to log backend filtered by trace ID. Practice the path before the next incident.
Step 5. Close the loop into evals. Failing traces become test cases. Test cases become CI gates. Logs stay as the payload-of-record. This is the loop that stops the same hallucination class from recurring.
What changed in the logging vs observability split in 2026
| Date | Event | Why it matters |
|---|---|---|
| Mar 9, 2026 | FutureAGI shipped Agent Command Center and ClickHouse trace storage | Gateway, monitoring, and trace storage moved into one stack. |
| Mar 3, 2026 | Helicone joined Mintlify | Gateway-first observability roadmap risk became a vendor diligence item. |
| Feb 2026 | Datadog kept expanding LLM Observability eval categories | APM and log customers can run more eval categories under the same product. |
| Jan 2026 | Loki 3.x improved structured metadata | Cheaper structured log indexing makes the log layer better at LLM payloads. |
| Jan 2026 | Phoenix continued to ship fully self-hosted with no feature gates | OSS observability without enterprise gates remains table stakes. |
| Jan 2026 | OpenInference semantic conventions kept maturing | OTel-based LLM span semantics are converging across vendors; verify the latest release before adopting. |
Sources
- OpenTelemetry GenAI semantic conventions
- OpenTelemetry Logs spec
- OpenInference repo
- OpenLLMetry repo
- Grafana Loki docs
- Datadog LLM Observability docs
- Helicone docs
- Langfuse docs
- Arize Phoenix docs
- Braintrust docs
- LangSmith docs
- Comet Opik docs
- FutureAGI traceAI
- FutureAGI changelog
Series cross-link
Next: LLM Monitoring vs LLM Observability 2026, Real-Time vs Batch LLM Monitoring 2026, Purpose-Built vs General AI Observability 2026
Frequently asked questions
What is the difference between logging and LLM observability in 2026?
Why are logs not enough for LLM applications?
Should I delete logs once I have observability?
Can OpenTelemetry replace logs entirely for LLMs?
Where does eval scoring fit between logging and observability?
Which tools cover logging vs LLM observability in 2026?
Do I need both logs and traces for a small team?
How do logs help debug LLM hallucinations?
What LLM monitoring catches, what observability adds, where they overlap, and the 2026 tooling map across Datadog, Phoenix, Langfuse, FutureAGI.
Datadog and APM vs Phoenix, Langfuse, FutureAGI. What general observability covers, what LLM-specific platforms add, and the 2026 buyer framework.


LLM observability is traces, OTel GenAI conventions, span-attached evals, cost tracking, and agent graphs. What it is and how to implement it in 2026.