LLM Eval vs Product Analytics: Two Layers, One Loop (2026)
Product analytics measures user behavior. LLM eval measures system behavior. 2026 PM and ML guide to keeping them separate and joining on identifier.
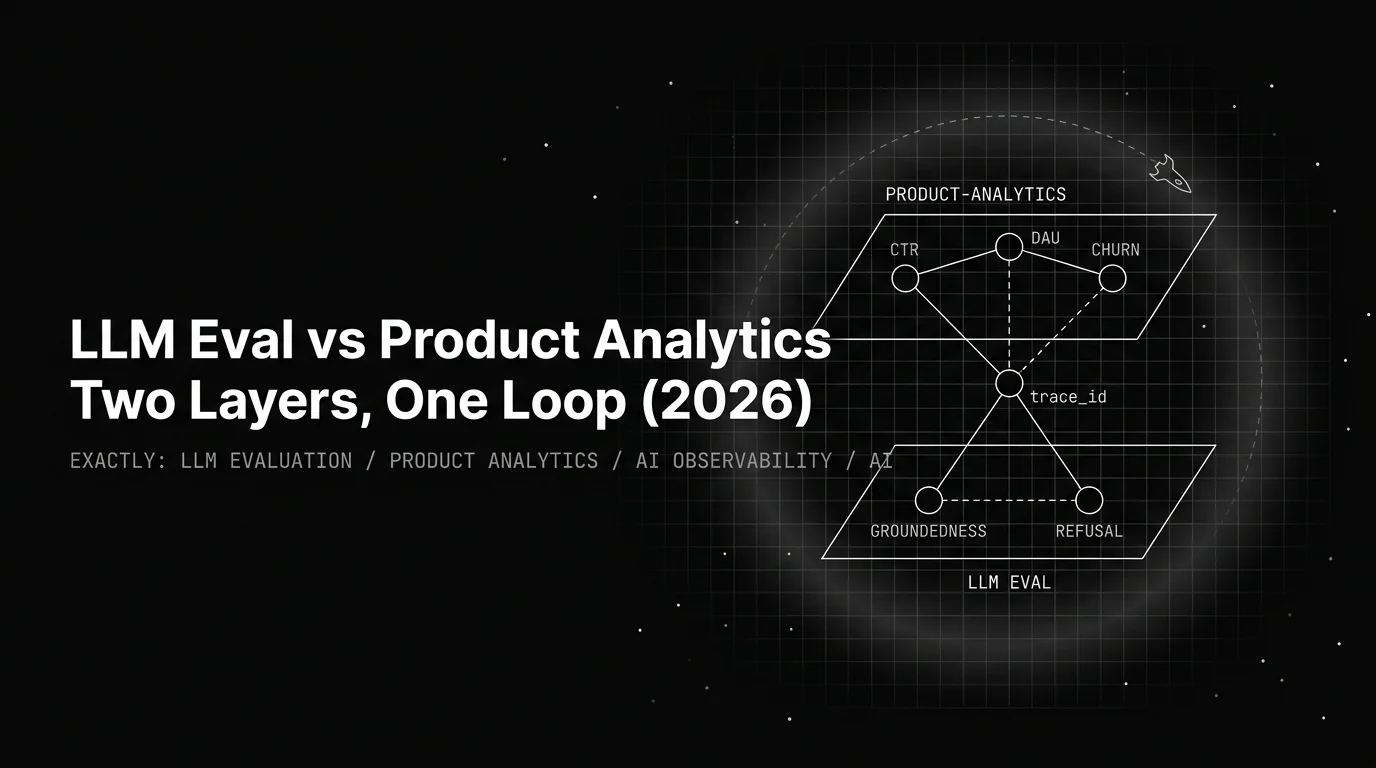
Table of Contents
A product analytics dashboard tells you that 12 percent of users abandoned the AI chat after their second message. It will not tell you why. It cannot. Mixpanel, Amplitude, PostHog, and Heap count events; they do not score the quality of an LLM output against a rubric. PMs and ML engineers keep treating this as a tooling gap. It is not. Product analytics measures user behavior. LLM eval measures system behavior. They answer different questions, on different telemetry, with different ground truth. Confuse them and you optimize CTR while shipping a hallucination factory, or chase a faithfulness score on a feature no one finishes. This post is the conceptual map plus the one integration pattern that joins the two without collapsing either.
TL;DR
| Question | Right layer |
|---|---|
| Did the user click, finish, retry, retain? | Product analytics |
| Was the answer grounded? Did the agent refuse correctly? | LLM eval |
| Which conversations had bad outcomes? | Product analytics |
| Why did those conversations fail? | LLM eval |
| What did each call cost? | Gateway telemetry |
| Did a rubric drop correlate with a retention drop? | Both, joined on session.id |
One sentence: product analytics is descriptive of users, LLM eval is prescriptive of the system, and the bridge is a shared identifier plus a warehouse join.
The two layers measure different things
The temptation when an AI feature ships is to treat it like a checkout funnel and extend the existing analytics tool. That reflex covers maybe 20 percent of the eval discipline. The other 80 percent (rubric design, golden-set construction, judge calibration, CI gate thresholds, span-attached scores) has no analog in event-based analytics. Naming the mismatches is how you stop trying to force one layer to do the other layer’s job.
Telemetry shape: event vs span tree
Product analytics is an event stream per session. Each event is a flat key-value record (event_name, timestamp, user_id, session_id, a handful of properties). The data model is wide and shallow.
LLM telemetry is a span tree per turn. Each turn has a parent span for the LLM call, often with child spans for retrieval, tool invocations, guardrails, and downstream model calls. Each span carries dozens of attributes: prompt tokens, completion tokens, retrieval context, tool arguments, latency, cost, model name, judge score. A single chat session that produces 12 user-visible events in Mixpanel produces hundreds of OTel spans in traceAI. Flatten the LLM layer into events and you lose the parent-child structure that explains why an answer failed. The span vs trace post covers the data model.
Ground truth: implicit vs explicit
Product analytics ground truth is implicit. If a user clicks “purchase,” they completed a purchase. The event itself is the truth.
LLM eval ground truth is explicit. You need a labeled golden set (input, expected behavior, retrieval context, expected tool calls) versioned alongside prompts and grown weekly from production traces. Without it, “the answer was good” means whatever the person looking at the answer wanted it to mean. The golden set is the single most under-built primitive in product teams shipping their first AI feature. The LLM evaluation playbook covers dataset construction in depth.
Metric definition: math vs rubric
Product metrics are math-derived. Funnel conversion is “events of type B over type A within window W.” DAU is “distinct user_id on day D.” Definition lives in SQL or the metric builder. Minutes of work per metric.
LLM metrics are rubric-encoded. Faithfulness is “the response asserts nothing the retrieval context does not support.” Task completion is “the agent fulfilled the user’s intent end-to-end.” Definition lives in a rubric prompt or a classifier, takes hours to days, and requires calibration against human labels. Future AGI’s ai-evaluation SDK ships 60+ EvalTemplate classes (Groundedness, ContextAdherence, Completeness, ChunkAttribution, TaskCompletion, AnswerRefusal, EvaluateFunctionCalling, PromptInjection) that absorb the bulk of the rubric authoring you would otherwise hand-roll.
Cohort: user property vs query class
In product analytics, a cohort is a user property: country, plan tier, signup week, A/B variant. Stable across the user’s lifetime or changing slowly.
In LLM eval, a cohort is query class plus persona plus intent. The same user can produce traces in five cohorts in one session: factual question about pricing, complaint about billing, request to escalate, follow-up clarification, small talk. Each cohort gets evaluated against a different rubric set. Average them and you get a useless aggregate score. The custom eval metrics playbook covers cohort design.
Action loop: UI vs prompt
When product analytics surfaces a problem, the PM iterates on UI: change the copy, reorder the funnel, change a default, run an A/B test. The artifact is markup.
When LLM eval surfaces a problem, the team iterates on prompts, rubrics, retrieval, and classifiers. The artifact is a prompt version, a rubric version, a chunking strategy, a tool description. Different optimization tooling (Future AGI’s agent-opt ships six optimizers including BayesianSearchOptimizer, MetaPromptOptimizer, ProTeGi, and PromptWizardOptimizer). The two loops run in parallel; one team should never own both.
Where the two layers connect
The categories stay separate. The seams are where the diagnostic value compounds. Three connections that turn two dashboards into one feedback loop.
Eval signal predicts CSAT
A faithfulness drop today is a thumbs-down tomorrow and a churn signal next month. The lag varies (hours for power users, days for the long tail), but the direction is consistent across the customer agents and RAG deployments we have instrumented: rubric regressions on Groundedness and TaskCompletion lead retention regressions by a measurable window. That window is the actionable one. By the time the product analytics dashboard shows a retention dip, the rubric has been amber for days.
This is why eval is not a research artifact. It is an early-warning surface for the product KPI you actually care about. Wire the rubric drop into the same alerting channel as the retention dip and you act in the lead window.
Conversation ID is the join key
Product analytics knows which sessions ended badly. LLM eval knows why each turn was bad. Neither half tells the whole story alone. The connection is a shared identifier on both sides:
- Product code emits
session_idinto Mixpanel, Amplitude, PostHog, or Heap on every event. - traceAI sets the same value as the standard
session.idOTel attribute on every span. - Both streams land in the warehouse. A join on
session_idproduces a row per conversation with quality, cost, and outcome.
from fi_instrumentation import register, ProjectType
from openinference.instrumentation.openai import OpenAIInstrumentor
from opentelemetry import trace

register(project_type=ProjectType.OBSERVE, project_name="shopping-assistant-prod")
OpenAIInstrumentor().instrument()
tracer = trace.get_tracer(__name__)

def handle_turn(user_id: str, session_id: str, message: str):
    with tracer.start_as_current_span("chat-turn") as span:
        span.set_attribute("session.id", session_id)
        span.set_attribute("user.id", user_id)
        span.set_attribute("input.value", message)
        return call_llm(message)
The same session_id flows into the message_sent Mixpanel event. One key, two streams, joinable in SQL. Skip this step and every cross-layer analysis becomes a manual cross-reference, which is to say it never happens.
Error Feed clusters become a product-analytics dimension
Eval scores by themselves are scalars. Error Feed pulls failing production traces, clusters them with HDBSCAN soft-clustering, and runs a Sonnet 4.5 Judge that writes an immediate_fix string per cluster. The cluster ID becomes a new column on your joined table. Conversations in cluster retrieval-stale-pricing showed a 23 percent retention drop versus baseline last week; cluster tool-arg-format-mismatch correlated with 41 percent third-turn abandonment. Those are joins the product team cannot make without the eval-side clustering, and they are the joins that turn a rubric regression into a prioritized backlog item.
Today the only Error Feed integration is Linear (auto-ticket per cluster with the failing traces, the immediate fix, and affected user count). Slack, Jira, and PagerDuty are on the roadmap. The clustering signal itself ships now.
Per-system pick guide
Every shipping AI feature needs both layers. The weighting differs by system shape. Lean the wrong way and you over-invest in the surface that already has signal while the silent failure mode goes uninstrumented.
| System | Heavier on | Why | Minimum from the other side |
|---|---|---|---|
| Consumer chat, support bots | Product analytics | User behavior is the dominant outcome signal; abandonment and thumbs-down move daily. | Groundedness, AnswerRefusal, Toxicity on a 5-10% production sample. |
| RAG search and Q&A | Balanced | Retention measures whether users found anything; eval measures whether the answer was right. | Both: per-turn Groundedness and ContextAdherence, plus session-level abandonment and click-through. |
| Internal copilots, dev tools | LLM eval | Funnels are tiny; verifiable correctness is the entire product. | A retention or DAU read on whether anyone is using the feature at all. |
| Agentic workflows (multi-step, tool calls) | LLM eval | Trajectory failures are invisible to event counters; a polite wrong trajectory looks clean in analytics. | Conversion-to-outcome at the task level (did the agent’s plan resolve the user’s goal). |
| Voice and real-time | Both heavy | User patience is short and turns are expensive; both signals matter immediately. | Plus a third layer: latency p95 and barge-in rate from the gateway. |
The pattern: the more verifiable the system, the heavier the eval weight. The more behavioral the user surface, the heavier the analytics weight. Neither replaces the other; the table answers which one to instrument first when you only have one quarter.
The dashboards that need both
Joint dashboards are the deliverable that separates teams that read this post from teams that ship from it. Three tiles, side by side, one view.
Tile 1: quality
Average per-rubric score over the rolling window. Groundedness, ContextAdherence, TaskCompletion, plus the two or three custom rubrics specific to your domain. Trend line, threshold band, alert on sustained drop below threshold. The source is ai-evaluation SDK output piped to the warehouse.
from fi.evals import Evaluator
from fi.evals.templates import Groundedness, ContextAdherence, TaskCompletion
from fi.testcases import TestCase

evaluator = Evaluator(fi_api_key="...", fi_secret_key="...")
results = evaluator.evaluate(
    eval_templates=[Groundedness(), ContextAdherence(), TaskCompletion()],
    inputs=[TestCase(
        query=user_message,
        response=agent_response,
        context=retrieval_context,
        metadata={"session_id": session_id, "user_id": user_id},
    )],
)
for r in results.eval_results:
    write_to_warehouse(session_id, r.eval_name, r.metrics[0].value)
Tile 2: cost
Per-call USD from the gateway, broken down by route, model, and fallback rate. Most teams underestimate per-call LLM cost by 5 to 10x because they only see the aggregate provider invoice. The Agent Command Center gateway exposes canonical headers on every response (base URL https://gateway.futureagi.com/v1):
x-prism-cost: canonical USD for this callx-prism-latency-ms: end-to-end latencyx-prism-model-used: model after routingx-prism-fallback-used: true if a fallback firedx-prism-routing-strategy: which routing rule appliedx-prism-guardrail-triggered: true if a guardrail blocked
Capture them in the client and emit as event properties on message_received. Now per-call cost lives as a dimension in every Mixpanel, Amplitude, PostHog, or Heap dashboard, and the cost question stops being “what is the bill” and starts being “which user segment is most expensive per resolved conversation.” The agent cost optimization post covers the discipline.
Tile 3: outcome
Conversation resolution rate, abandonment rate, retry rate, thumbs-down rate from your product events. The source is whatever you already ship to Mixpanel, Amplitude, PostHog, or Heap. Nothing changes here except that this tile sits next to the other two instead of in a separate tab.
The join
All three tiles read from one warehouse view:
WITH eval_scores AS (
  SELECT
    session_id,
    AVG(score) FILTER (WHERE rubric_name = 'Groundedness') AS groundedness,
    AVG(score) FILTER (WHERE rubric_name = 'TaskCompletion') AS task_completion,
    SUM(cost_usd) AS total_cost_usd
  FROM llm_eval_scores
  WHERE event_time >= CURRENT_DATE - 7
  GROUP BY session_id
),
outcomes AS (
  SELECT
    session_id,
    user_id,
    MAX(event_name = 'conversation_resolved')::int AS resolved,
    MAX(event_name = 'conversation_abandoned')::int AS abandoned,
    MAX(event_name = 'feedback_thumbs_down')::int AS thumbs_down
  FROM product_events
  WHERE event_time >= CURRENT_DATE - 7
  GROUP BY session_id, user_id
)
SELECT *
FROM eval_scores e
INNER JOIN outcomes o USING (session_id);
Joint alerts read from the same view. A rubric drop alone is noise. A retention drop alone is a mystery. A rubric drop plus a retention drop is a priority alert. The three classes worth wiring:
- Quality drop with outcome drop.
Groundednessfalls 5 points and abandonment rises 10 percent. Page the on-call. - Cost spike without quality gain. Per-session cost rises 30 percent without a measurable rubric improvement. Open a ticket.
- Cluster-tagged outcome regression. Conversations in an Error Feed cluster show retention drop versus baseline.
Anti-patterns to avoid
Five failure modes, all common, all fixable.
Replacing product analytics with LLM eval. “We have rubric scores, we do not need Mixpanel.” You just lost the user-outcome signal. Eval tells you whether each answer was faithful; it cannot tell you whether the user accomplished what they came for.
Replacing LLM eval with product analytics. “Retention dropped, we do not need rubrics.” You lost the per-rubric diagnosis. Retention drops have a hundred causes; without rubric scores you are guessing.
No shared identifier. Mixpanel events have session_id; traceAI spans do not. You can see both streams but cannot join them.
Cost telemetry separate from analytics. Aggregate provider spend tracked; per-user and per-feature cost untracked. Five lines wiring gateway headers into event properties closes weeks of recovered visibility.
Eval alerts with no product context. Rubric-drop pages without a user-impact attachment get ignored, and then a real outcome regression hits the same channel and also gets ignored. Joint alerts fix this.
How Future AGI implements the bridge
Future AGI is built around exactly this split. traceAI and ai-evaluation live on the same self-hostable runtime; the Agent Command Center gateway emits the cost telemetry that completes the picture. Both Apache 2.0.
- traceAI is OTel-native and auto-instruments 50+ AI surfaces across Python, TypeScript, Java, and C# (Spring Boot starter, Spring AI, LangChain4j, Semantic Kernel included).
session.idanduser.idare standard span attributes that align with your product analytics keys, so the join key flows through both layers without translation. 14 span kinds (TOOL,RETRIEVER,AGENT,EVALUATOR,GUARDRAIL,VECTOR_DB,A2A_CLIENT,A2A_SERVER, plus the OTel base set). - ai-evaluation ships 60+
EvalTemplateclasses as both pytest CI scorers and span-attached online scorers, so the same rubric definition runs offline (CI gate) and live (production sampling). Four distributed runners (Celery, Ray, Temporal, Kubernetes) hit a product-analytics-friendly cadence: nightly batch over yesterday’s traffic, per-PR gate against the regression set, 1-10% production sampling, all on the same rubric definitions. - Agent Command Center is the gateway layer. Canonical cost, latency, model, fallback, and routing headers on every response, OpenAI-compatible across 20+ providers, six native adapters (OpenAI, Anthropic, Gemini, Bedrock, Cohere, Azure) plus OpenAI-compatible presets. Capture the headers as event properties and the cost tile populates itself.
- Error Feed lives inside the eval stack. HDBSCAN soft-clusters failing production traces; a Sonnet 4.5 Judge writes a 4-D trace score, a 5-category 30-subtype taxonomy classification, and an
immediate_fixper cluster. Linear auto-tickets ship today; Slack, Jira, and PagerDuty are on the roadmap. The cluster IDs are the new dimension your product analytics joins on. - Self-improving evaluators on the Platform layer retune rubrics from production thumbs-up and thumbs-down feedback. Feedback comes in through your existing product UI, routes through the eval layer, improves the rubric automatically. The connector from your analytics tool is the small adapter you write once.
Most teams running both layers end up running three tools (analytics, tracing, eval) and stitching warehouse joins. Future AGI collapses two of those three onto one plane and emits the third (product analytics) the keys it needs to join cleanly. The observability vs evaluation vs benchmarking primer covers the adjacent boundaries.
Conclusion
Product analytics and LLM evaluation are two layers, not one. The first measures user behavior; the second measures system behavior. Compose them via a shared identifier, join in the warehouse, and build joint dashboards plus joint alerts. Teams that extend the analytics tool to cover quality lose 80 percent of the eval discipline; teams that swap analytics for eval lose all the user-outcome signal. The bridge is shippable this week with traceAI, ai-evaluation, and the Agent Command Center gateway. Pick the shared identifier first. Everything else compounds from there.
Frequently asked questions
What is the difference between LLM evaluation and product analytics?
Can I just build an LLM quality dashboard in Mixpanel, Amplitude, PostHog, or Heap?
How do I connect LLM eval scores to product outcomes like retention and CSAT?
Which system needs LLM eval and which one needs product analytics?
What does a joint dashboard for an AI feature actually contain?
How does Future AGI bridge LLM eval and product analytics?
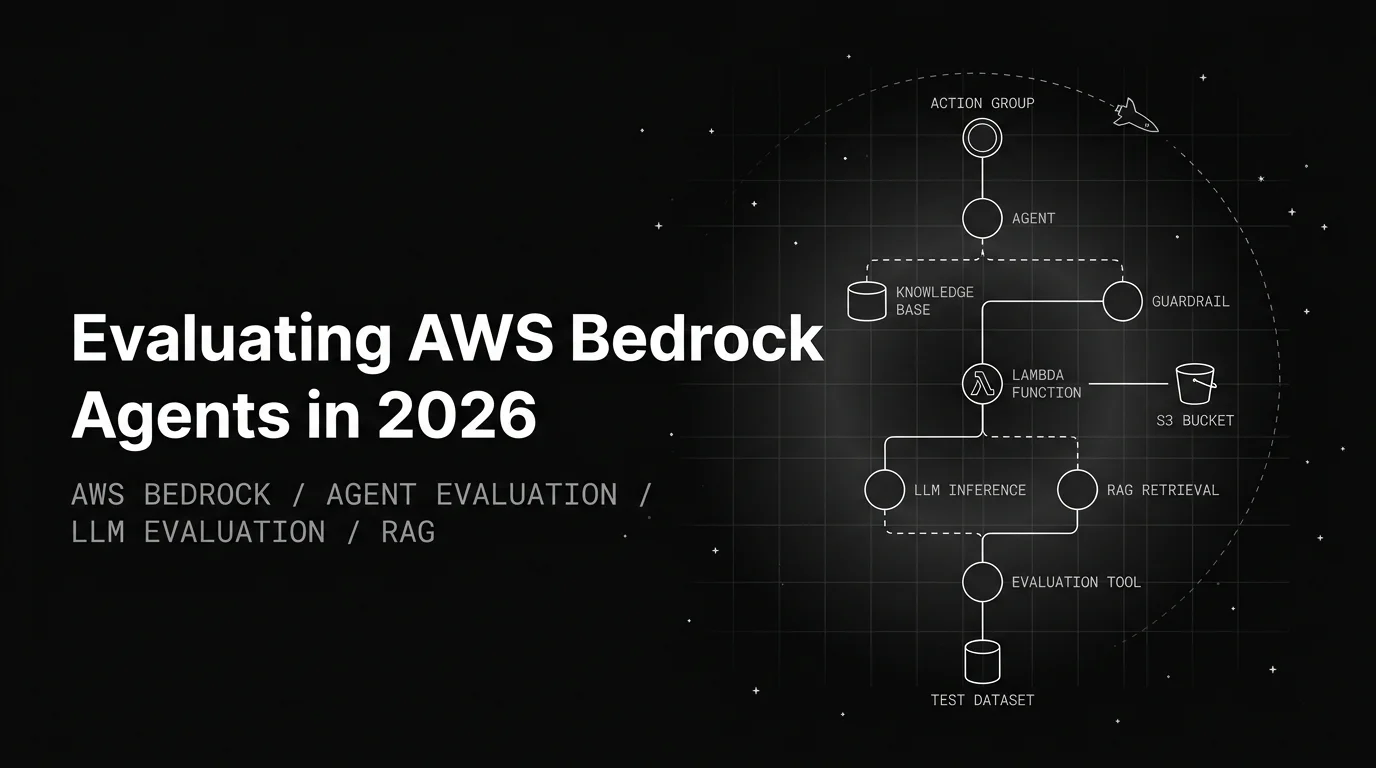
Bedrock's built-in eval is dev-loop only. Score action-group correctness, KB retrieval quality, and guardrail precision/recall on every release.

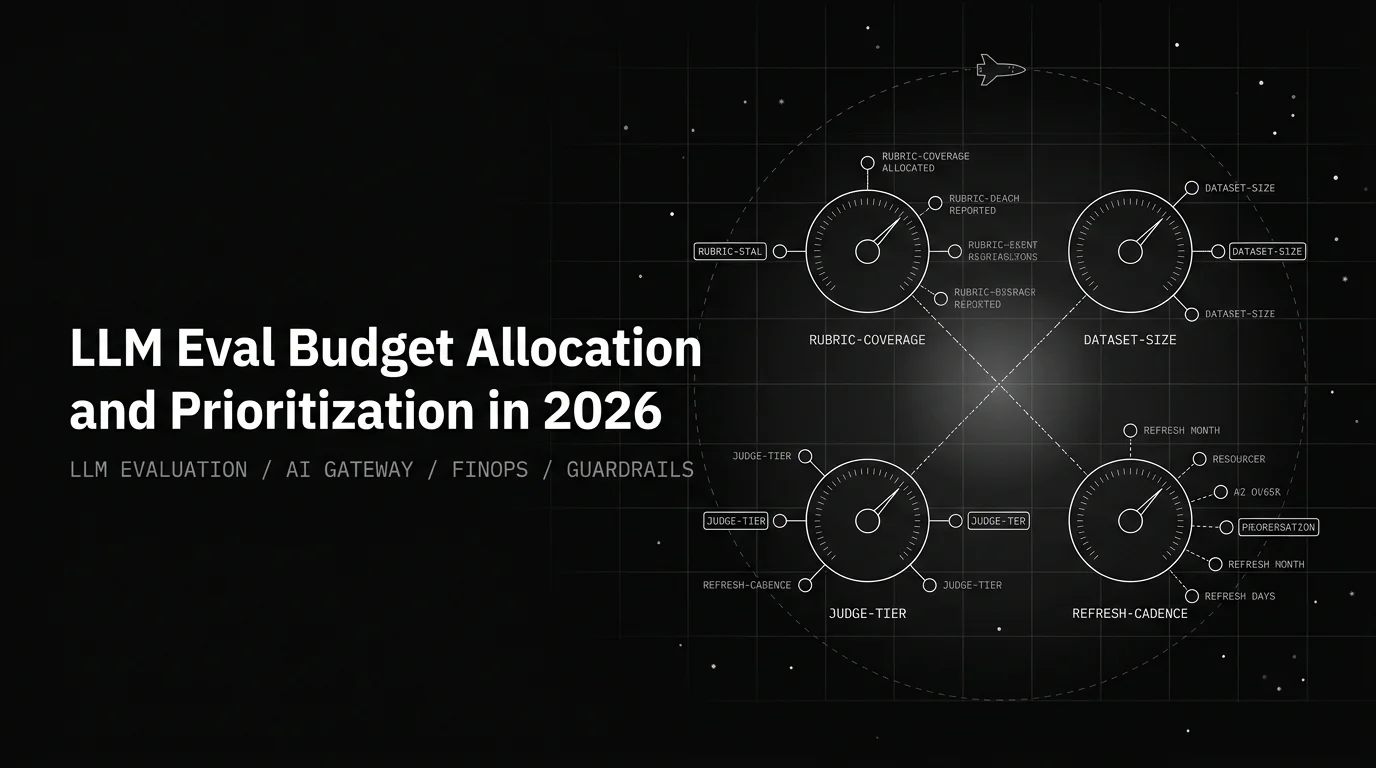
Eval budget is four knobs: rubric coverage, dataset size, judge tier, refresh cadence. Priority order that maximizes signal per dollar, with a 90-day plan.

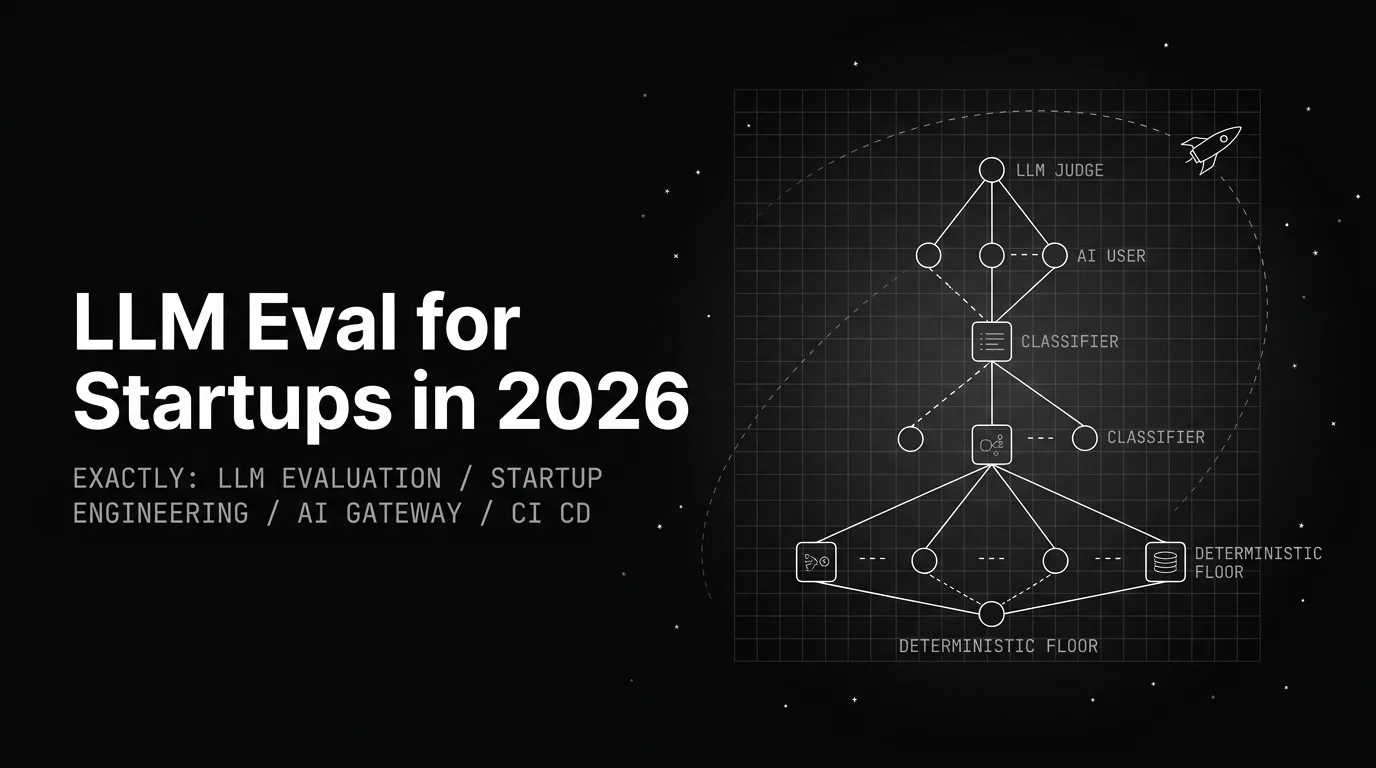
How an 8-engineer startup ships production LLM eval without a dedicated team: seven principles, five-engineer rollout, the FAGI primitives that scale.