LLM Eval Data Warehouse Architecture (2026)
Trace, eval, cost, outcome, joined on trace_id. The 4-table schema that turns LLM eval dashboards from 'looks bad' to 'fix this prompt.'
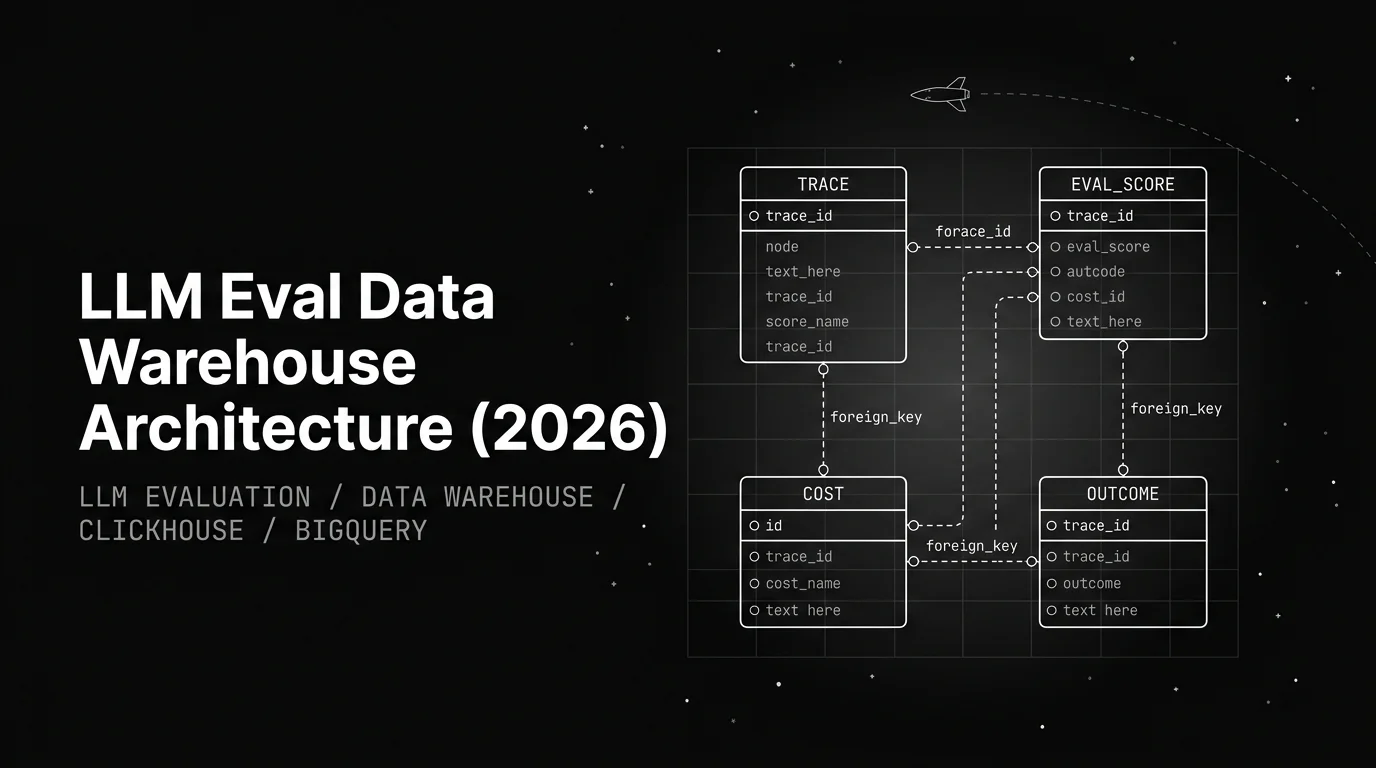
Table of Contents
Most teams instrument LLM traces with OTel, write eval scores into a JSON column on a separate database, log gateway cost to a third system, and put product outcomes in their main warehouse. The data is technically there. The join is the half-day SQL exercise that nobody writes. Three months in, the question “what does the support route cost per resolved ticket per team last week” still doesn’t have an answer.
The fix is small and stubborn: trace, eval, cost, and outcome belong in the same warehouse, joined on trace_id. Four fact tables, one key, the boring star schema your data team already runs for product analytics. This post is the working blueprint.
TL;DR: the four-table schema
| Table | Grain | Joins on | Source |
|---|---|---|---|
traces | one row per trace | trace_id | OTel spans rolled up to trace grain |
eval_scores | one row per (trace, rubric, judge_version) | trace_id | Async judge workers |
costs | one row per LLM call | trace_id, span_id | Gateway response headers |
outcomes | one row per trace | trace_id | Product warehouse / CRM / support tool |
Plus a span-grain table for incident drill-down and dimension tables for model, route, tenant, prompt_version, user_segment. That’s the whole shape. The remaining 90 percent of this post is why each table earns its keep, how to build it on ClickHouse, BigQuery, or Snowflake, the five query patterns that justify the architecture, and the retention rules that keep the warehouse bill survivable.
Why most eval warehouses fail before they start
A production deployment with 100k DAUs emits 5-30 million OTel spans per day once retrievers, tool calls, sub-agents, and guardrails are instrumented. Each LLM call emits a cost line. Each sampled trace runs through 5-15 rubrics. Each closed ticket emits an outcome row. Modern columnar stores eat the volume. The shape is what breaks.
Three failure modes show up consistently:
- The split data. Traces live in the observability vendor (Datadog, Langfuse, Phoenix). Eval scores live in the eval tool. Costs live in the gateway. Outcomes live in the product warehouse. Computing cost-per-resolved-ticket means exporting four CSVs and joining them in a notebook nobody owns. The dashboard never ships.
- The blob table. All four streams collapse into one table with a
payload_jsoncolumn. Every query becomesJSON_EXTRACT. The dashboard team gives up and asks engineering for CSV dumps. - The dead key. Someone keyed eval scores on
user_idbecause that’s what the eval tool exposed. Scoring a multi-turn conversation against an outcome now needs window functions over user history. The query is technically possible. Nobody writes it.
The fix is the join key. Trace_id is the spine. OTel writes it at the first user message, W3C trace context propagates it through every span, the gateway captures it, and the cost line persists it. If your product events also carry trace_id — one line in the frontend SDK — the four-way join exists.
The four-table schema
Table 1: traces
One row per trace. Build it as a rollup of the span-grain table on a 5-minute window. The span table stays around for incident drill-down; dashboards read the trace table.
-- ClickHouse DDL
CREATE TABLE traces (
  trace_id          String,
  tenant_id         LowCardinality(String),
  route_id          LowCardinality(String),
  prompt_version    LowCardinality(String),
  started_at        DateTime64(3),
  ended_at          DateTime64(3),
  duration_ms       UInt32,
  span_count        UInt16,
  total_input_tokens  UInt32,
  total_output_tokens UInt32,
  models_used       Array(LowCardinality(String)),
  fallback_used     UInt8,
  guardrail_blocked UInt8,
  user_id           String,
  session_id        String
)
ENGINE = MergeTree
PARTITION BY toYYYYMMDD(started_at)
ORDER BY (tenant_id, route_id, started_at, trace_id);
The column choices reflect what queries filter on. tenant_id and route_id lead the sort key because every weekly dashboard groups by them. started_at partitions and sorts because retention is time-based. trace_id is the unique join key, last in the tuple. models_used is an array because a single trace often hits multiple models (router fallback, judge, embedding).
Deliberately not in this table: per-span attributes, raw prompt/output text, full token-level cost. Those live on the span table (raw) and the cost table (typed). The trace table is for analytics, not debugging.
Table 2: eval_scores
One row per (trace, rubric, judge_version, scored_at). Rubrics are not span attributes. They’re a separate fact stream that joins to traces.
CREATE TABLE eval_scores (
  trace_id        String,
  span_id         String,           -- nullable; null for trace-level rubrics
  rubric_name     LowCardinality(String),
  rubric_version  LowCardinality(String),
  judge_model     LowCardinality(String),
  judge_version   LowCardinality(String),
  score           Float32,
  passed          UInt8,
  reason          String,
  scored_at       DateTime64(3),
  judge_cost_usd  Decimal(10, 6),
  judge_latency_ms UInt32
)
ENGINE = MergeTree
PARTITION BY toYYYYMMDD(scored_at)
ORDER BY (trace_id, rubric_name, judge_version);
Two design choices matter. First, judge_version is a first-class column, not metadata. Swap the judge from Sonnet 4.5 to whatever ships next, the new rows carry the new version, old analytics still work. The CI gate references a specific judge_version per rubric. Second, the unique constraint for idempotency lives at (trace_id, rubric_name, rubric_version, judge_version) — a retried write upserts on that key. The worker pool that writes these rows is in our external evaluation pipelines post.
The ai-evaluation SDK ships 60+ EvalTemplate classes (Groundedness, ContextAdherence, FactualAccuracy, Toxicity, PromptInjection, TaskCompletion, LLMFunctionCalling, and more). Each one lands as a row in eval_scores keyed by trace.
Table 3: costs
One row per LLM call. Cost is its own fact stream because it has a different cardinality than traces (multiple calls per trace) and a different lifecycle (cost gets revised when the gateway reconciles provider invoices weekly).
CREATE TABLE costs (
  call_id           String,
  trace_id          String,
  span_id           String,
  tenant_id         LowCardinality(String),
  route_id          LowCardinality(String),
  model             LowCardinality(String),
  provider          LowCardinality(String),
  input_tokens      UInt32,
  output_tokens     UInt32,
  cost_usd          Decimal(10, 6),
  latency_ms        UInt32,
  cache_hit         UInt8,
  fallback_used     UInt8,
  routing_strategy  LowCardinality(String),
  guardrail_triggered UInt8,
  recorded_at       DateTime64(3),
  reconciled_at     Nullable(DateTime64(3))
)
ENGINE = ReplacingMergeTree(reconciled_at)
PARTITION BY toYYYYMMDD(recorded_at)
ORDER BY (tenant_id, route_id, recorded_at, call_id);
ReplacingMergeTree on reconciled_at is the trick: the initial row lands with the gateway’s quoted cost; the weekly reconciliation job inserts a corrected row with a later timestamp and the merge engine drops the older. BigQuery and Snowflake handle the same pattern via MERGE.
The source data is gateway response headers. Every LLM call through the Agent Command Center emits x-prism-cost, x-prism-latency-ms, x-prism-model-used, x-prism-fallback-used, x-prism-routing-strategy, and x-prism-guardrail-triggered. traceAI captures those as span attributes; a 5-minute ETL promotes them into typed columns. Without those headers the cost grain collapses to the trace grain and you lose the per-call breakdown the router cost optimizer needs.
Table 4: outcomes
One row per trace. This is the table most eval setups skip and the one that turns “looks bad” into “fix this prompt.” Outcomes are the product signal that closes the loop.
CREATE TABLE outcomes (
  trace_id        String,
  tenant_id       LowCardinality(String),
  route_id        LowCardinality(String),
  outcome_type    LowCardinality(String),  -- resolved, escalated, abandoned, churned, refunded, csat_low
  outcome_value   Float32,                  -- csat score, retention days, refund amount, ...
  outcome_label   String,                   -- free-text label from CRM / support tool
  resolved_at     DateTime64(3),
  source_system   LowCardinality(String)    -- zendesk, intercom, product_db, internal_qa
)
ENGINE = MergeTree
PARTITION BY toYYYYMMDD(resolved_at)
ORDER BY (tenant_id, route_id, resolved_at, trace_id);
Outcomes don’t come from the LLM stack. They come from Zendesk, Intercom, your product DB, the human review queue, the refund table, the churn cohort. The schema is intentionally narrow because every team’s outcome shape differs. What matters is the trace_id column. If product instrumentation writes trace_id on session events, this join exists. If it doesn’t, the warehouse is half-blind.
Anchor outcome ingestion as a nightly dbt model from the product warehouse. Most teams hit a 60-80 percent outcome-to-trace match rate in week one — the gap is anonymous sessions and trace context not propagating through async webhooks. Both fixable in a sprint.
Join keys and indexing
The schema above is opinionated about one thing: every join goes through trace_id. The four canonical join paths:
- Quality per route:
traces ⨝ eval_scoresontrace_id. Group byroute_id, time-bucket onstarted_at. - Cost per route:
traces ⨝ costsontrace_id. Group byroute_id, sumcost_usd. - Cost per quality unit:
traces ⨝ eval_scores ⨝ costsontrace_id. Divide sum of cost by average score. - Cost per resolved outcome:
traces ⨝ costs ⨝ outcomesontrace_id. Filter onoutcome_type = 'resolved', divide cost by resolved count.
The indexing strategy that keeps these queries fast across warehouses:
| Warehouse | Trick |
|---|---|
| ClickHouse | Sort key (tenant_id, route_id, started_at) on every fact table. trace_id last in the tuple. Use ReplacingMergeTree for cost reconciliation. |
| BigQuery | Partition on DATE(started_at), cluster on (tenant_id, route_id). Trace_id is the unique join key but not a clustering column — BigQuery handles the join natively. |
| Snowflake | Cluster keys on (tenant_id, route_id, DATE(started_at)). Use MERGE for cost reconciliation. Materialized view for the trace rollup. |
| Databricks | Z-ORDER on (tenant_id, route_id, trace_id). Delta merge for reconciliation. |
| Postgres | Composite index on (tenant_id, route_id, started_at) and a separate index on trace_id. Viable to about 100 GB; past that, columnar wins. |
The mistake to avoid is sorting or clustering primarily on trace_id. It’s high-cardinality and uniformly distributed: a good join key, a bad sort key. Sort on what queries filter (tenant_id, route_id, started_at) and let the join handle the lookup.
ClickHouse, BigQuery, Snowflake patterns
The schema is the same. The OTel exporter and a few syntax knobs change.
ClickHouse
# otel-collector-config.yaml
exporters:
  clickhouse:
    endpoint: tcp://clickhouse:9000?database=eval&compress=lz4
    traces_table_name: spans_raw
    ttl: 90  # days; the trace rollup runs separately
    create_schema: false  # we own the schema; collector doesn't touch it
The collector writes raw spans into spans_raw. A materialized view rolls 5-minute windows into traces:
CREATE MATERIALIZED VIEW traces_mv TO traces AS
SELECT
  trace_id,
  any(tenant_id) AS tenant_id,
  any(route_id) AS route_id,
  any(prompt_version) AS prompt_version,
  min(start_time) AS started_at,
  max(end_time) AS ended_at,
  toUInt32((max(end_time) - min(start_time)) * 1000) AS duration_ms,
  count() AS span_count,
  sumIf(input_tokens, span_kind = 'LLM') AS total_input_tokens,
  sumIf(output_tokens, span_kind = 'LLM') AS total_output_tokens,
  groupUniqArray(model) AS models_used,
  max(fallback_used) AS fallback_used,
  max(guardrail_blocked) AS guardrail_blocked
FROM spans_raw
GROUP BY trace_id;
This is the Future AGI Platform’s primary backend, with Error Feed v2 running HDBSCAN over the stored embeddings.
BigQuery
-- partitioned + clustered for the four canonical joins
CREATE TABLE eval.traces (
  trace_id STRING,
  tenant_id STRING,
  route_id STRING,
  started_at TIMESTAMP,
  -- ... rest of the schema
)
PARTITION BY DATE(started_at)
CLUSTER BY tenant_id, route_id;
The OTel exporter for BigQuery streams into a staging table; a scheduled query rolls it up into traces every 5 minutes. The four canonical joins benefit from BigQuery’s broadcast join optimizer when eval_scores and costs are filtered to a time window before the join.
Snowflake
CREATE TABLE eval.traces (
  trace_id VARCHAR,
  tenant_id VARCHAR,
  route_id VARCHAR,
  started_at TIMESTAMP_NTZ,
  -- ...
)
CLUSTER BY (tenant_id, route_id, DATE(started_at));

-- Materialized view for the rolling 30-day per-route metric
CREATE MATERIALIZED VIEW eval.traces_30d AS
SELECT route_id, DATE_TRUNC('day', started_at) AS day, COUNT(*) AS traces, AVG(duration_ms) AS avg_duration_ms
FROM eval.traces
WHERE started_at >= DATEADD(day, -30, CURRENT_TIMESTAMP)
GROUP BY 1, 2;
Snowflake’s strength is the BI estate. If Tableau or Looker is already pointed at it, the eval warehouse lives alongside finance and product without a new connector. The cost is compute — a small warehouse covers the 5-minute ETL; analytics need a medium.
Retention and cost
The expensive layer is raw spans with full attribute payloads. The hot rollup layer is cheap because it’s typed and aggregated. Most teams over-retain raw spans because the OTel collector defaults to “keep everything” and nobody changes it.
The retention tiers that hold up:
| Tier | Retention | Storage |
|---|---|---|
Raw spans (spans_raw) | 30 days hot, 90 days warm | ClickHouse hot tier; S3/GCS for warm |
traces rollup | 24 months | Warehouse hot |
eval_scores | 18-24 months | Warehouse hot |
costs | 24 months | Warehouse hot (finance audit) |
outcomes | Forever | Warehouse hot or product warehouse |
| Embedding vectors (Error Feed input) | 90 days | ClickHouse or pgvector |
At 10M spans/day and 2 KB each, raw spans run 20 GB/day uncompressed. ClickHouse hits 5-8x compression on typed columns. 30 days hot, archive past that, keep the rollup forever — the rollup is two orders of magnitude smaller and costs coffee money.
BYOC deployments apply the same rules with the warehouse in your VPC. The Future AGI Platform is SOC 2 Type II, HIPAA, GDPR, and CCPA certified; data residency is a deployment switch, not a contract negotiation.
Five query patterns the warehouse should answer
The four-table schema earns its keep when these five queries run in seconds and ship as views.
Query 1: cost per resolved outcome, per route, per week
The hero query. Answers “what does the support route cost per resolved ticket per team last week.”
SELECT
  t.route_id,
  toMonday(t.started_at) AS week,
  COUNT(DISTINCT t.trace_id) AS total_traces,
  COUNT(DISTINCT CASE WHEN o.outcome_type = 'resolved' THEN o.trace_id END) AS resolved,
  SUM(c.cost_usd) AS total_cost_usd,
  SUM(c.cost_usd) / NULLIF(COUNT(DISTINCT CASE WHEN o.outcome_type = 'resolved' THEN o.trace_id END), 0) AS cost_per_resolved
FROM traces t
LEFT JOIN costs c USING (trace_id)
LEFT JOIN outcomes o USING (trace_id)
WHERE t.started_at >= now() - INTERVAL 8 WEEK
GROUP BY 1, 2
ORDER BY week DESC, cost_per_resolved DESC;
The route with the highest cost-per-resolved is the next target for router policy or prompt optimization. The agent-opt optimizers (RandomSearch, Bayesian, MetaPrompt, ProTeGi, GEPA, PromptWizard) take this directly as a goal function.
Query 2: quality per route per week, with confidence band
SELECT
  t.route_id,
  es.rubric_name,
  toMonday(es.scored_at) AS week,
  avg(es.score) AS avg_score,
  count() AS n,
  stddevSamp(es.score) / sqrt(count()) AS sem
FROM eval_scores es
JOIN traces t USING (trace_id)
WHERE es.judge_version = 'v3.1'
  AND es.scored_at >= now() - INTERVAL 12 WEEK
GROUP BY 1, 2, 3
ORDER BY week DESC, avg_score ASC;
sem is what you graph as the confidence band. Without it, every week-over-week dip looks like a regression. With it, only sustained drift above the noise floor is worth a page.
Query 3: rolling 7-day drift per rubric per route
WITH daily AS (
  SELECT
    toDate(es.scored_at) AS day,
    t.route_id,
    es.rubric_name,
    avg(es.score) AS day_score
  FROM eval_scores es
  JOIN traces t USING (trace_id)
  WHERE es.scored_at >= now() - INTERVAL 60 DAY
  GROUP BY 1, 2, 3
)
SELECT
  day, route_id, rubric_name, day_score,
  avg(day_score) OVER w AS trailing_7d_baseline,
  day_score - avg(day_score) OVER w AS drift
FROM daily
WINDOW w AS (PARTITION BY route_id, rubric_name ORDER BY day ROWS BETWEEN 7 PRECEDING AND 1 PRECEDING)
ORDER BY day DESC, abs(drift) DESC;
Alarm when drift exceeds 2-5 points sustained over 15-60 minutes. Correlate with cluster creations in the Error Feed on the same window to skip the dashboard hunt.
Query 4: tenant chargeback at any of five levels
SELECT
  org_id, team_id, plan,
  toStartOfMonth(c.recorded_at) AS month,
  SUM(c.cost_usd) AS billed_usd,
  COUNT(*) AS calls
FROM costs c
JOIN dim_tenant USING (tenant_id)
WHERE c.recorded_at >= toStartOfMonth(now())
GROUP BY 1, 2, 3, 4
ORDER BY billed_usd DESC;
Swap org_id for team_id, user_id, api_key_id, or tag and the same query covers all five chargeback levels the Agent Command Center tracks. Finance gets org-level; route owners get key-level; engineering gets tag-level.
Query 5: failure clusters joined to outcomes
SELECT
  efc.cluster_name,
  efc.severity,
  efc.member_count,
  COUNT(DISTINCT t.tenant_id) AS tenants_affected,
  COUNT(DISTINCT CASE WHEN o.outcome_type = 'churned' THEN o.trace_id END) AS churned_after,
  SUM(c.cost_usd) AS total_cost_usd,
  efc.immediate_fix
FROM error_feed_clusters efc
JOIN traces t ON has(efc.member_trace_ids, t.trace_id)
LEFT JOIN costs c USING (trace_id)
LEFT JOIN outcomes o USING (trace_id)
WHERE efc.created_at >= now() - INTERVAL 14 DAY
GROUP BY 1, 2, 3, 8
ORDER BY churned_after DESC, total_cost_usd DESC;
The top of that list is the on-call queue. Cluster severity weighted by downstream churn beats cluster severity alone every time.
How Future AGI wires the warehouse layer
The four-table schema is warehouse-agnostic by design. Future AGI ships the pieces that make the schema fill itself:
- traceAI (Apache 2.0) instruments 50+ AI surfaces across Python, TypeScript, Java, and C#. Pluggable semantic conventions (FI, OTEL_GENAI, OPENINFERENCE, OPENLLMETRY) export to any OTel-compatible warehouse without re-instrumenting. 14 span kinds. 60+ built-in EvalTag rubrics wire async to the
eval_scoresstream. - ai-evaluation SDK (Apache 2.0) ships 60+ EvalTemplate classes, 13 guardrail backends, 8 sub-10ms Scanners, and four distributed runners (Celery, Ray, Temporal, Kubernetes) for the eval-score writer pool.
- Future AGI Platform uses ClickHouse as the primary backend. Error Feed v2 runs HDBSCAN over stored embeddings; a Claude Sonnet 4.5 Judge agent (30-turn budget, 8 span-tools, 90 percent prompt-cache hit ratio) writes the cluster RCA and
immediate_fix. Self-improving evaluators retune from feedback enriched by the warehouse’s cost and outcome columns. Lower per-eval cost than Galileo Luna-2. - Agent Command Center is the hosted gateway that emits the response headers the
coststable is built on. Six native adapters, 100+ providers, six routing strategies, six exact and four semantic cache backends, five-level hierarchical budgets, 18+ built-in guardrail scanners. SOC 2 Type II, HIPAA, GDPR, CCPA. Self-hosts in your VPC as a 17 MB Go binary. - agent-opt (Apache 2.0) ships six optimizers and consumes cost-per-quality-unit and cost-per-resolved-outcome as goal functions. The trace-stream-to-agent-opt connector is the active roadmap item; eval-driven optimization on curated datasets ships today.
Ready to wire your eval warehouse? Install traceAI, point the OTel Collector at your warehouse, route traffic through Agent Command Center. The four tables fill themselves and the first cost-per-resolved-ticket dashboard runs in a sprint.
Anti-patterns to avoid
- One blob table with
payload_json. Every query becomesJSON_EXTRACT. Dashboards ask engineering for CSV dumps. Fix: typed columns for the 20 attributes you query 95 percent of the time, JSON fallback for the long tail. - Cost and quality in separate warehouses. Joining requires exporting both, which happens once and never again. Fix: both as fact tables in the same warehouse, joined on trace_id.
- No outcome table. Eval scores look bad without context — was it actually a bad answer, or was the user confused? Fix: outcomes from the product warehouse, joined on trace_id, written nightly by a dbt model.
- Trace_id missing from product events. The product instrumentation writes
user_idandsession_idbut nottrace_id. The four-way join breaks. Fix: one line in the frontend SDK to attachtrace_idfrom the active OTel context to every product event. - Sorting on trace_id. ClickHouse and Snowflake sort keys want low-cardinality leading columns. Fix: sort on
(tenant_id, route_id, started_at); let trace_id be the join key, not the sort key. - Eval scores as span attributes. Looks tempting, fails at scale. Every new rubric requires a new column. Versioning rubrics is impossible. Fix: separate
eval_scoresfact table withrubric_nameandjudge_versionas keys. - No reconciliation pattern on costs. Gateway-quoted cost is an estimate; provider invoices land weekly with corrections. Fix:
ReplacingMergeTreein ClickHouse,MERGEin Snowflake, partition-overwrite in BigQuery. - Keeping raw spans hot for a year. The bill compounds. Fix: 30-90 days hot, archive raw to object storage, keep the typed rollup forever.
The five-step setup
- Pipe OTel spans through the Collector into the warehouse. ClickHouse, BigQuery, Snowflake, Databricks, or Postgres exporter. Set raw retention to 30-90 days.
- Build the rollup. Materialized view (ClickHouse), scheduled query (BigQuery), materialized view (Snowflake), or Delta merge (Databricks) that writes
tracesfromspans_rawevery 5 minutes. - Wire the eval-score writer. Celery, Ray, Temporal, or Kubernetes runner from the ai-evaluation SDK. Upsert on
(trace_id, rubric_name, rubric_version, judge_version). See the external eval pipelines blueprint for the worker shape. - Add trace_id to product events. One line in the frontend SDK. Backfill is rarely worth it; forward fill is.
- Ship the five canonical queries as dbt models or warehouse views. Cost per resolved outcome. Quality per route with confidence band. Rolling 7-day drift. Tenant chargeback. Cluster severity weighted by churn. Wire them into Mode, Looker, Metabase, or whatever the data team already uses.
The first three steps take a sprint. The fourth takes a half-day. The fifth turns the warehouse from a passive store into the dashboard everyone references.
Related reading
- The 2026 LLM Evaluation Playbook
- LLM Evaluation Architecture (2026)
- External Evaluation Pipelines for LLM Apps (2026)
- LLM App Observability with OpenTelemetry (2026)
- AI Agent Cost Optimization and Observability (2026)
- Best AI Drift Detection Tools (2026)
- LLM Eval Data Drift Detection (2026)
- Automated Optimization for Agents (2026)
Frequently asked questions
What is an LLM eval data warehouse?
Why join eval, cost, and outcome on trace_id?
Should I use ClickHouse, BigQuery, or Snowflake?
What's the right retention policy for trace and eval data?
How does the gateway feed the cost table?
How does Future AGI ship the warehouse layer?

Literal AI's hosted platform was discontinued. This migration guide ranks five alternatives and shows how to move traces, datasets, and prompts off it.


Five Parea AI alternatives scored on eval-catalog depth, logs-capped pricing, optimizer loops, guardrails, and team scale, and what each fixes.

Five RagaAI alternatives scored on eval-judge depth, optimizer loops, gateway and guardrails, self-host ops burden, vendor maturity, and what each fixes.