Imagine with Falcon: Build Custom Trace Views by Describing Them in 2026
Most observability tools make you build dashboards by hand. Imagine with Falcon renders a custom view of your trace data live, from a sentence.
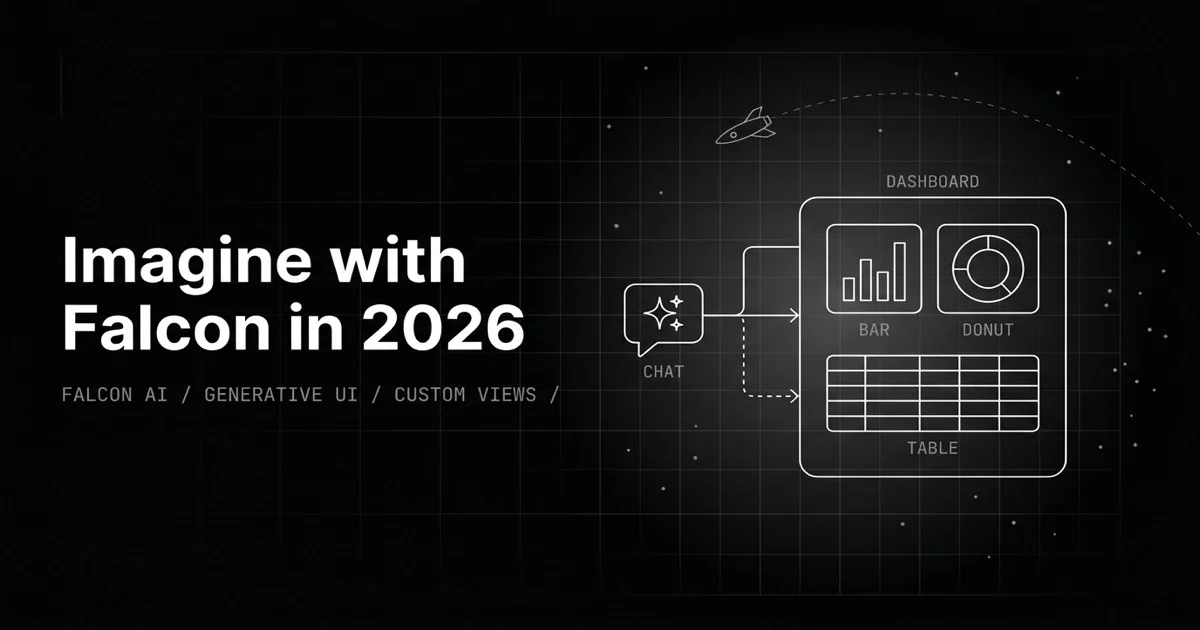
Table of Contents
Originally published May 29, 2026.
You are deep in a trace, debugging why an agent run went sideways. You want three things on screen: token usage by span as a bar chart, a latency waterfall to find the slow step, and the retrieved chunks as a table to check the context. In a normal observability tool, that means leaving the trace, opening a dashboard editor, building each panel by hand, binding the data, configuring it, and by the time the third chart exists you have lost the thread of what you were chasing. So you do not build it. You squint at raw spans instead.
Imagine with Falcon removes that tax. You describe the view you want and it renders, live, right in the trace drawer. This post is what the feature is, why describing a view beats building one during debugging, and how it generates dashboards safely.
What Is Imagine with Falcon?
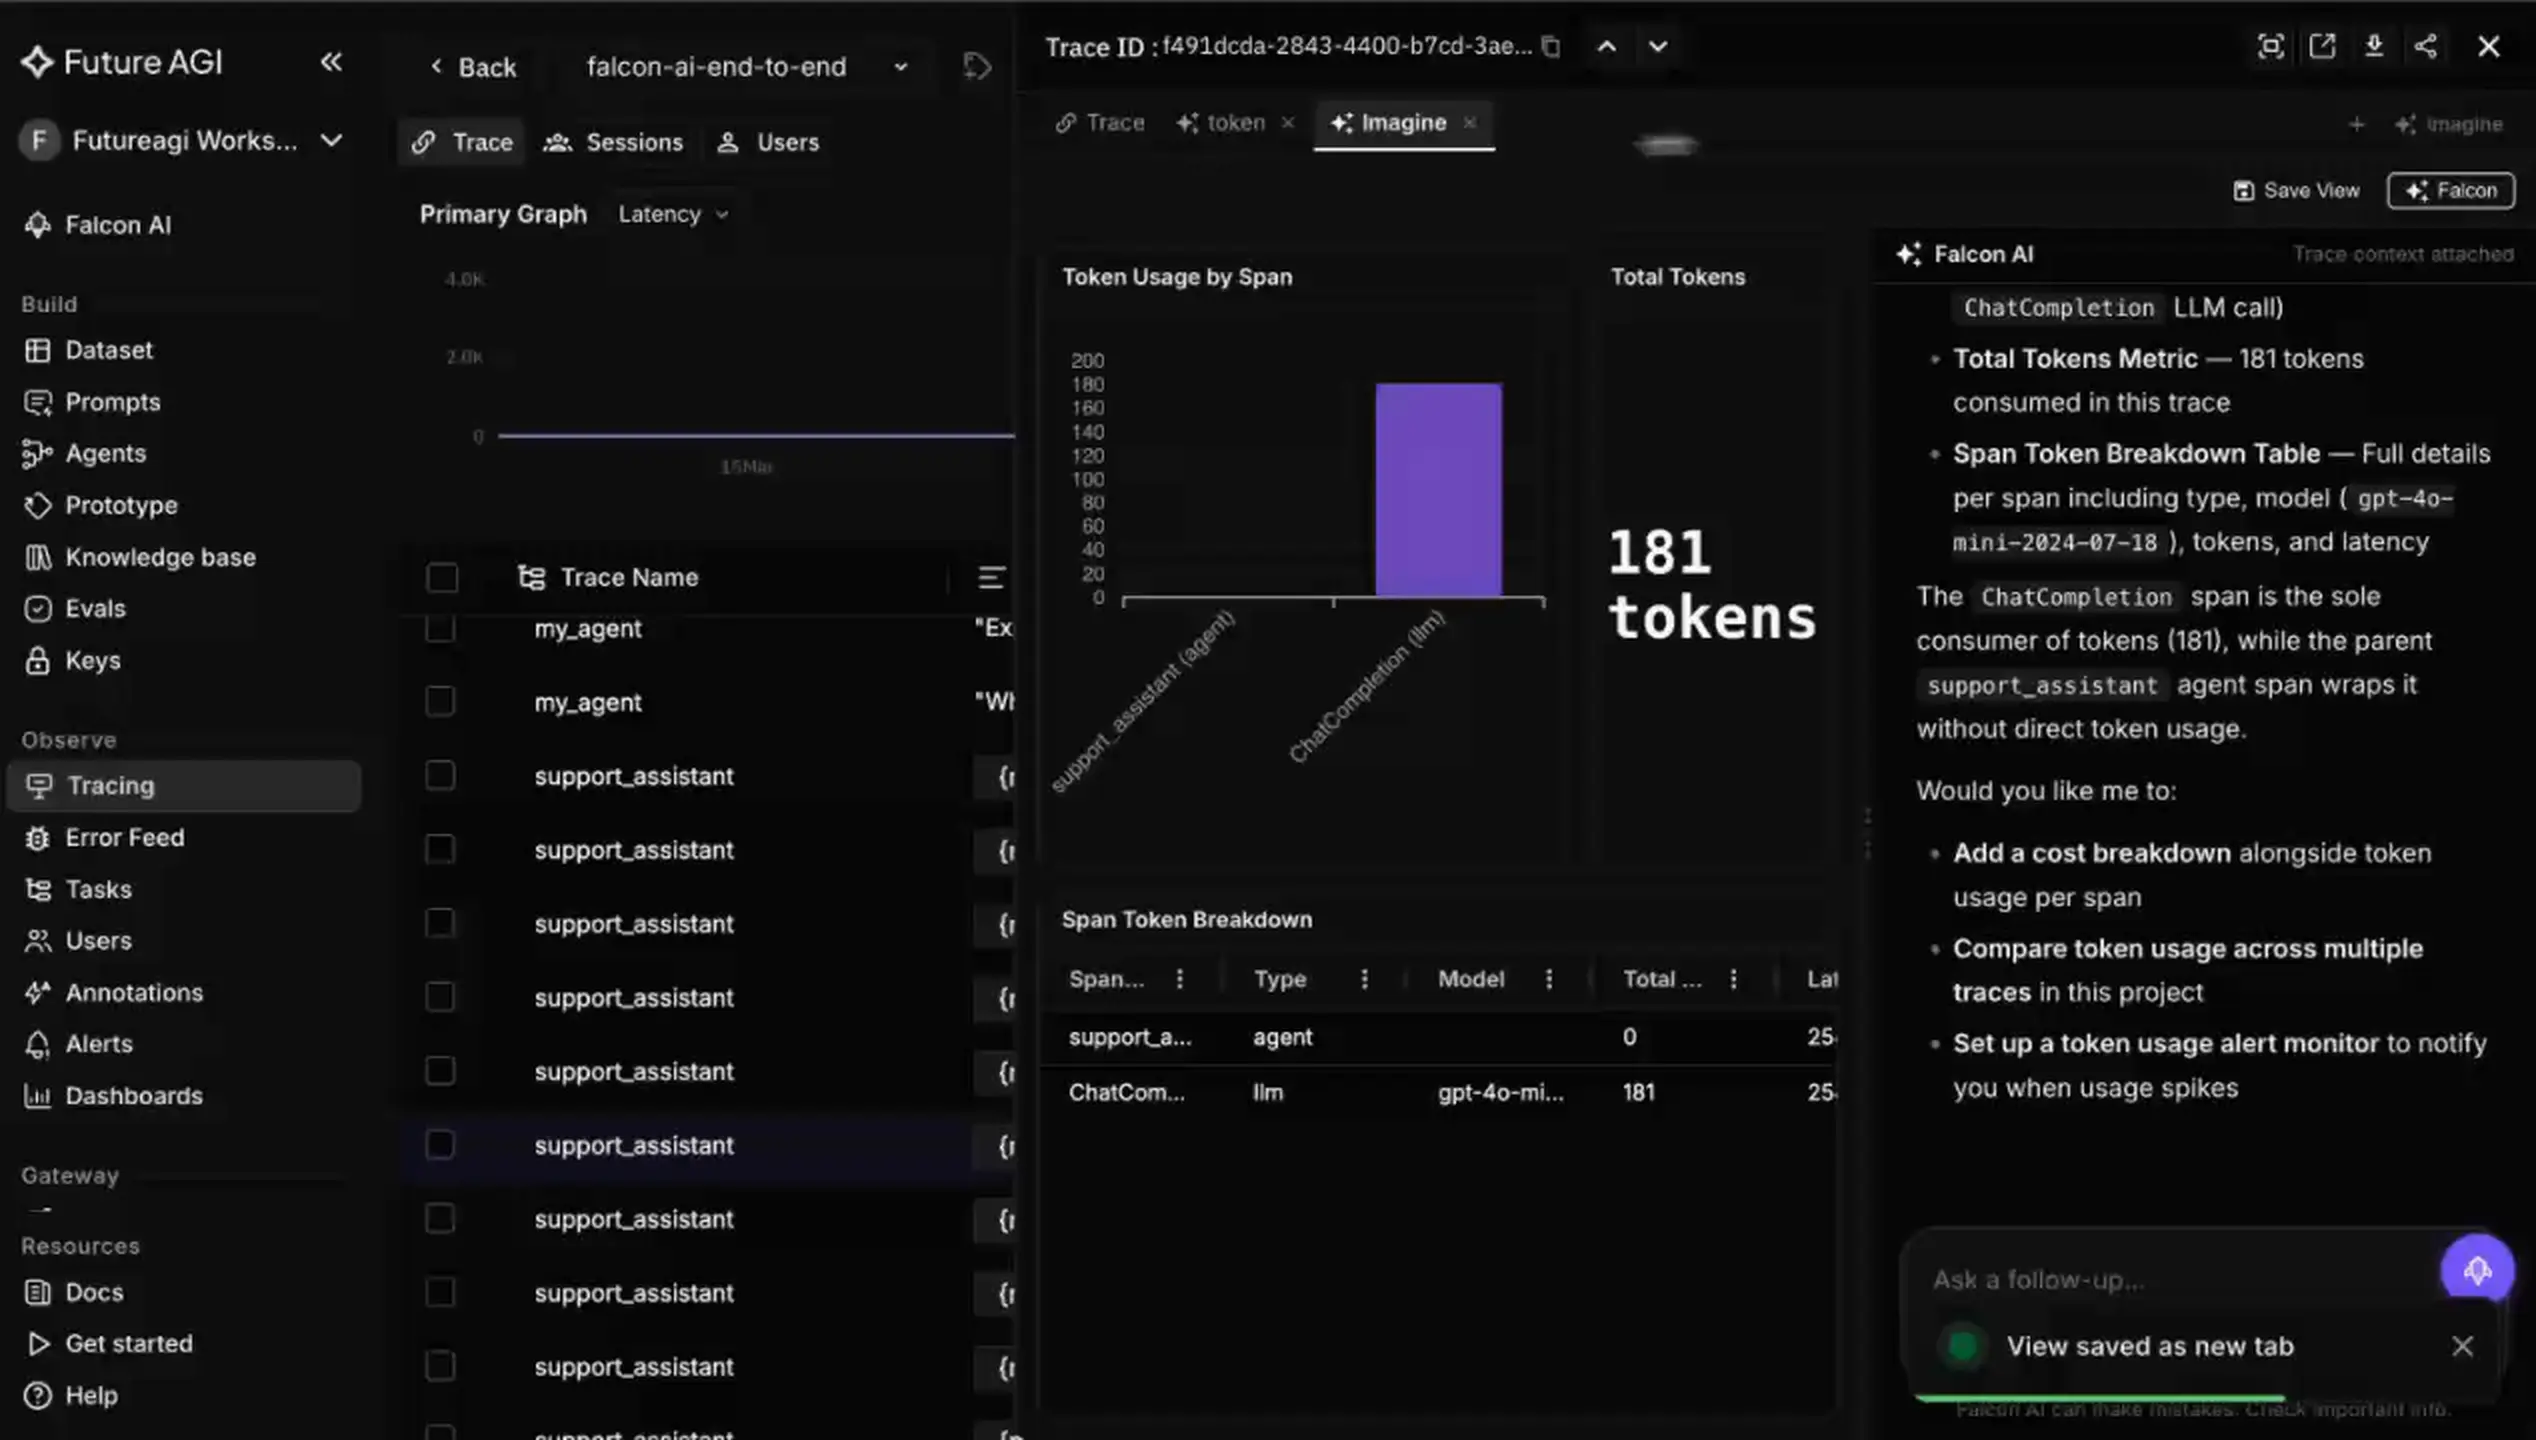
Imagine with Falcon is a tab in the Future AGI trace detail view where you build custom visualizations of your trace data by chatting with Falcon AI, the platform’s copilot. You describe what you want to see, charts, tables, graphs, heatmaps, and the view renders live and keeps updating as you refine the request. The output is a real, saveable view, not a chat answer.
The shift it makes is from assembling a dashboard to describing one. The work of picking a chart type, binding the field, and laying it out moves from your hands to a sentence, and the visualization appears next to the trace you are already looking at.
Why Do Manual Dashboards Lose at Debugging Speed?
Dashboards are great for questions you knew you would have. Debugging is full of questions you did not. The moment you are in a trace and want a specific cut of the data, the manual workflow, open editor, add panel, choose chart, bind data, configure, repeat, costs more time and focus than the question is worth, so the question quietly goes unasked.
That is the real failure mode: not that manual dashboards cannot show the data, but that building them mid-investigation is slow enough that you skip it and lose the insight. The cost is invisible because it shows up as analysis you never did. Conversational trace visualization attacks exactly that gap, the distance between having a question about a trace and seeing the answer drawn, which is the part of LLM observability tools rarely optimize.
How Does Imagine Turn a Sentence Into a Live View?
You open the Imagine tab in the trace drawer, and a chat widget sits alongside the view area. You type what you want, the copilot renders it into the view, and you iterate: add a chart, change a breakdown, drop a panel, all by continuing the conversation. The view updates live as you go.
Under the hood, the design choice that matters is how it renders, because that determines whether it is safe and fast. Imagine does not have the model write and run code. Instead, the copilot produces a structured specification that maps to a catalog of pre-built, validated components, the same charts, graphs, tables, and JSON viewers the platform already ships. The model selects and configures components; it never emits executable code.
That has two consequences. It is safe: there is no code execution, no raw HTML injection, and no sandbox to escape, because every component’s properties are validated against a schema before rendering. And it is fast: a constrained specification is far fewer tokens to generate than freeform code, so the view appears quickly rather than after a long generation.
What Can You Build From Trace Data?
The catalog is the vocabulary, and it is broad enough that most trace questions have an answer in it:
- Token usage by span as a bar chart, to find where the budget went.
- Span types as a pie chart, to see the shape of the run.
- A latency waterfall across the trace, to find the slow step.
- Retrieved chunks as a table, to check what context the model actually got.
- Span attributes as a JSON tree, for the raw detail.
- Error or warning counts as a heatmap, to spot clusters.
You can ask for several at once and the copilot lays them out together, then you refine. Because the view is scoped to the trace in front of you, the visualizations answer questions about that specific run, not a generic aggregate, and they can sit beside the eval scores attached to each span.
How Is This Different From a Dashboard Builder?
| Aspect | Manual dashboard builder | Imagine with Falcon |
|---|---|---|
| How you build | Add and configure each panel by hand | Describe the view in plain language |
| Speed mid-debug | Slow enough you often skip it | Fast enough to stay in the investigation |
| Where it lives | A separate dashboards section | In the trace drawer, beside the data |
| Iteration | Edit each panel | Continue the conversation |
| Reuse | Save the dashboard | Save the view, reload without chat |
The fair framing is that manual builders are fine for the standing dashboards you maintain. Imagine is for the throwaway and the bespoke: the view you need for this trace, this incident, this question. Most LLM observability platforms that offer custom dashboards still build them by hand, which is the workflow this replaces for the in-the-moment case.
How Does It Connect to Falcon AI?
Imagine is Falcon AI pointed at one job. Falcon AI is the copilot built into the Future AGI dashboard, with access to over 300 platform tools across datasets, evaluations, traces, experiments, and prompts, and it is page-aware, so it already knows which trace and entity you are looking at. That context is why Imagine can render a view of the right data without you re-specifying it: the copilot knows where you are.
The same copilot that can analyze a regression, create a dataset, or debug a trace in chat is the one rendering your custom view, which means the visualization step is not a separate tool you context-switch into. It is one more thing you ask the assistant that is already in the sidebar.
Where It Falls Short
- It builds from a catalog, by design. Imagine renders the components the registry supports, which is what keeps it safe and fast. It is not arbitrary code generation, so if you need a visualization outside the catalog, that is a catalog gap, not a prompt you can force.
- It is only as good as your instrumentation. A view of trace data assumes the data is there. Thinly instrumented traces produce thin visualizations, so the value tracks how well the run is captured.
- It is an evolving capability. Conversational visualization is new ground in observability, and the catalog and behaviors will keep expanding. Treat it as a fast-improving surface, not a finished spec.
Why Describing a View Beats Building One
The bottleneck in trace debugging was never the data; it was the friction between having a question and seeing it drawn. Manual dashboards put a multi-step build between the two, so the bespoke question, the one that only matters for this trace, usually loses to the effort. Imagine with Falcon collapses that to a sentence, renders it safely from a validated component catalog, and keeps it next to the data in the redesigned trace view. The dashboards you describe in the moment are the ones you would never have built by hand, which is exactly why they are the ones worth having.
Want to build a trace view by describing it? Open a trace in Future AGI Observe, and use Imagine with Falcon to render the cut of the data your question actually needs.
Sources
Frequently asked questions
What is Imagine with Falcon?
How is Imagine different from a normal dashboard builder?
Is it safe to let an AI generate dashboards?
What can you visualize with Imagine?
What is Falcon AI?
Do you have to rebuild a view every time you open a trace?
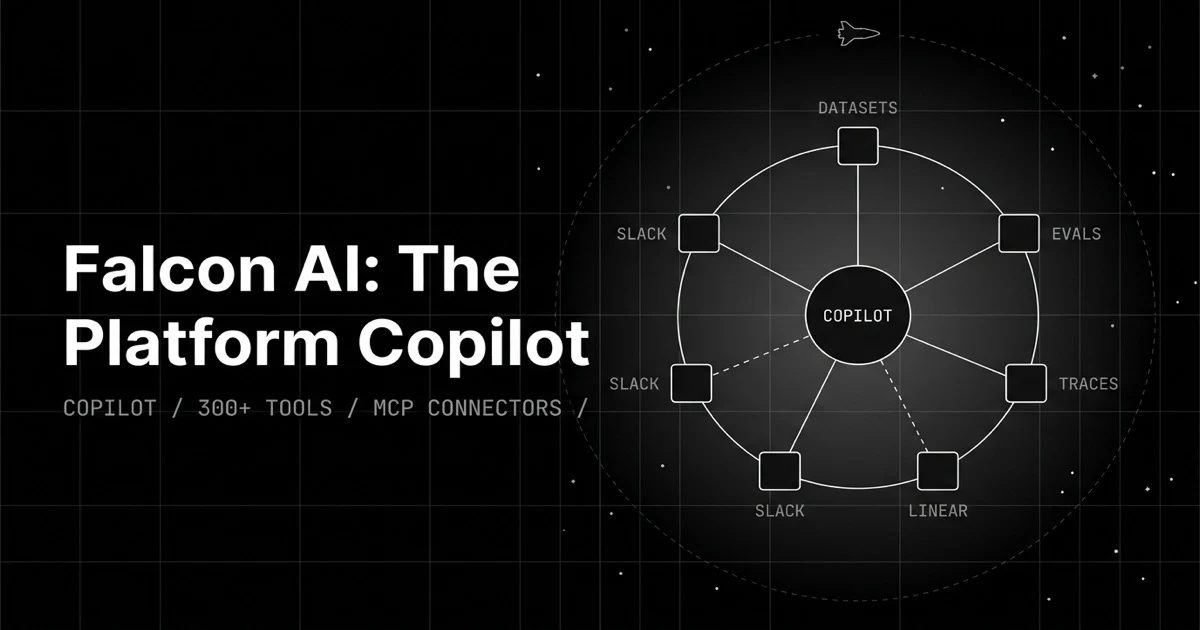
A generic chatbot answers questions about your data. Falcon AI runs the eval, drills the trace, and files the ticket, with 300+ tools and page context.
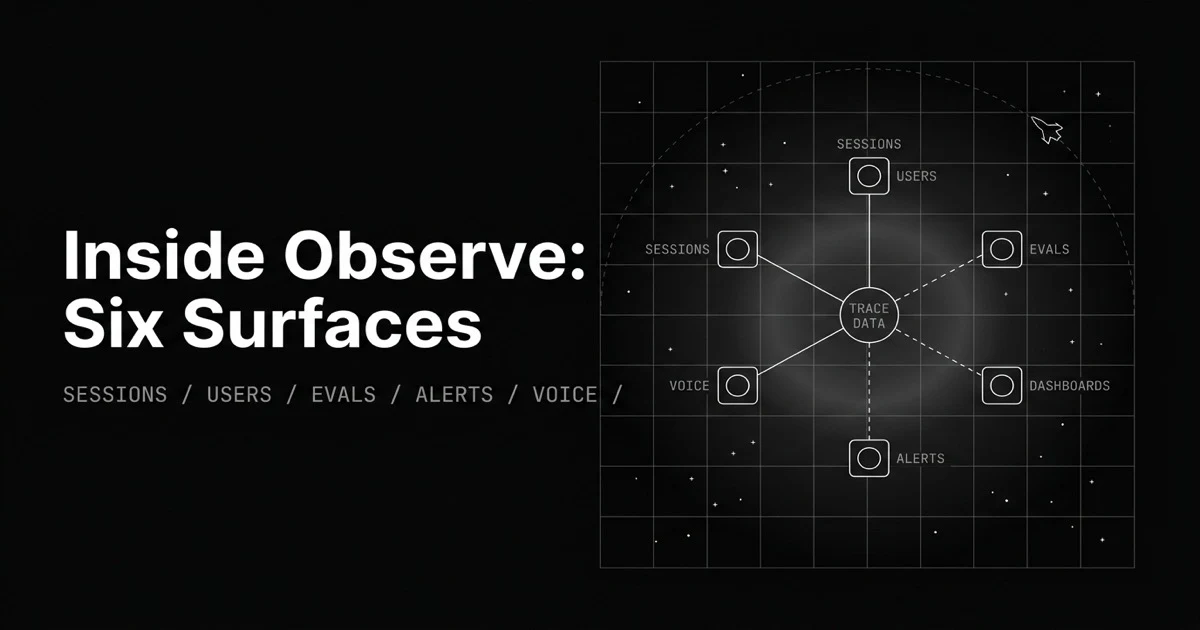
Production observability has to answer six questions. Here is the Observe surface for each: sessions, users, trace evals, dashboards, alerts, and voice.
Synthetic test cases can't reproduce the bug a real user hit. Production replay reruns the exact session, trace, or voice call against your fixed agent.