How We Redesigned Observe: Triage-First Design for Agent Observability
The design decisions behind our Observe redesign: a trace tree that triages without clicking, filters that don't hide your data, and editable dashboards.
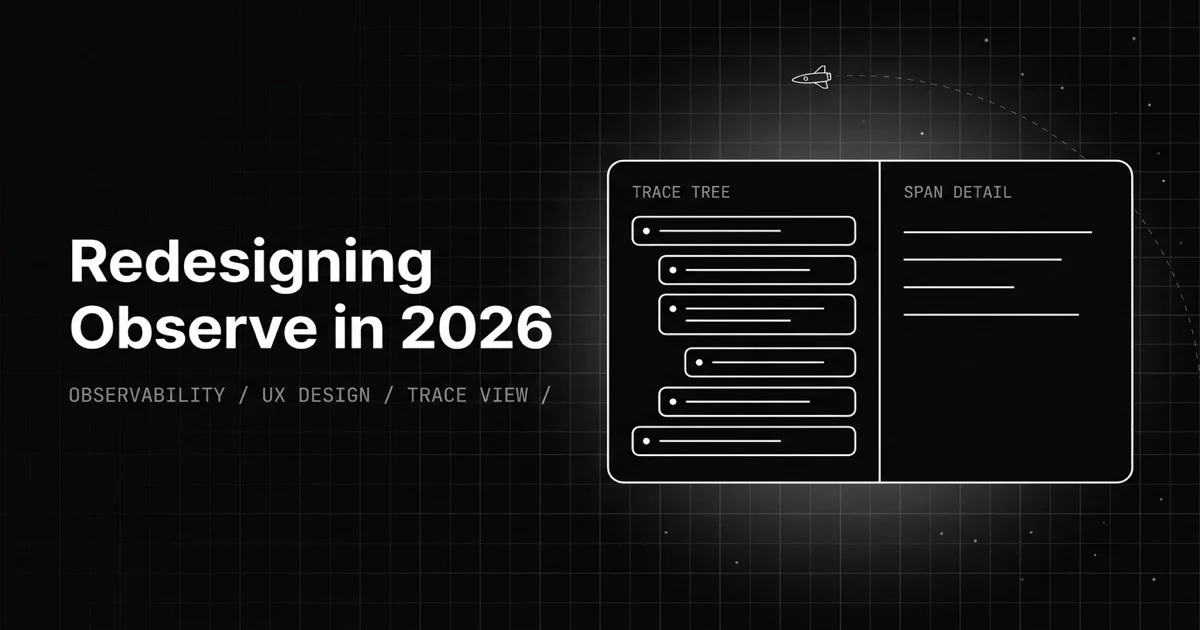
Table of Contents
Originally published May 29, 2026.
An agent fails in production. You open your observability tool, find the trace, and it is a flat list of forty spans with no metrics on them, so you start clicking each one to find which was slow. You want to filter the list to just the errored calls, but the filter panel slides out over the table and hides the rows you are inspecting. You pull up a dashboard to check token spend, but it shows last month and you cannot change the range without an admin. Ten minutes in, you have not fixed anything; you have been fighting the UI that was supposed to help.
We redesigned Observe because that ten minutes is the actual problem. This is the design story: the principles we worked from, why the old screens slowed triage down, and the decisions behind the trace view, the filters, and the dashboards. It is about design choices, not a feature tour.
What Is Triage-First Observability?
Triage-first observability is a design principle: lay the screen out so an engineer can find and understand a failure in the fewest possible clicks. The trace tree carries inline metrics so you spot the bad span without opening each one, the agent’s control flow is visible as a graph rather than inferred, filters narrow the data without covering it, and span detail loads in context next to the tree.
The opposite, and the thing most generic trace viewers are, is a flat list of spans with no signal, where triage means clicking into everything. It builds on the basics of LLM observability but optimizes a different metric: we made time-to-understanding the thing the redesign chased, and every decision below is downstream of it.
Why Did the Old Trace View Slow Triage Down?
The old trace detail was a working skeleton: it displayed inputs, outputs, evals, and attributes correctly once you found the right span. The cost was all in the finding. The trace tree was structure without signal, span names and nesting but no latency, tokens, or warnings on the nodes, so the only way to learn which span was slow or errored was to open each one.
For a simple LLM call that is tolerable. For an agent trace that branches across tool calls, retrievals, and sub-agents and runs dozens of spans deep, it is a hunt. The information you needed to triage existed, but it lived one click away from where your eyes were, and you paid that click dozens of times per incident.
How Did We Redesign the Trace Detail View?
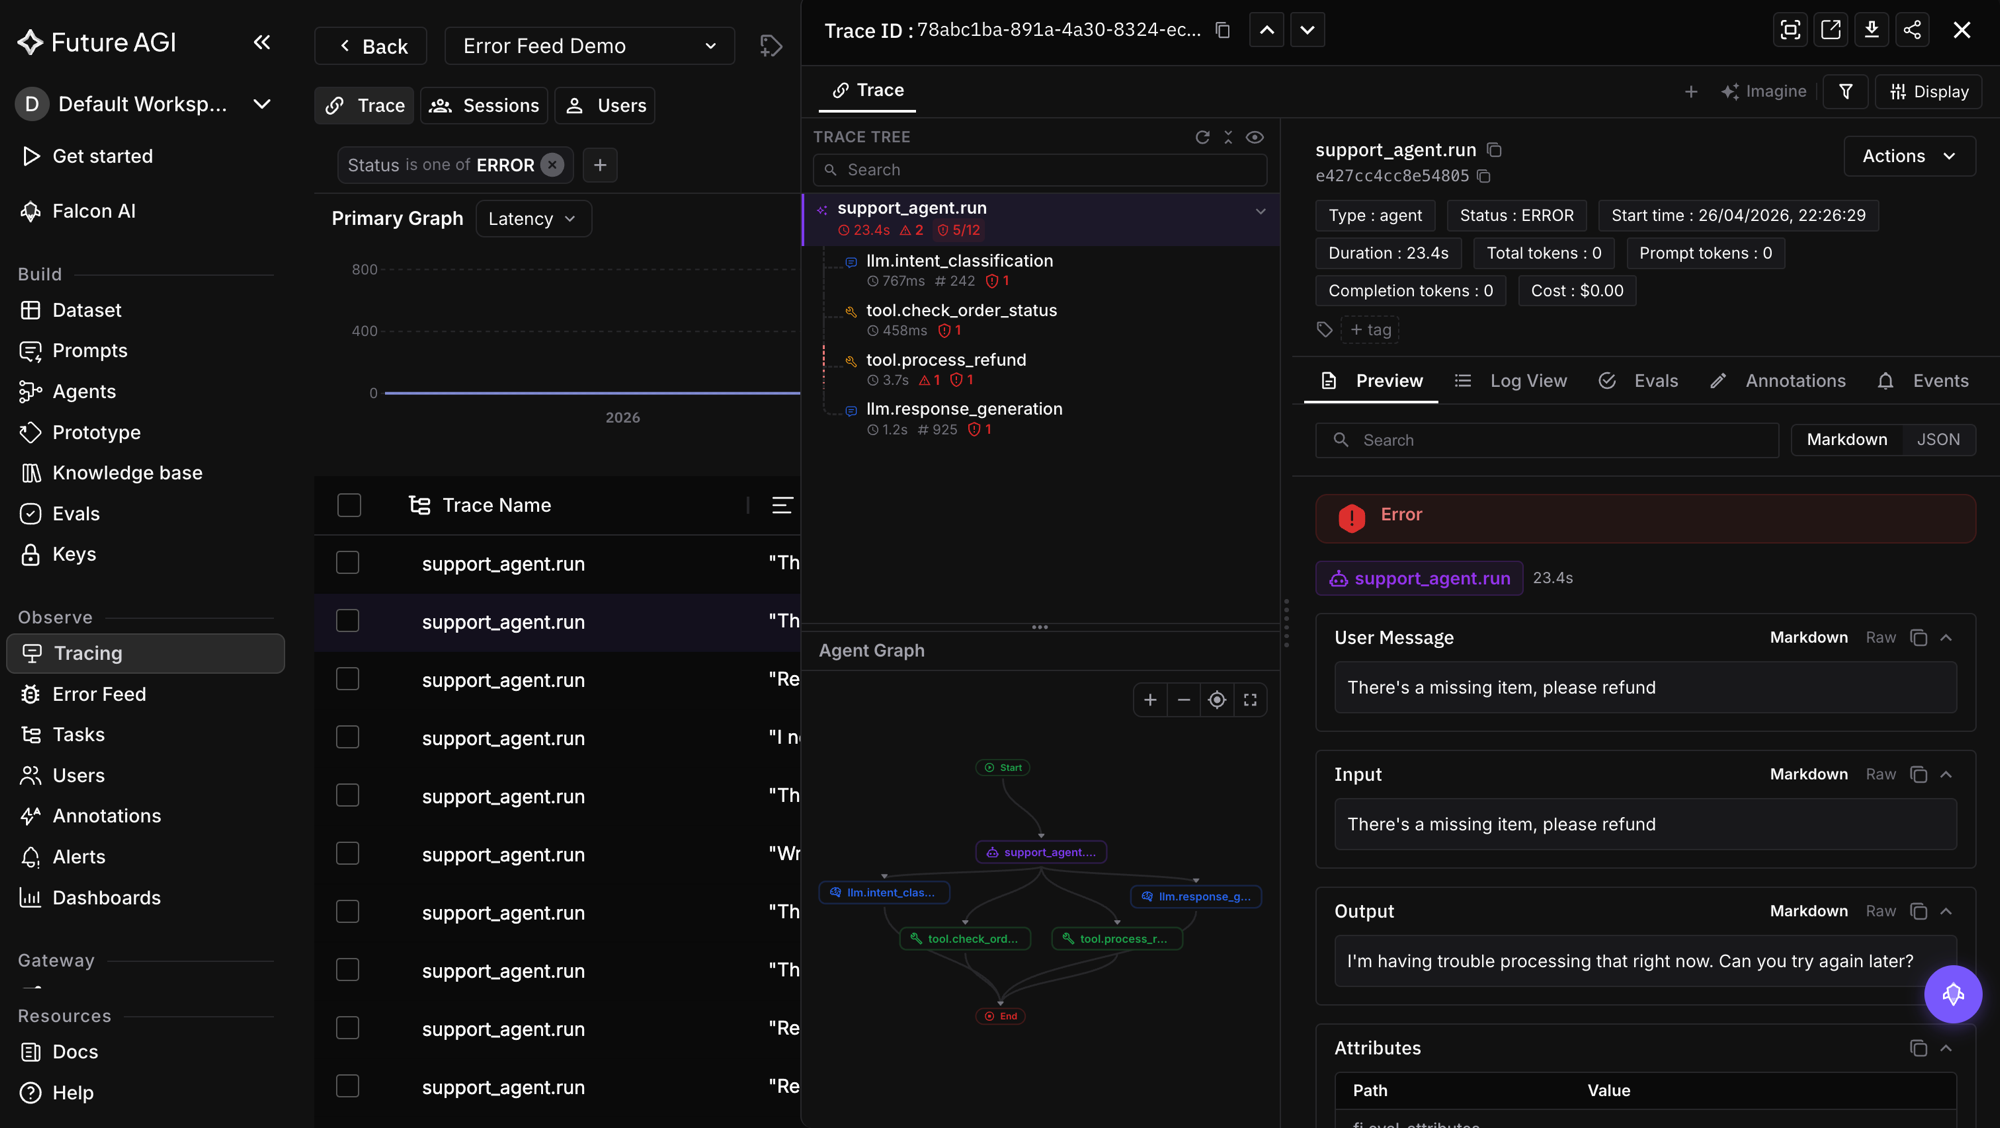
The redesign splits the drawer into two panels: a left panel for navigating the trace and a right panel for the selected span’s detail, with a resizable divider between them. The work went into making the left panel answer the triage question on its own.
- Inline metric badges on the tree. Each span shows its latency, token count, and warning count right on the node. You scan the tree once and your eye lands on the 1m-15s span or the one with two warnings, then click only that.
- The agent graph. Below the tree, the agent’s control flow renders as a directed graph, start to end, so you see how the agent actually moved instead of reconstructing it from a flat list. The same instinct shows up in multimodal trace views, where the modality of each step has to be legible at a glance.
- In-context span detail. Selecting a span loads its detail, with preview and log views, in the right panel beside the tree, so you never lose your place in the trace.
- Navigation and search. Previous/next arrows move between traces without returning to the list, and a search narrows the tree itself.
The principle running through all of it: keep the triage signal where the eye already is, and load detail in context rather than on a new screen.
Why Did We Move Filters Out of a Drawer?
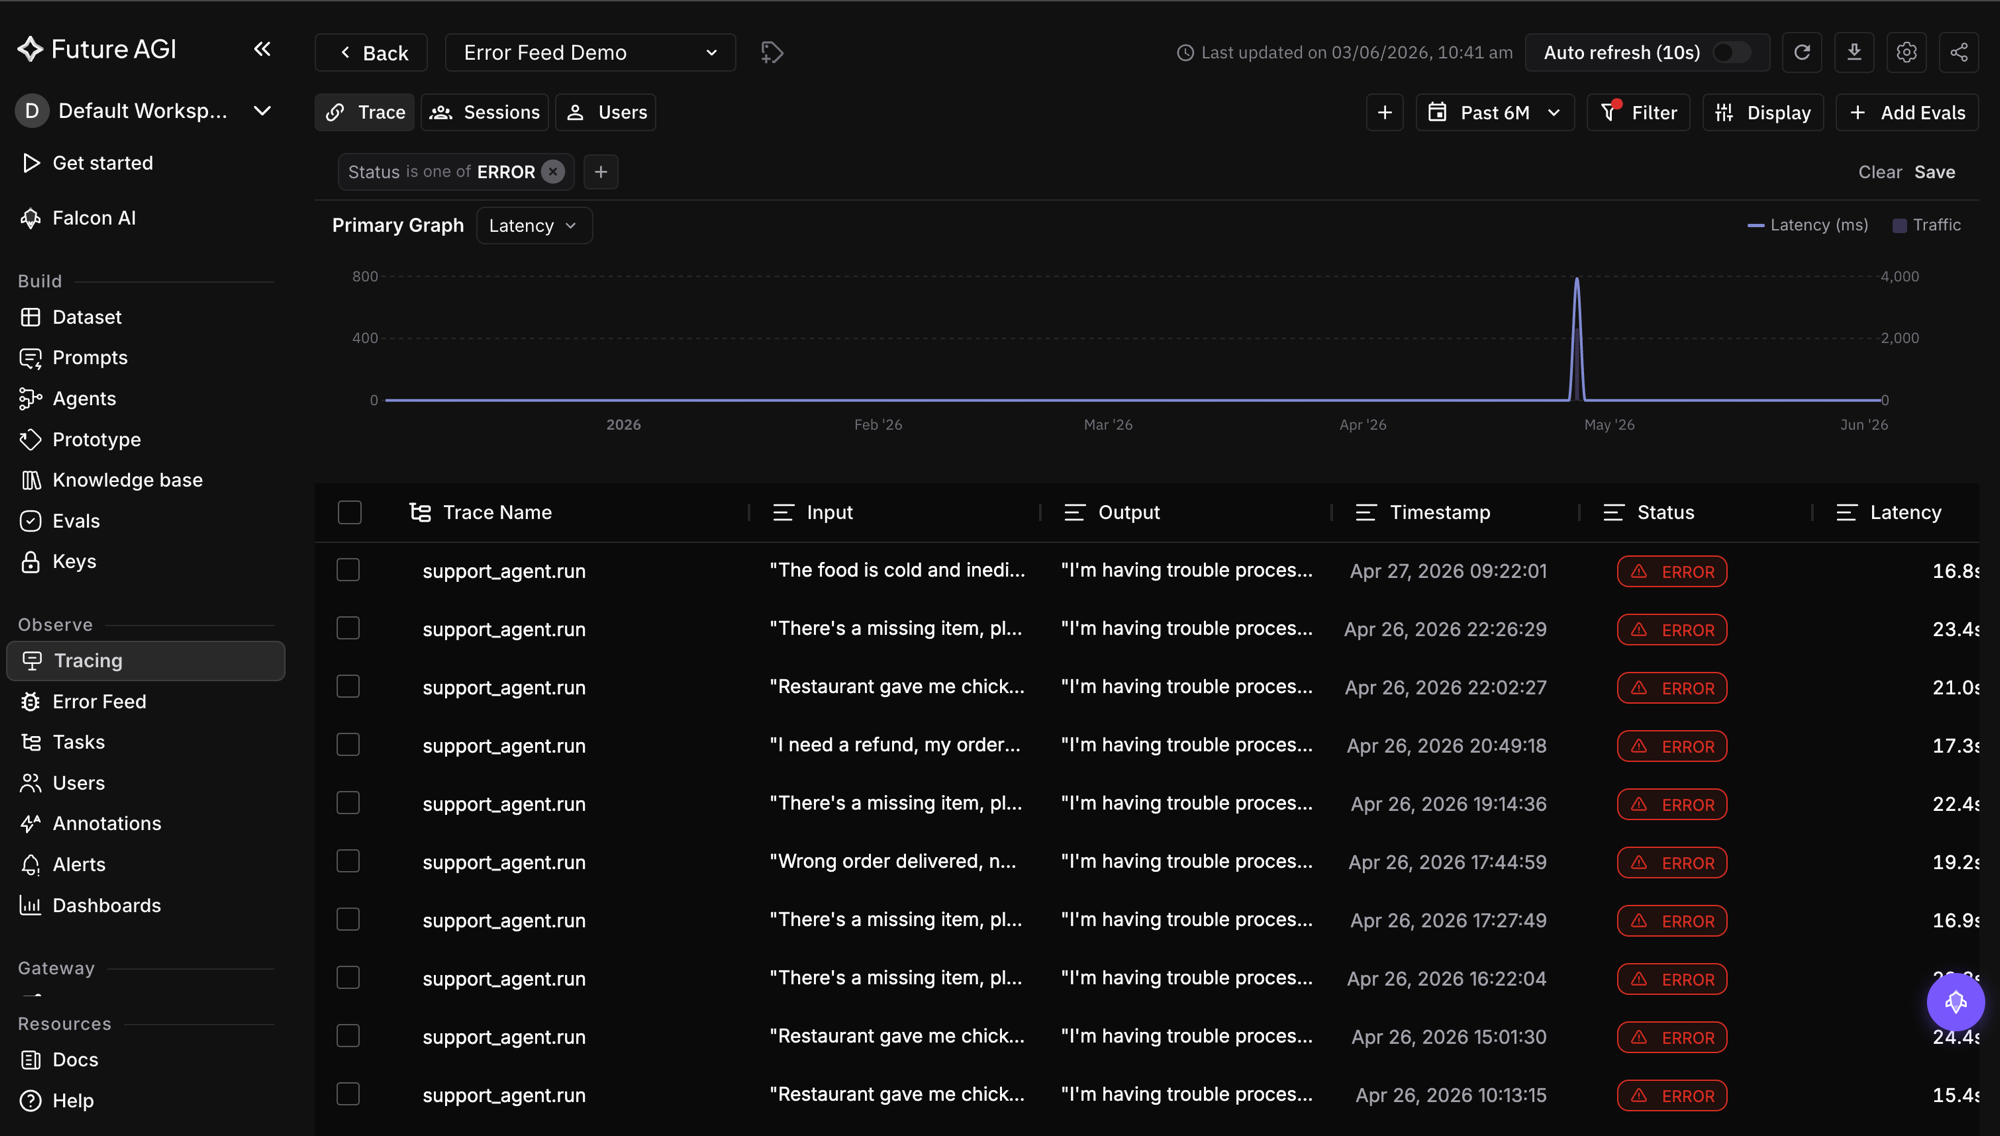
The old filter system was a right-side drawer that slid in over the table. That is the design mistake in one sentence: it hides the data you are trying to filter. You set a condition, lose sight of the rows, close the drawer to check, reopen it to adjust, and repeat.
The redesign puts filters in a dropdown below the Filter button and shows active filters as removable chips above the table, so the data stays visible the entire time and you can see what each filter did to it. Fields are grouped by category, trace details, evals, annotations, so the relevant condition is findable, and filters apply on an explicit Apply rather than thrashing the table on every keystroke. A filter set saves to a view, so a useful slice is reusable instead of rebuilt from scratch each session. None of this is novel UI; it is just refusing to cover the data with the tool meant to clarify it.
How Did We Make Dashboards Editable?
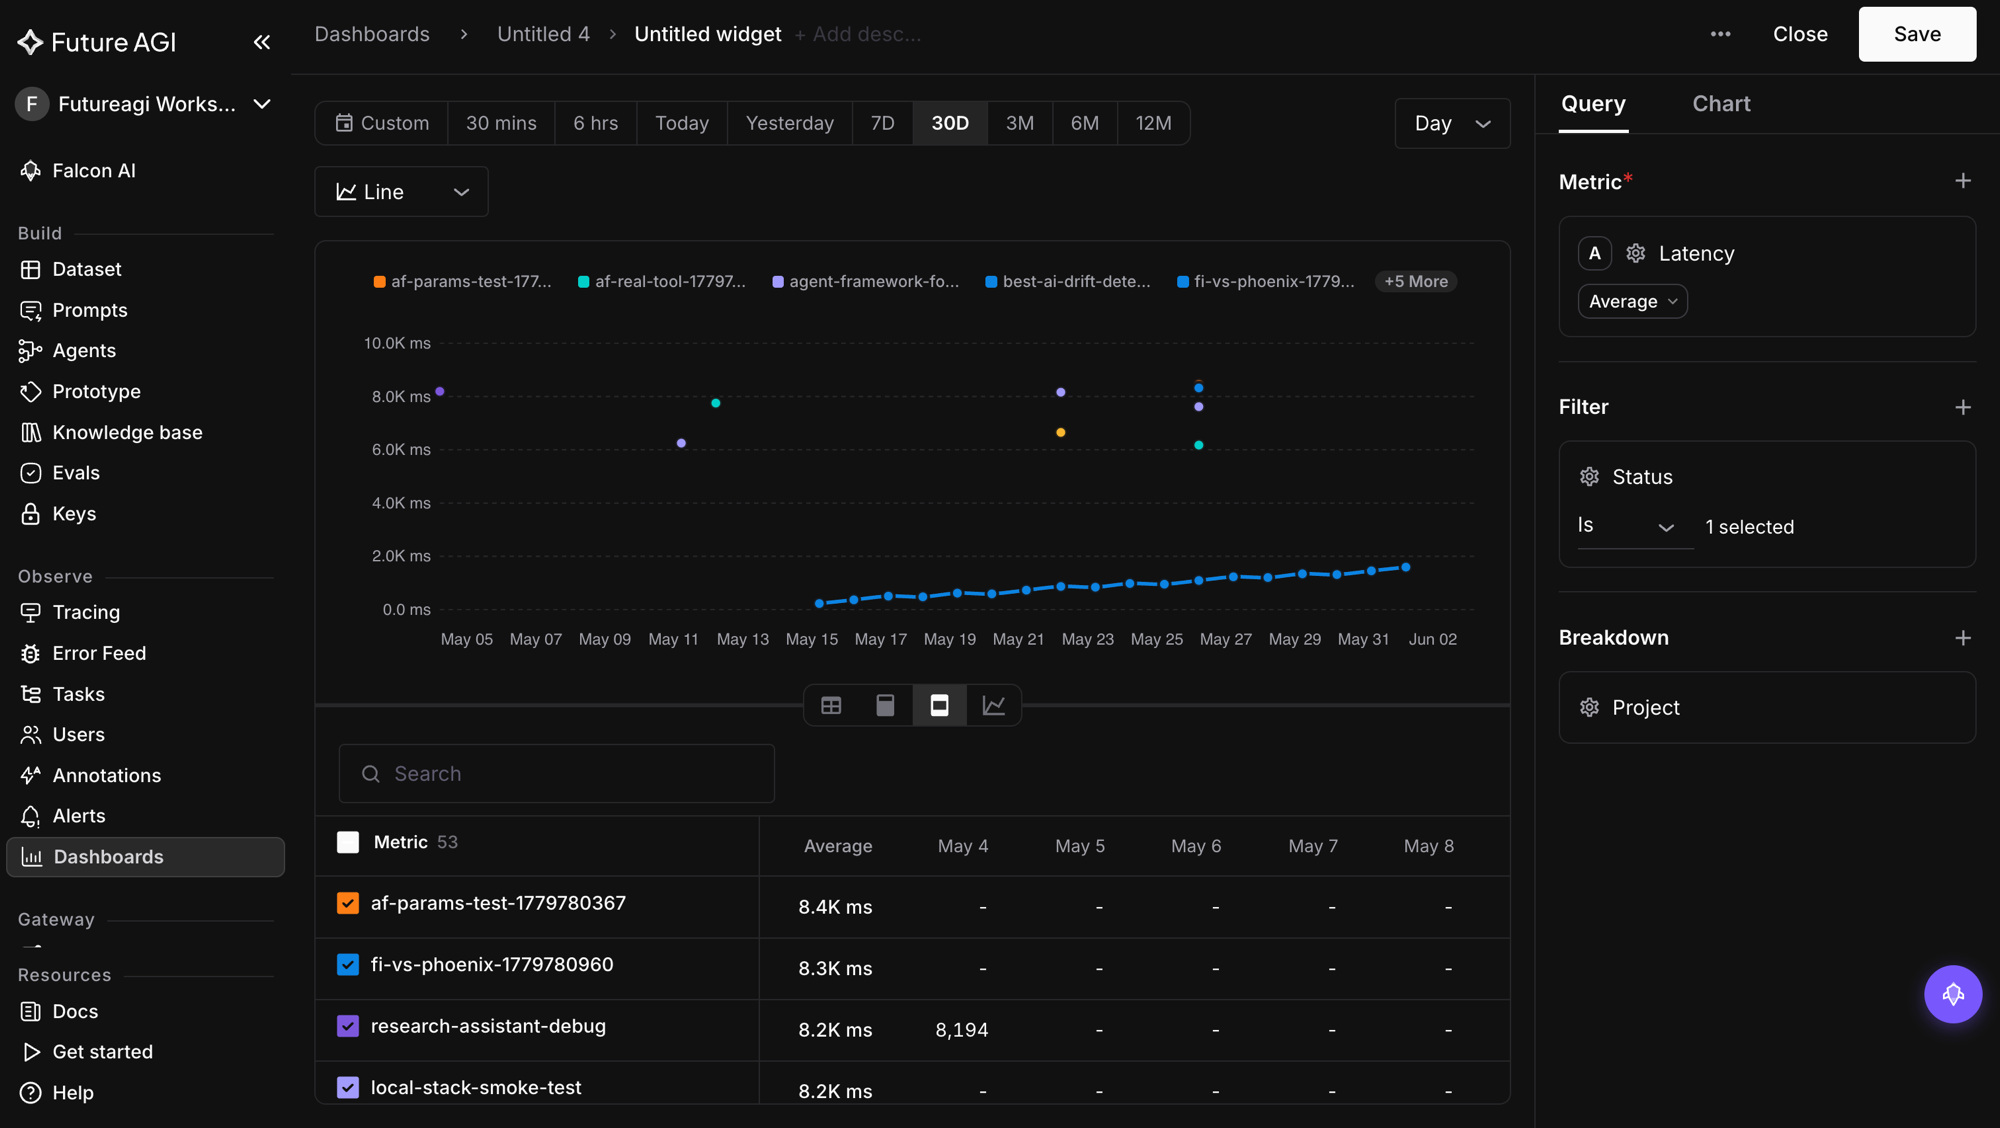
The dashboards were static where they needed to be malleable, so we modeled them on a board you arrange rather than a report you configure. The decisions, drawn from the direct-manipulation school of dashboard UX:
- Inline editing. Name and description edit on click, no settings panel.
- A global date bar. Presets from today through twelve months, plus custom, reframe every widget at once, with a default that returns to per-widget ranges. It is per session by design, so exploring a range does not mutate the saved board.
- Drag to reorder, drag to resize. Widgets rearrange by dragging a handle and resize by dragging an edge.
- A flexible grid. A twelve-column layout lets a widget span a quarter, a third, a half, or a full row, so the board fits the question instead of forcing a fixed shape.
The test we held it to: reshaping the board to the question you have right now should be a few drags, not a dialog.
What Principle Tied the Redesign Together?
Consistency was the quiet half of the work. The same triage-first instinct produced a unified Actions button across every observability list view, so the action you want is in the same place whether you are looking at traces, sessions, or spans, instead of relearning each screen. A redesign that makes one screen fast and leaves the next one idiosyncratic just moves the friction.
| Screen | Before | After (triage-first) |
|---|---|---|
| Trace tree | Names and nesting, no metrics | Inline latency, tokens, warnings per span |
| Control flow | Inferred from a flat list | Agent graph (DAG) in view |
| Span detail | Found after clicking around | Loads in context beside the tree |
| Filters | Drawer that covers the table | Dropdown plus chips, data stays visible |
| Dashboards | Fixed layout, set ranges | Inline edit, global date, drag, resize, grid |
| List actions | Different per screen | One unified Actions button |
What Were the Trade-offs?
- A denser trace tree. Inline badges make the tree busier than bare names. We accept the density because it removes clicks, and we keep full detail behind selection so the tree stays scannable rather than overwhelming.
- More UI state to manage. Dropdown filters with chips and saved views are more moving parts than a static drawer. The payoff, keeping the data visible while you filter, was worth the extra state.
- Editable dashboards add complexity. Drag, resize, and a flexible grid are more to build and maintain than a fixed layout. We scoped it by making the global date range per session rather than persisted, so the powerful part stays simple.
Why Time-to-Understanding Is the Real Metric
Observability tools get judged on what they can show, but they get used on how fast they let you understand. The Observe redesign was an argument that the second is the one that matters: put the triage signal on the trace tree, show the agent’s real control flow, stop hiding data behind the filter that is supposed to reveal it, and let a dashboard bend to the question in front of you. The features were mostly already there. What changed is how few clicks it takes to get from a failed agent run to knowing why, which is the only observability metric your on-call engineer actually feels. It pairs naturally with trace-native evaluation, so the span you triage already carries its eval score.
Want to see triage-first observability in practice? Explore Future AGI Observe and trace an agent run from the tree down to the span that broke it.
Sources
Frequently asked questions
What is triage-first observability?
Why redesign an LLM observability UI at all?
Why put metrics inline in the trace tree?
Why move filters from a drawer to a dropdown?
What makes a dashboard feel editable instead of fixed?
What did you keep from the old Observe screens?
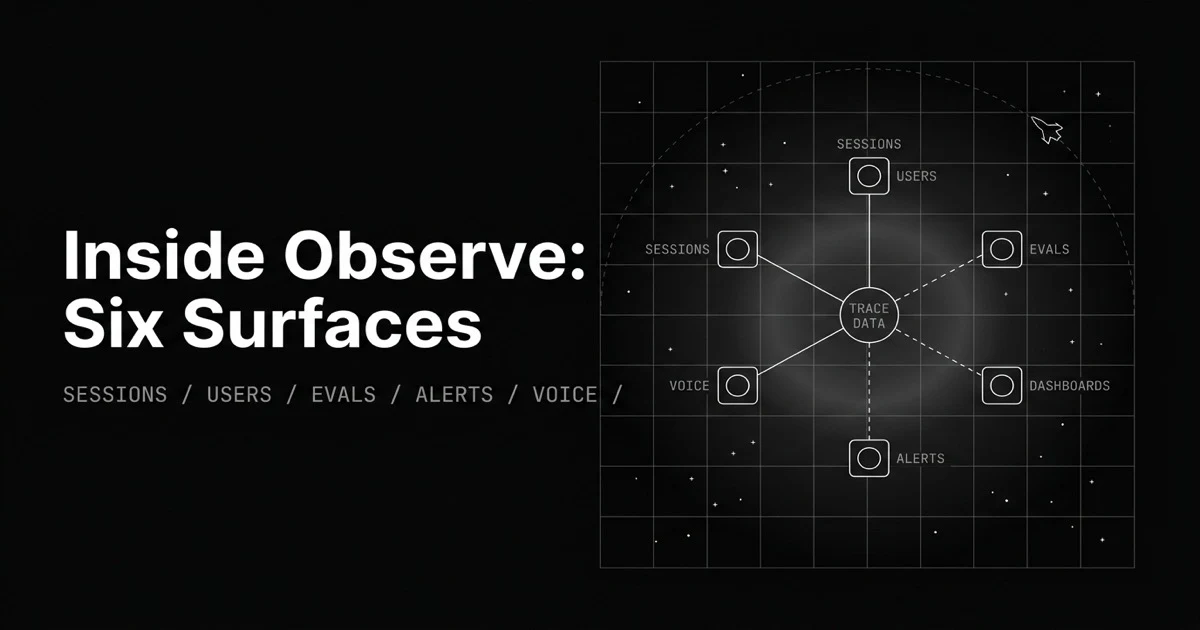
Production observability has to answer six questions. Here is the Observe surface for each: sessions, users, trace evals, dashboards, alerts, and voice.
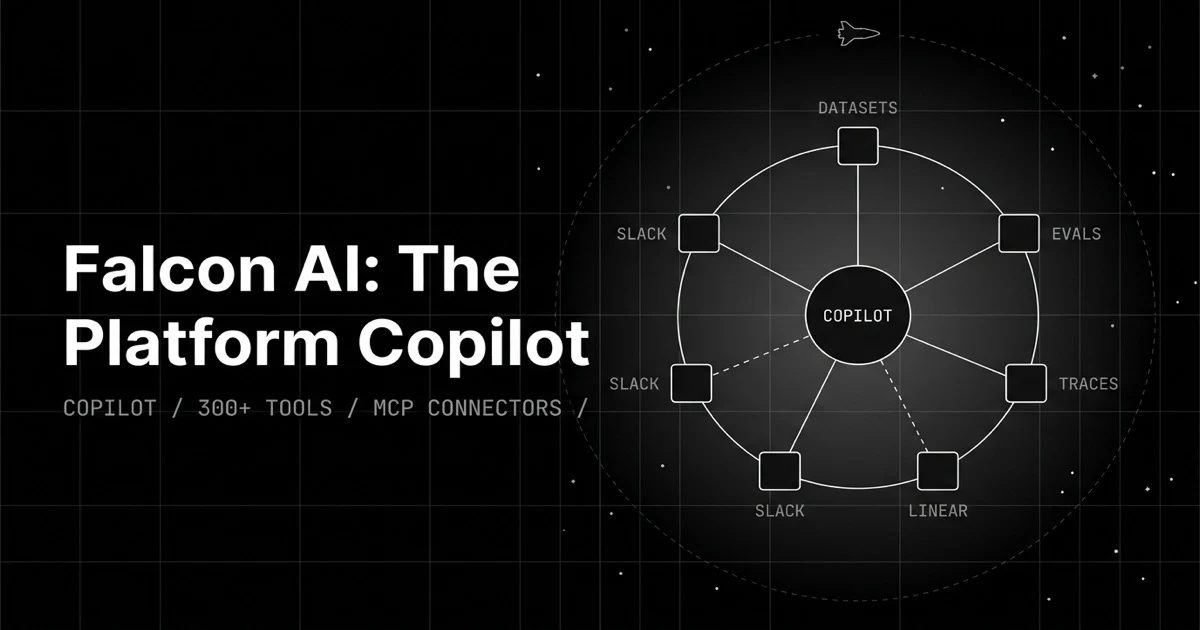
A generic chatbot answers questions about your data. Falcon AI runs the eval, drills the trace, and files the ticket, with 300+ tools and page context.
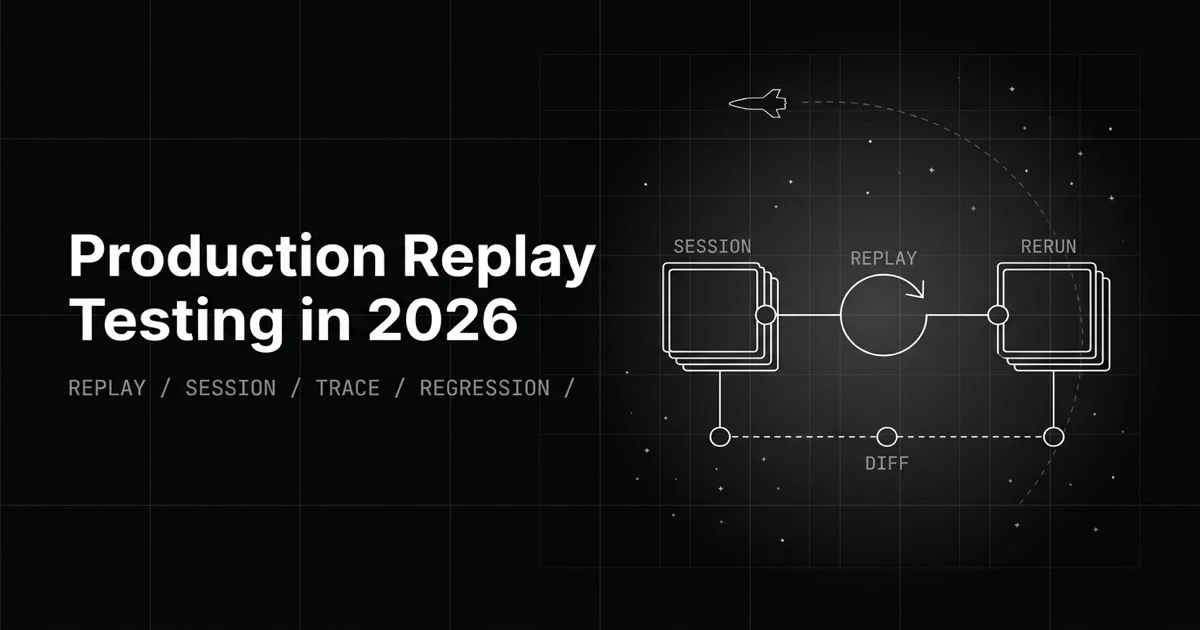
Synthetic test cases can't reproduce the bug a real user hit. Production replay reruns the exact session, trace, or voice call against your fixed agent.