Inside Observe: The Six Surfaces of Production Agent Observability in 2026
Production observability has to answer six questions. Here is the Observe surface for each: sessions, users, trace evals, dashboards, alerts, and voice.
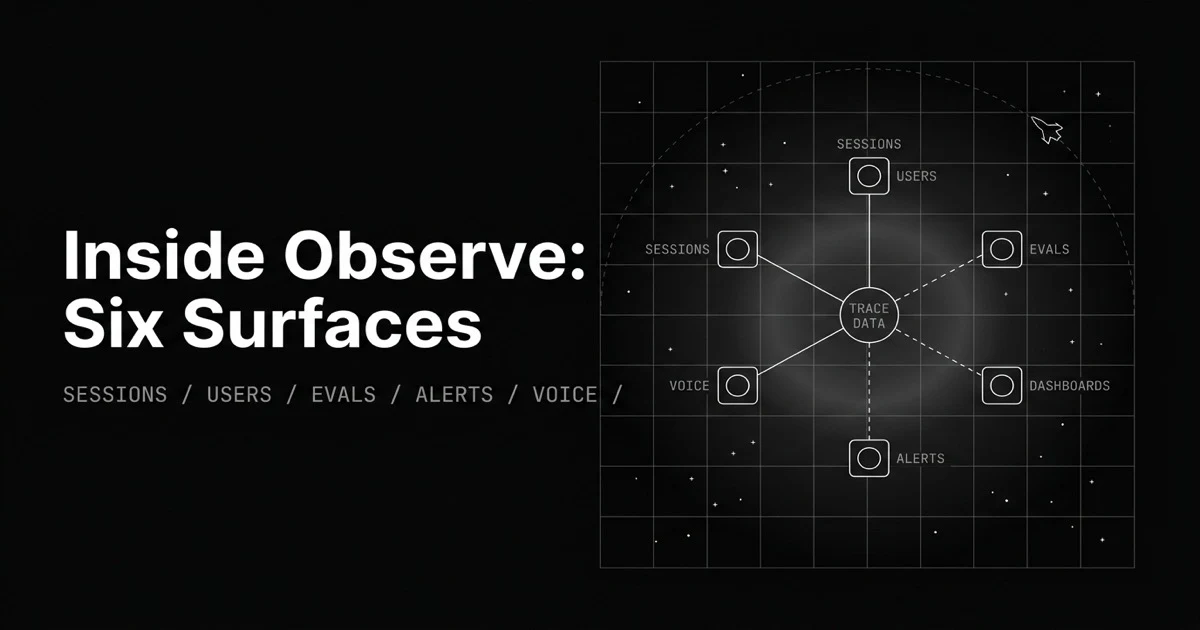
Table of Contents
Originally published May 29, 2026.
Your agent is in production, and “is it working?” is no longer one question. A user says a conversation went wrong: that is a session question. Latency crept up for one customer: that is a user question. Quality is sliding across all traffic: that is an eval question. The bill spiked overnight while you slept: that is an alert question. Treating observability as one undifferentiated stream of spans means answering all four by scrolling, which is how production problems reach you through a complaint instead of a dashboard.
Observe is organized around those questions, each with its own surface. This post is the map: the six surfaces of production agent observability, what each one answers, and when to reach for it.
What Does Production Observability Have to Answer?
Production observability is how you watch an AI application after launch, when inputs vary, model behavior shifts, and issues appear that testing never caught. It tracks every response, groups them by session and user, scores them for quality, and tells you when something breaks, so you see problems in the dashboard before users report them.
The useful way to think about it is as distinct questions, not one feed. We call the answer set the production observability surface map: each surface below resolves one question, and knowing which is which is how you go from a symptom to the view that explains it.
How Do Sessions Reconstruct a Multi-Turn Conversation?
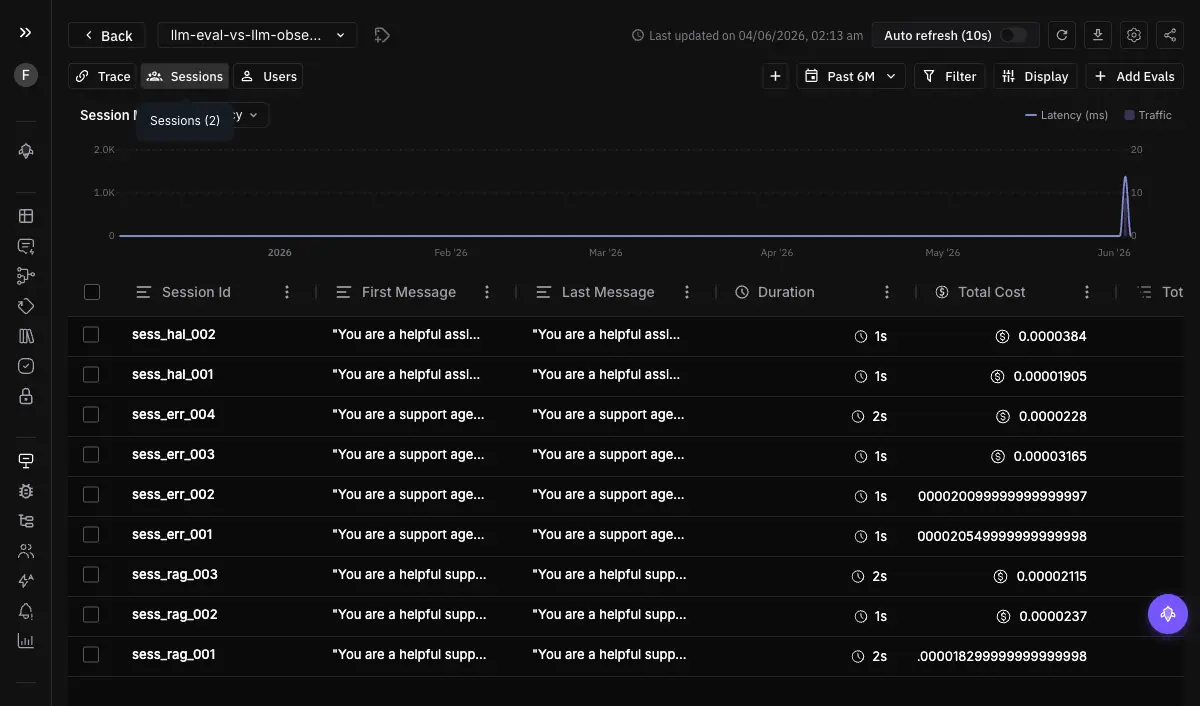
A single agent conversation is many traces: each turn, each tool call, each retrieval is its own span tree. Sessions group those under one identifier so the conversation is a single object with its own duration, cost, and token usage, instead of scattered calls you have to mentally stitch together.
This is the surface for “what happened in this conversation?” You open the session, see the full multi-turn flow, drill into any individual trace inside it, and spot the turn where it went wrong. You create sessions by setting a session identifier on your spans, and Observe assembles the flow. For chatbots and multi-step journeys, the session is the natural unit of debugging, not the individual call.
How Does the User View Show Who Is Affected?
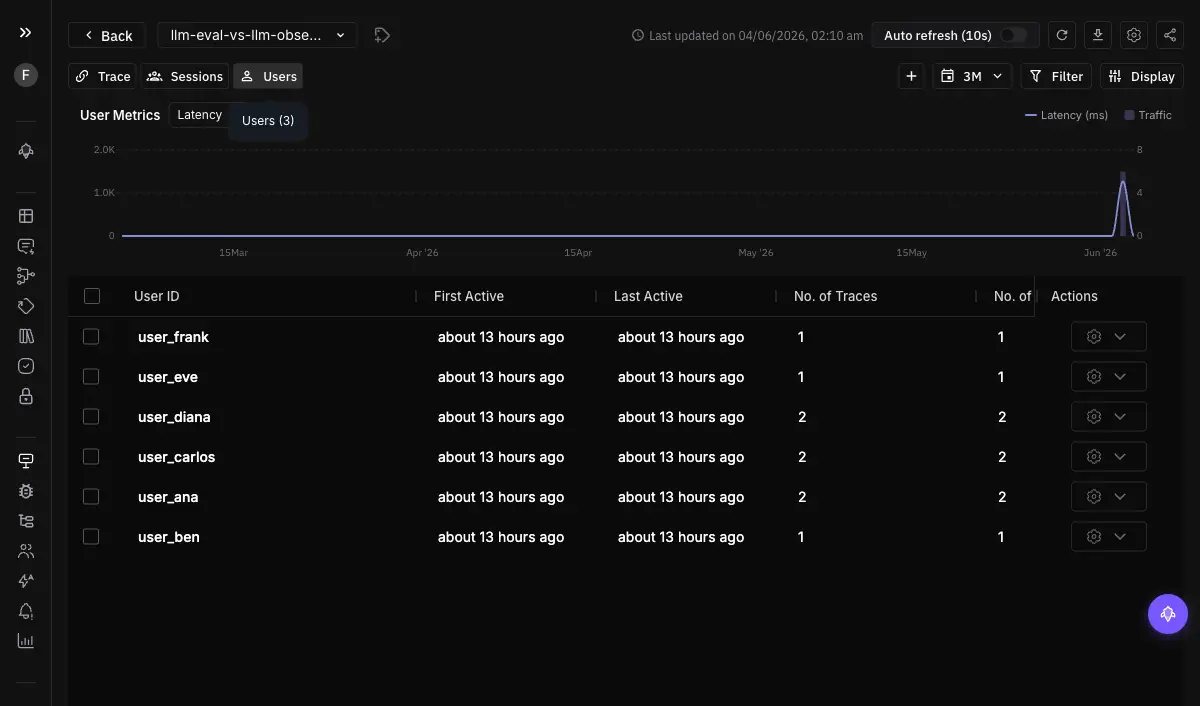
When a specific customer reports a problem, you do not want to search all traffic for their calls. The user view groups every trace and session by end user, so each user is a row with aggregated cost, tokens, latency, error count, eval pass rate, and guardrail triggers.
This is the surface for “who is this happening to?” You set a user.id attribute on your spans, Observe creates a user entry and links all matching spans, and opening a user shows their full activity in one place. It turns “a customer is unhappy” from a needle-in-the-haystack search into opening their row.
How Do Evals on Traces Score Quality Continuously?
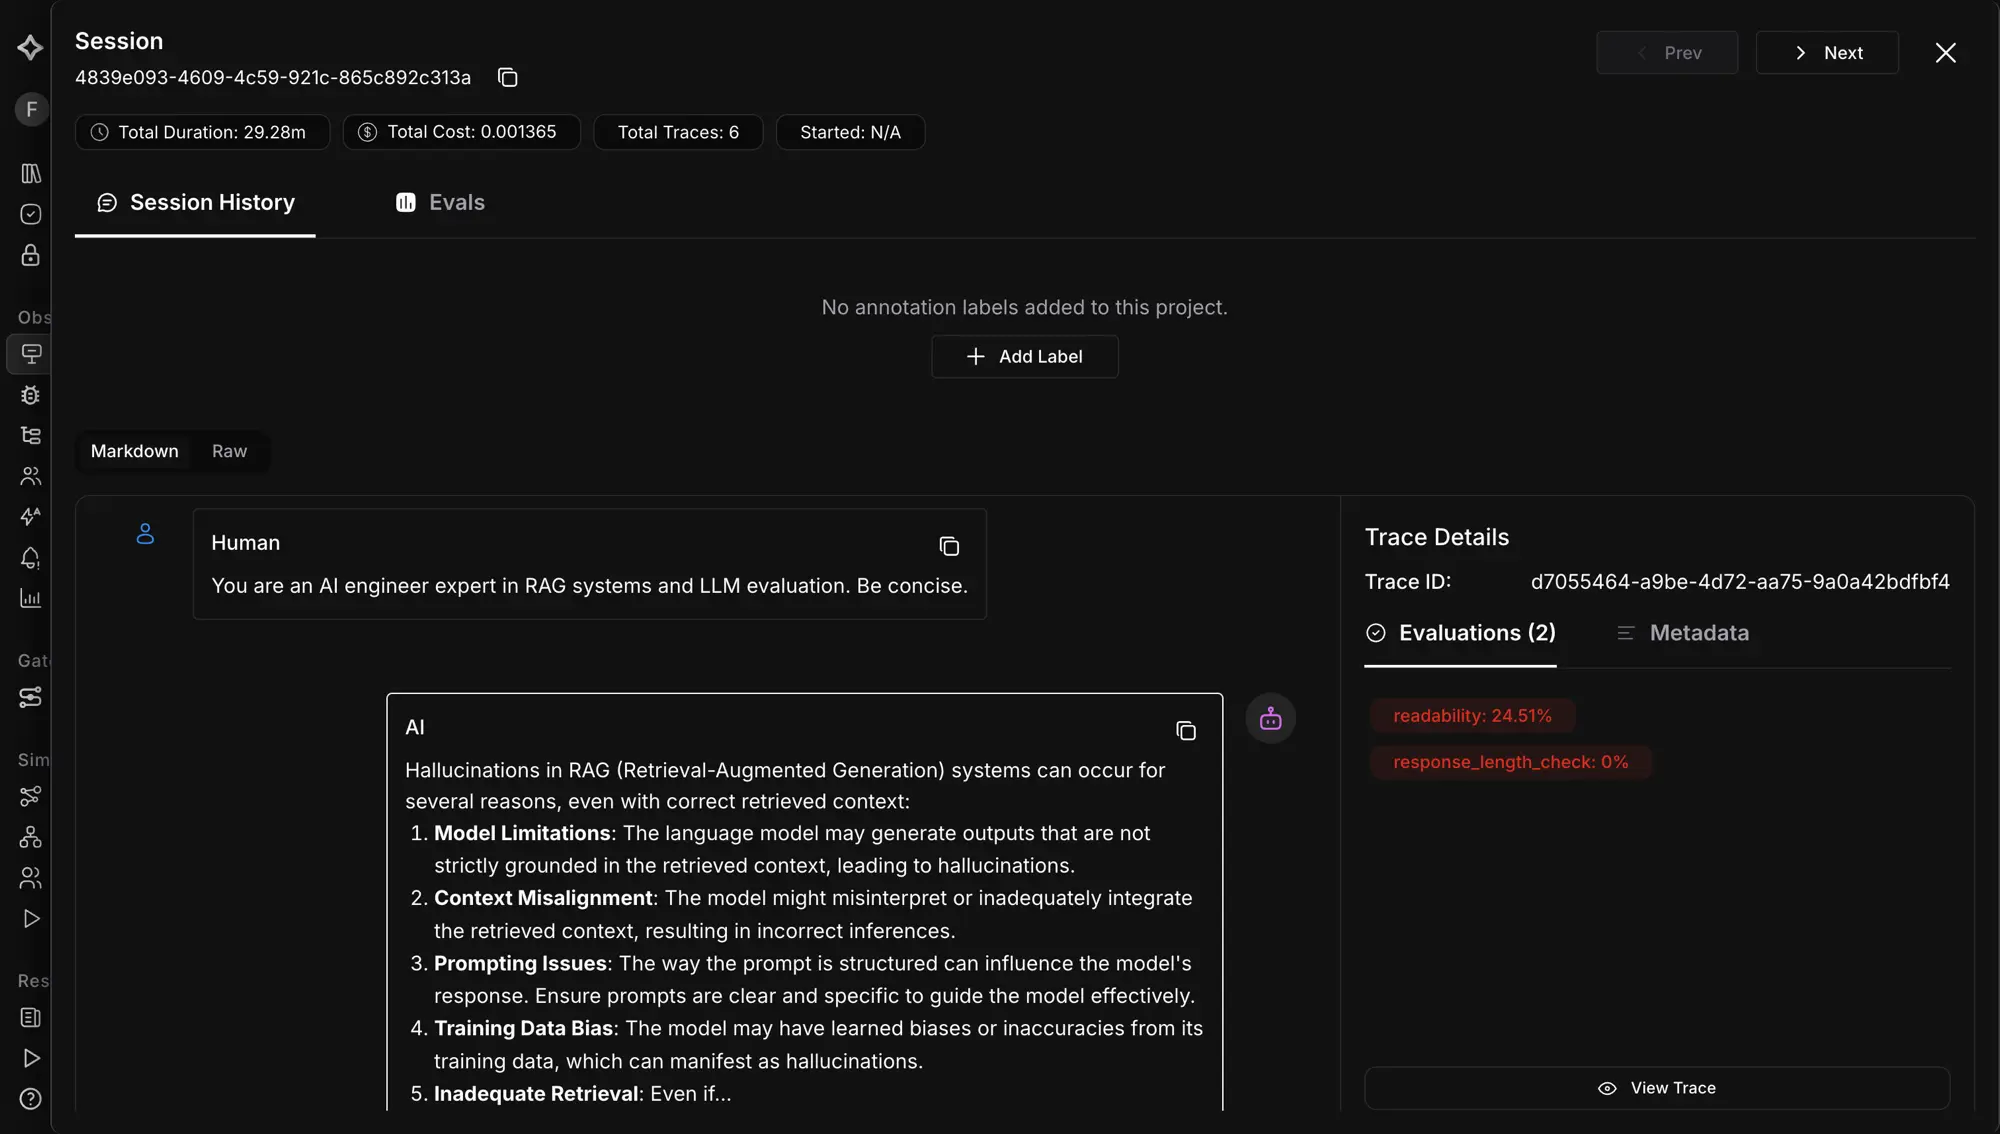
Triage and grouping tell you what happened; they do not tell you whether it was good. Evals on traces run automated quality checks, hallucination, tone, bias, toxicity, and more, on production spans, scoring responses as they flow. You filter which spans they apply to, choose historic or continuous mode, and set a sampling rate to control cost.
This is the surface for “is quality holding?” Results attach per span and can trigger alerts when scores drop. It is the trace-native eval pattern: the score lives on the span it judged, so a failing groundedness check sits on the same span as the call that earned it, ready to debug in context.
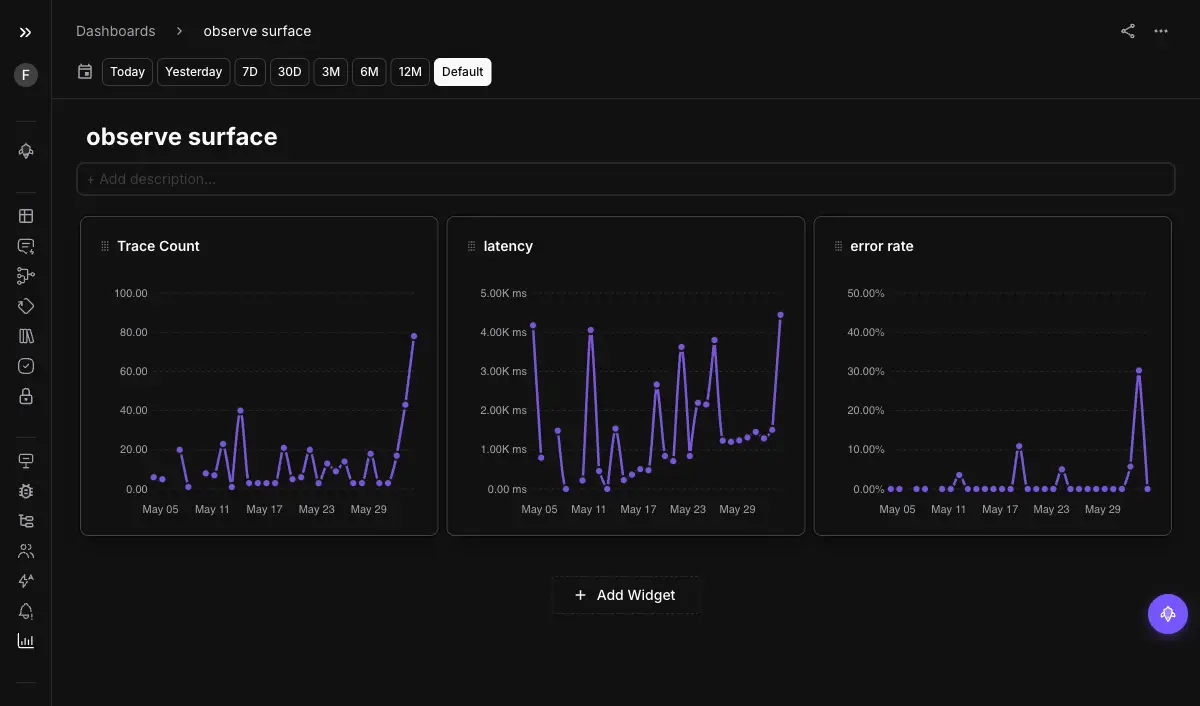
How Do Dashboards Put It in One View?
Sometimes you are not chasing one incident; you are reviewing the state of everything. Dashboards are custom collections of widgets, each running a query and rendering a chart or table, so you track error rates, latency, token usage, and eval scores side by side. They work across project types and are shareable across the team.
This is the surface for “what is the overall state?” It is the periodic-review view, the one you open to see trends rather than to chase a specific failure. For the bespoke, in-the-moment cut you have not pre-built, the conversational view builder complements the standing dashboards.
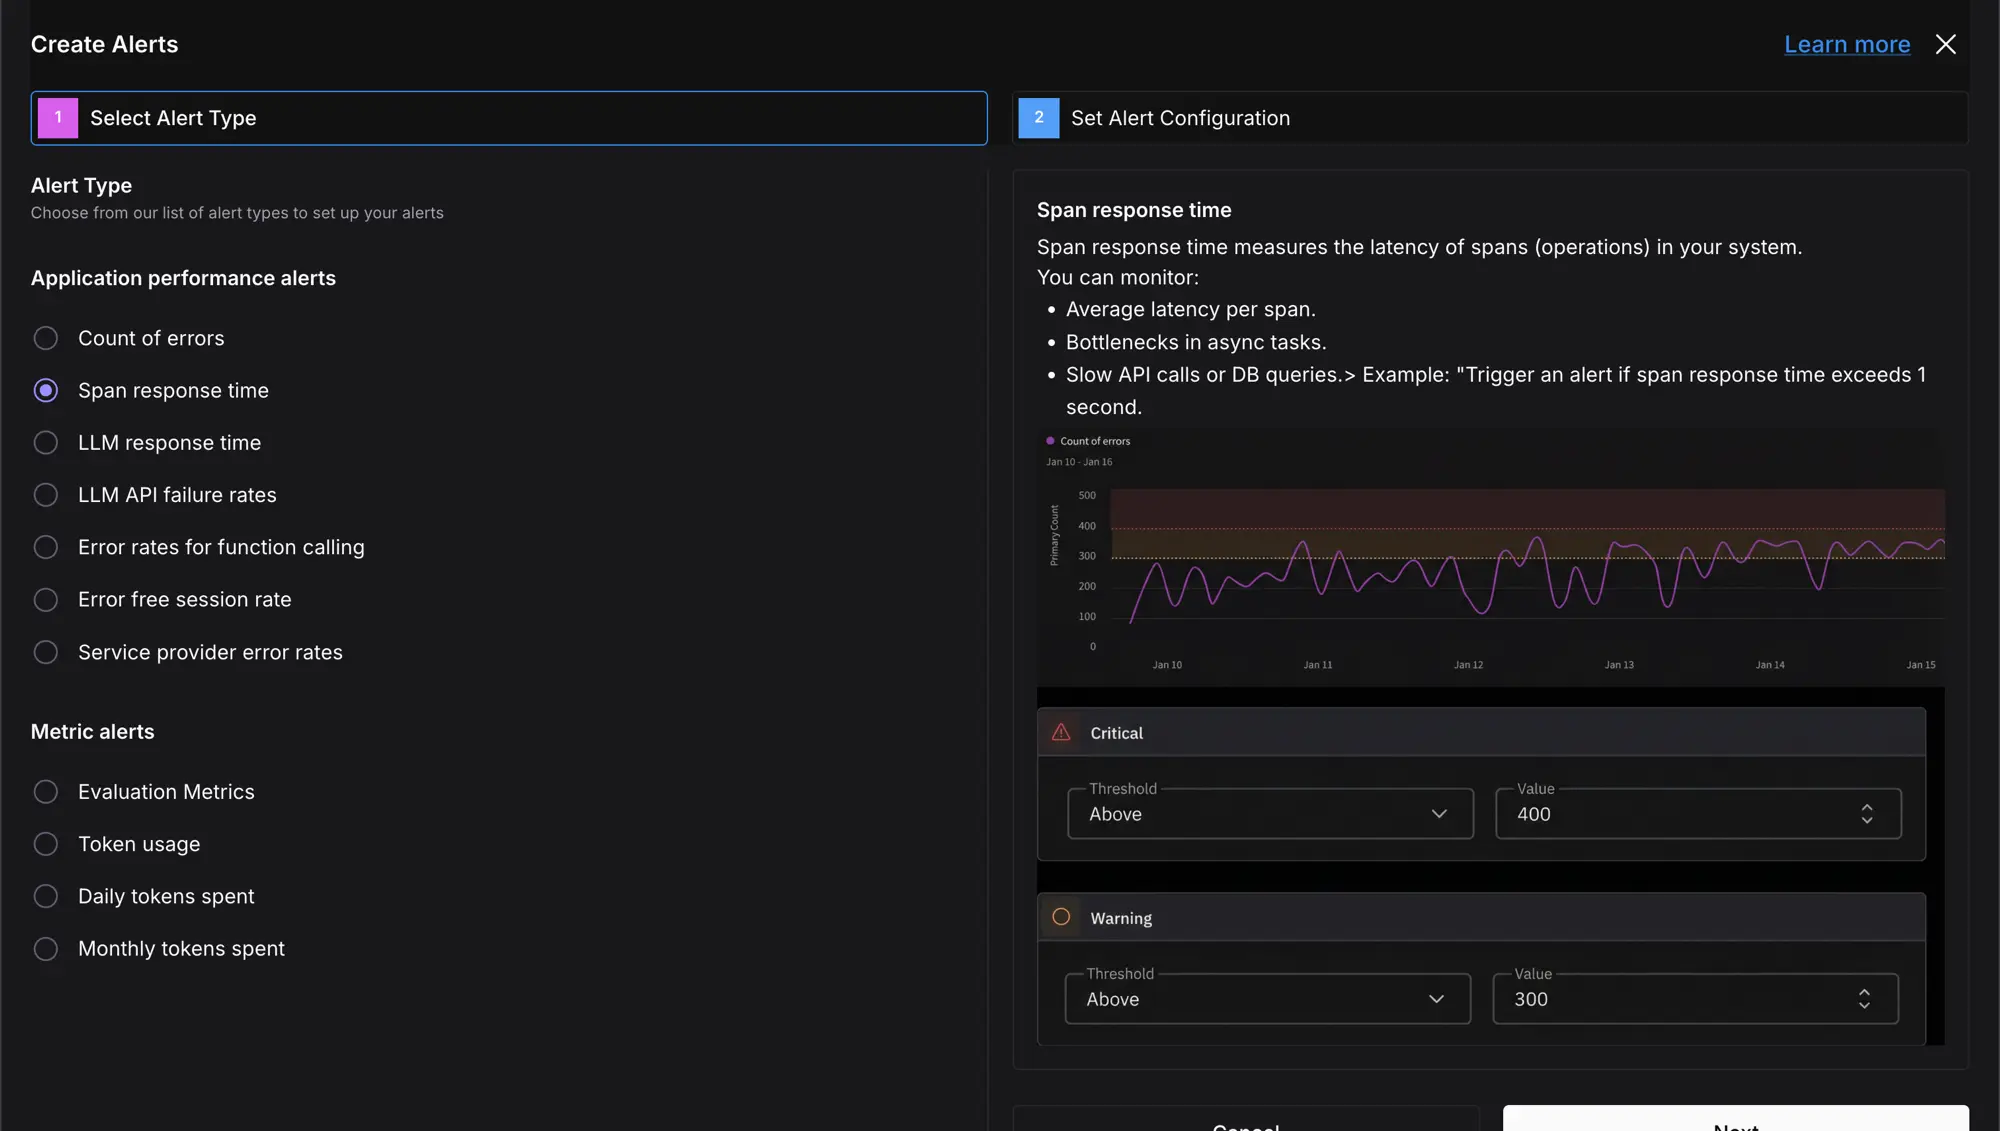
How Do Alerts Tell You Before Users Do?
Dashboards require you to look. The whole point of production monitoring is the regressions you would not catch by watching. Alerts and monitors invert the dashboard: you define a threshold on a metric, error rate, latency, cost, or an eval score, and get notified by email or Slack when it is breached, on a schedule.
This is the surface for “when do I get told?” You review past alerts, mark them resolved, or mute a monitor without deleting it. It is what closes the gap between a problem starting and you knowing, so the overnight cost spike pages you instead of surprising you in the morning invoice.
How Does Voice Observability Capture Calls Without an SDK?
Voice agents are the hardest to debug: conversations happen live, across turns, and you usually learn about failures from a complaint. Voice observability pulls call logs from your provider, Vapi or Retell, into Observe automatically, with no SDK or code changes. Connect with the provider’s API key and assistant ID, and every call becomes a trace with its transcript, recording URLs, cost, and duration.
This is the surface for “what happened on this call?” Once the calls are traces, everything else applies: run evals on them, set alerts, search, filter, and export, the same as any other trace. It also feeds production replay, so a bad call can be rerun against a fixed agent.
Which Surface Answers Your Question?
| Question | Surface |
|---|---|
| What happened in this conversation? | Sessions |
| Who is it happening to? | User view |
| Is quality holding across traffic? | Evals on traces |
| What is the overall state right now? | Dashboards |
| When do I get told it broke? | Alerts and monitors |
| What happened on this voice call? | Voice observability |
These are not six products to learn; they are six lenses on the same trace data, each cutting it the way one question needs. The skill is matching the surface to the question instead of scrolling spans and hoping.
Why Surfaces Beat a Single Stream
A raw trace feed can technically answer every question, the way a pile of logs technically contains every answer. Production observability is the work of pre-cutting that pile along the questions you will actually ask: the conversation, the user, the quality, the state, the alert, the call. Built on the basics of LLM observability, the surface map is what turns “monitor everything” into “open the view that explains this,” which is the difference between observability you have and observability you use.
Want to see your production agent through all six surfaces? Set up Future AGI Observe and start with sessions to watch a real conversation end to end.
Sources
Frequently asked questions
What are the main surfaces in Future AGI Observe?
What is a session in LLM observability?
How do you debug a production issue for a specific user?
Can you run evals on production traffic automatically?
How do you monitor voice agents without instrumenting code?
When should you set up alerts versus checking dashboards?
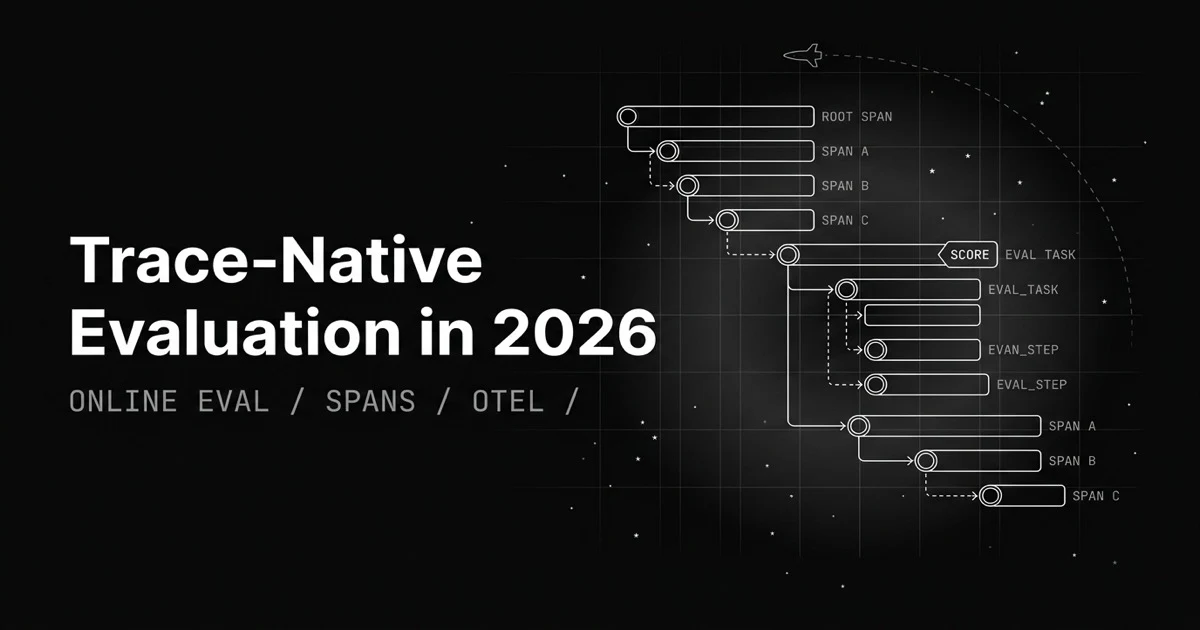
Most eval loops export logs, build a dataset, map columns. Trace-native evaluation attaches the score to the span itself and runs on production traces.
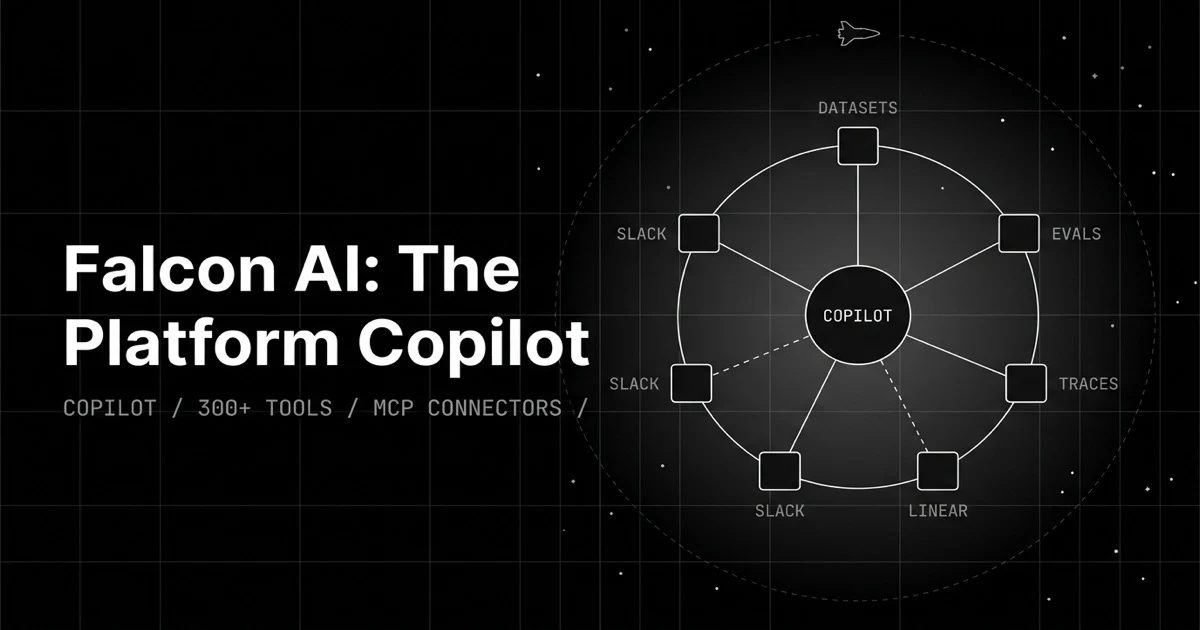
A generic chatbot answers questions about your data. Falcon AI runs the eval, drills the trace, and files the ticket, with 300+ tools and page context.
Synthetic test cases can't reproduce the bug a real user hit. Production replay reruns the exact session, trace, or voice call against your fixed agent.