Trace-Native Evaluation in 2026: Score the Whole Trace, Skip the Data Mapping
Most eval loops export logs, build a dataset, map columns. Trace-native evaluation attaches the score to the span itself and runs on production traces.

Table of Contents
Originally published May 29, 2026.
The standard eval loop has five steps and a context amnesia problem. You export production logs to a file, load them into a dataset, map which column is the model output and which is the retrieved context, run the eval, and get a table of scores. By the time you see that groundedness failed on row 4,812, you are staring at a row in a spreadsheet, severed from the retrieval that fed it, the tool calls around it, and the parent request that triggered it. The score found the failure and threw away the crime scene.
Trace-native evaluation removes the export, the mapping, and the amnesia. This post covers what it is, why the export-and-map loop loses context, and how to attach an eval score directly to the span that produced the output, with code.
What Is Trace-Native Evaluation?
Trace-native evaluation is running evals inside the trace context instead of exporting data to a separate, column-mapped dataset. The eval reads span attributes directly, attaches its score and reason back to the span it judged, and can run continuously on production traffic as new spans arrive. There is no export step and no mapping step: the input is a span attribute you already capture, and the result lives next to the operation it scored.
The shift is from evaluation as an offline batch job on a copied table to evaluation as an online property of the trace itself. A groundedness score stops being a number in a spreadsheet and becomes an attribute on the same span as the LLM call that earned it.
Why Does the Export-and-Map Loop Lose Context?
The traditional flow optimizes for the dataset, not the trace. That choice has three costs, and all three come from the same root: the eval runs on a copy that has been flattened into rows.
- The mapping tax. Every new dataset needs you to declare which column is the response, which is the context, which is the reference. It is boilerplate you repeat per dataset, and it is a place to make a quiet mistake (map the wrong column, score the wrong thing).
- Lost context. A row in an eval table is the output stripped of its surroundings. The retrieval that produced it, the tool calls, the parent span, the latency, all of it lived in the trace and none of it followed the row into the dataset. So a failure tells you what broke but not what it was sitting next to.
- The lag. Export, load, map, run is a batch ritual you do after the fact, the opposite of scoring spans as they happen. Production has already served the bad response by the time the score lands in a separate system.
Trace-native evaluation attacks all three by keeping the eval where the data already lives.
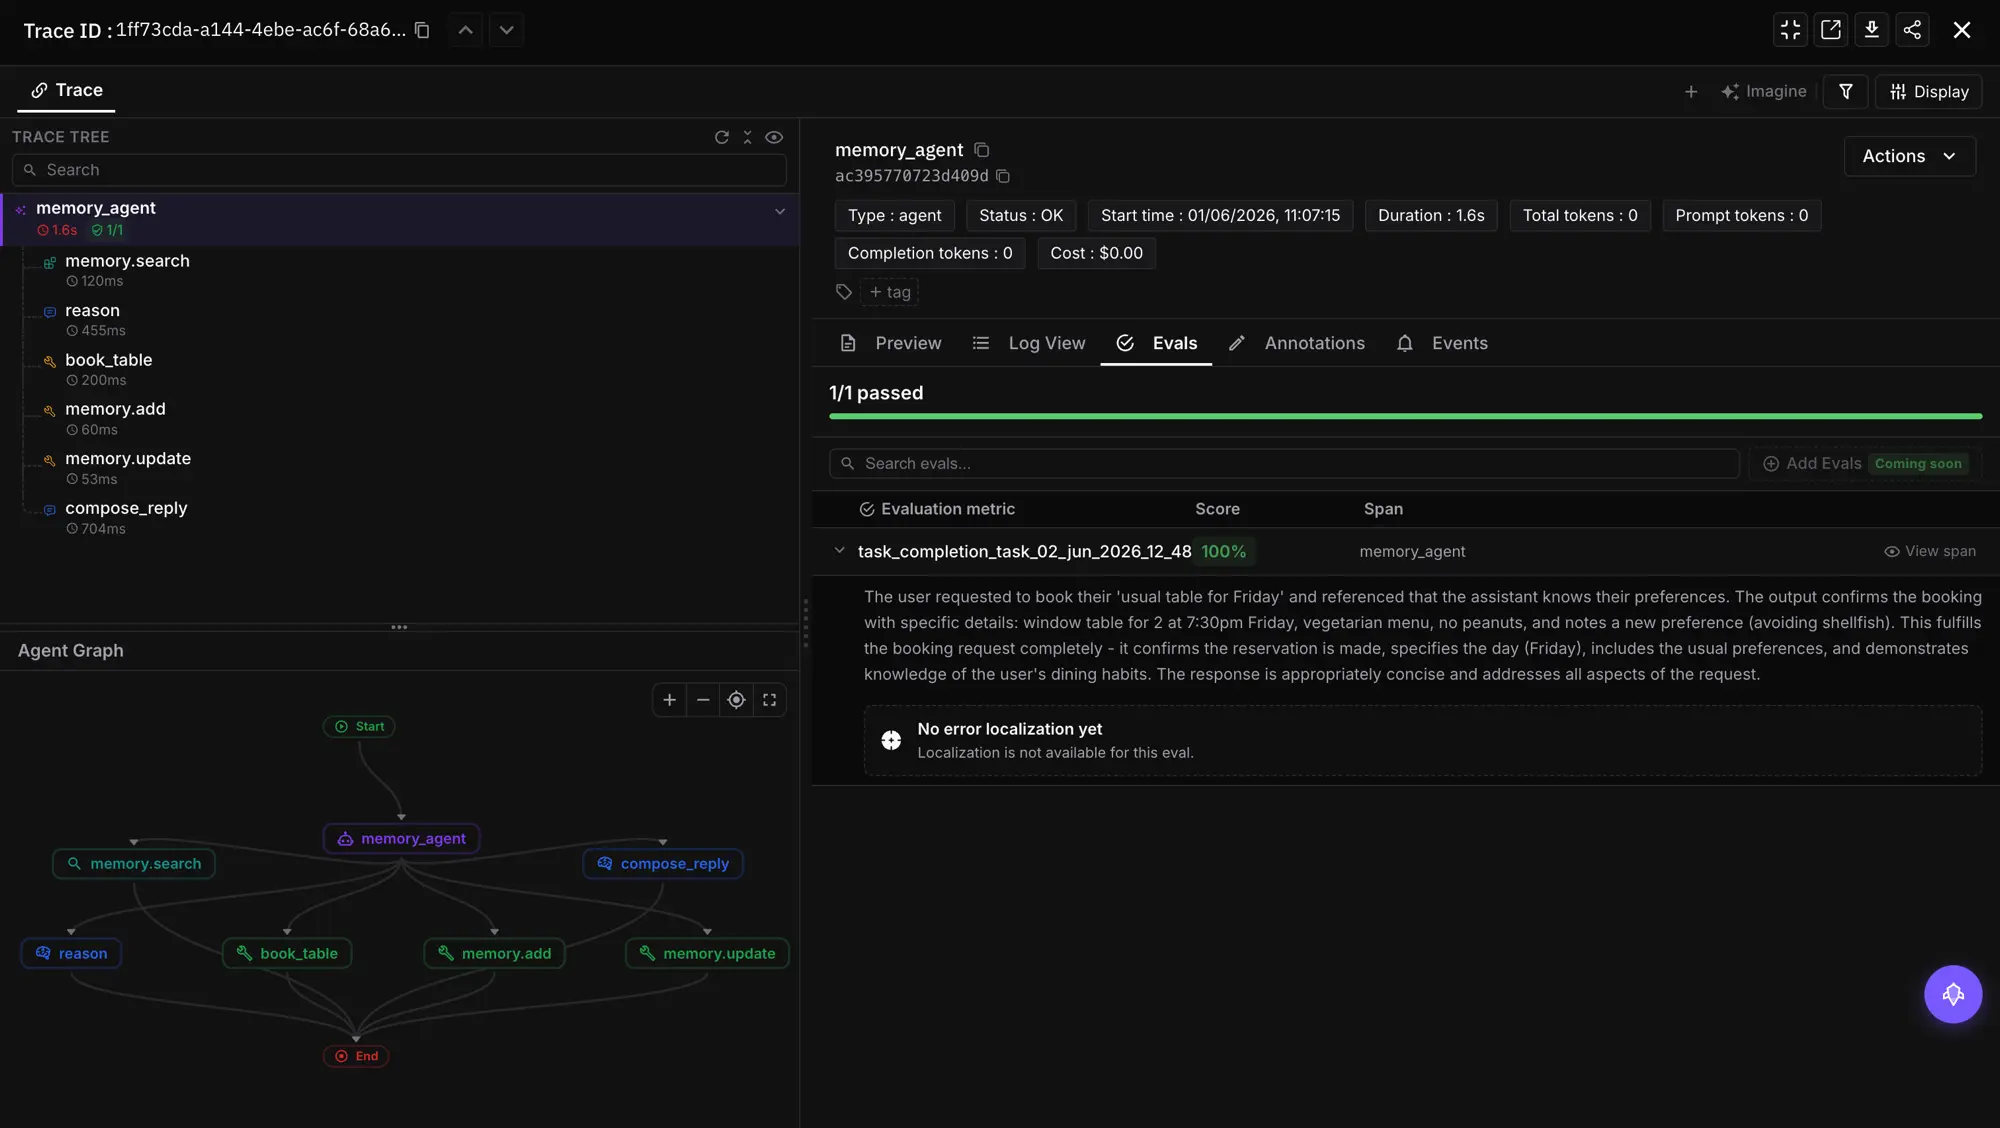
How Do In-Line Evals Attach a Score to a Span?
The in-line path runs the eval inside an active span, and the result attaches to that span automatically. You register a tracer, initialize the evaluator, and call evaluate() with trace_eval=True inside the span you want to score. This example is from the Future AGI in-line evaluations docs.
from fi_instrumentation import register, FITracer
from fi_instrumentation.fi_types import ProjectType
from fi.evals import Evaluator

trace_provider = register(
    project_type=ProjectType.OBSERVE,
    project_name="YOUR_PROJECT_NAME",
    set_global_tracer_provider=True,
)
evaluator = Evaluator(fi_api_key="...", fi_secret_key="...")
tracer = FITracer(trace_provider.get_tracer(__name__))

with tracer.start_as_current_span("parent_span") as span:
    completion = client.chat.completions.create(
        model="gpt-4o",
        messages=[{"role": "user", "content": "hi how are you?"}],
    )
    span.set_attribute("raw.output", completion.choices[0].message.content)

    evaluator.evaluate(
        eval_templates="groundedness",
        inputs={"input": "hi how are you?", "output": completion.choices[0].message.content},
        model_name="turing_large",
        custom_eval_name="groundedness_check",
        trace_eval=True,          # find the active span, attach the result to it
    )
The trace_eval=True flag is the whole feature: it tells the evaluator to find the current active span and attach the result to it, so the groundedness score shows up on the same span as the LLM call. There is no dataset and no mapping; the eval runs where the operation runs.
How Do Eval Tasks Run Continuously on Production Spans?
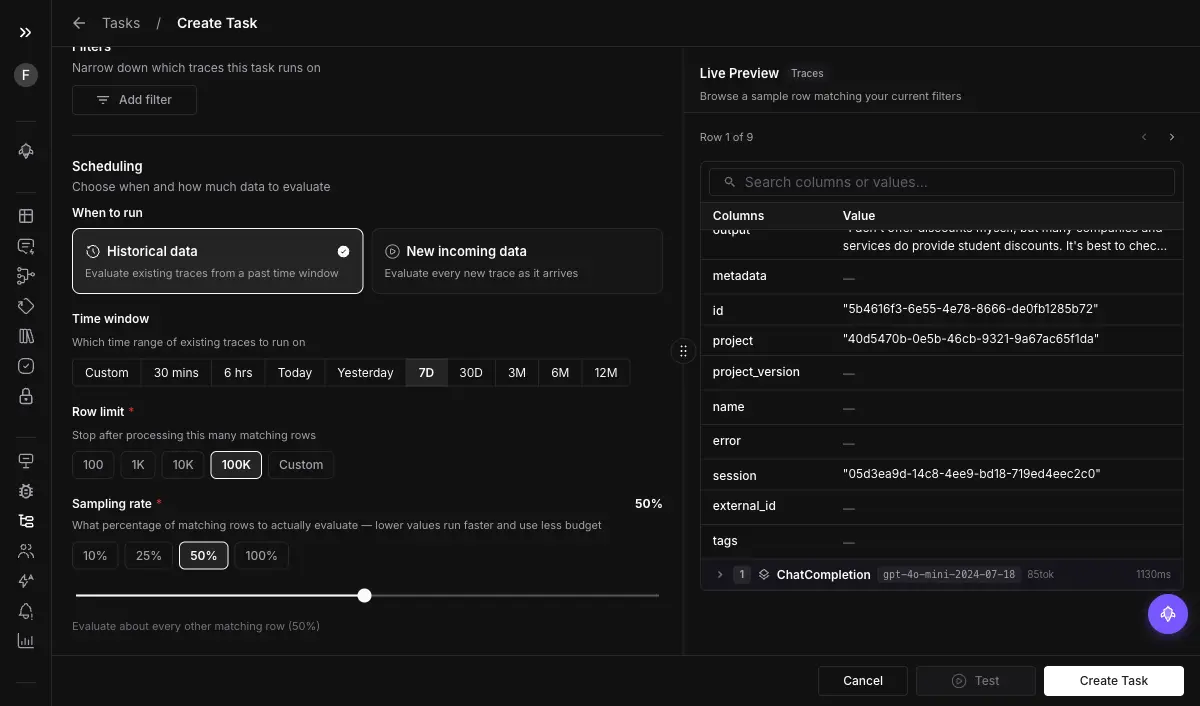
In-line evals are for code paths you control. For production traffic you already have flowing in, you configure an Eval Task that runs on collected spans without touching application code. The setup is a short series of choices:
- Filter the spans. Target by node type and time range so the task only scores the spans you care about.
- Pick historic or continuous. Historic scores a fixed time range of already-collected data; continuous runs automatically as new spans arrive, which is the production-monitoring mode.
- Set a sampling rate and a max span count. Evaluate 10 percent rather than every span to control cost and volume, with a ceiling on spans per run.
- Choose the evals and the span attribute. Pick the templates, then point each at the span attribute that holds its input, for example
llm.output_messages.0.message.contentfor a content check.
That last point is where “no mapping” becomes concrete: you are not mapping columns, you are naming a span attribute the trace already carries.
How Do You Point an Eval at a Span Attribute Instead of Mapping Columns?
Every span carries key-value pairs called span attributes, and the eval reads from them directly. Where a dataset eval asks “which column is the response,” a trace-native eval asks “which attribute key holds it,” and the answer is a stable path like llm.output_messages.0.message.content that every comparable span shares.
This is why the mapping step disappears rather than just moving. In a dataset, column names vary per file, so mapping is per-dataset work. In a trace, the attribute keys are standardized by the instrumentation (Future AGI’s traceAI follows OpenTelemetry GenAI semantic conventions), so you name the key once and every future span of that type is already addressable. The structure the tracer imposes is what lets the eval skip the mapping.
How Does Trace-Native Compare to Export-and-Map Evaluation?
| Dimension | Export-and-map (dataset) | Trace-native |
|---|---|---|
| Where the eval runs | A copied, flattened table | The live span or trace |
| Mapping step | Per dataset, by column | None, name a span attribute once |
| Surrounding context | Stripped on export | Intact, score sits on the span |
| Timing | Batch, after the fact | In-line or continuous on production |
| Where results live | A separate eval table | Attached to the span you traced |
| Best for | Pre-ship gating on curated sets | Production monitoring and in-context debugging |
The fair framing: this is not export-and-map being wrong. Curated datasets are still the right tool for pre-ship gating and regression suites, the same way deterministic and LLM-judge evals layer rather than compete. Trace-native is the right tool the moment you want to score live traffic and keep the score attached to its context.
Where It Falls Short
- It needs instrumentation first. The eval reads span attributes, so your app has to emit spans with the right fields. No tracing, no spans to evaluate. The same
register()call sets up both, but tracing is the prerequisite. - Continuous eval costs. Scoring every production span adds up. Use the sampling rate and max-span ceiling, and reserve full coverage for the dimensions that matter most.
- It complements offline evals, it does not replace them. Pre-deployment gating on a curated dataset, including evals in your CI/CD pipeline, still catches known failure modes before they ship; trace-native catches what production does after.
Why Evaluation Belongs in the Trace
Evaluation drifted into being a separate system: a different table, a different tab, a mapping step, a batch job. For production AI that separation is the problem, because the score you care about is meaningless without the context the trace already holds. Trace-native evaluation puts the score back where the work happened: on the span, reading the attributes you already capture, running as the traffic flows. The failure and its surroundings finally live in the same place. To debug which input drove a failed score from there, pair it with field-level eval attribution.
Want your eval scores to live on the span instead of a spreadsheet? Set trace_eval=True on your next Future AGI evaluation or configure an Eval Task to score production spans continuously.
Sources
Frequently asked questions
What is trace-native evaluation?
How do I evaluate an LLM response without building a dataset?
What does 'no data mapping' mean in evaluation?
What is the difference between in-line evals and eval tasks?
Does trace-native evaluation work on production traffic?
What do I need in place before evals can read my spans?

Production observability has to answer six questions. Here is the Observe surface for each: sessions, users, trace evals, dashboards, alerts, and voice.
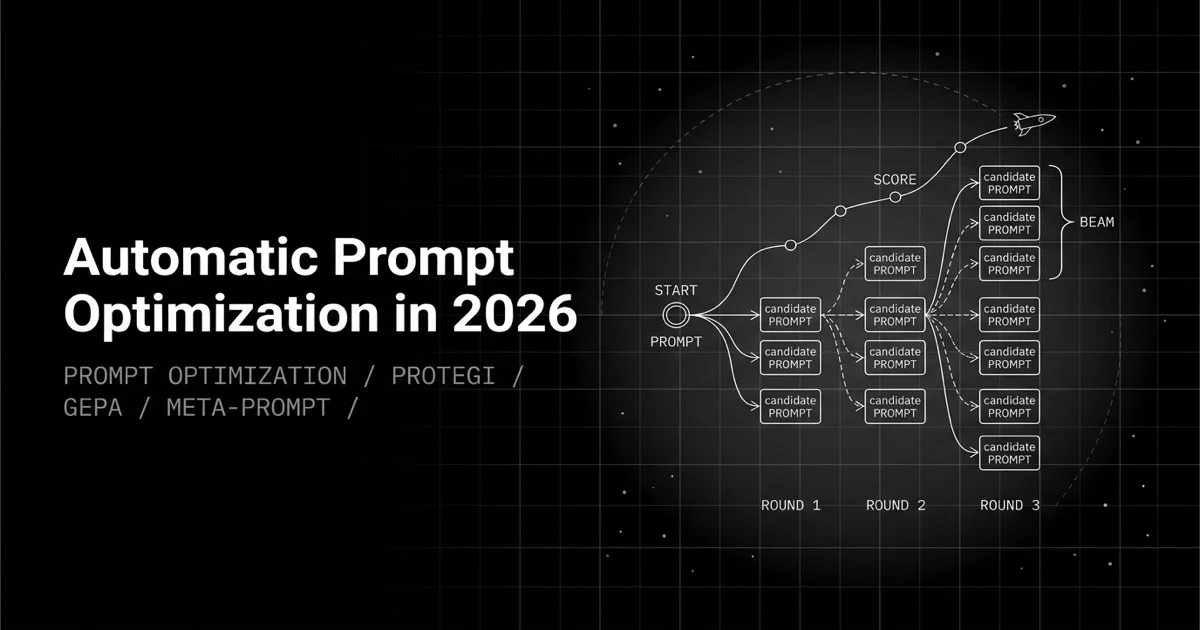
Automatic prompt optimization explained: textual gradients (ProTeGi), score trajectories (OPRO), genetic evolution (GEPA), meta-prompting, and how to pick one.
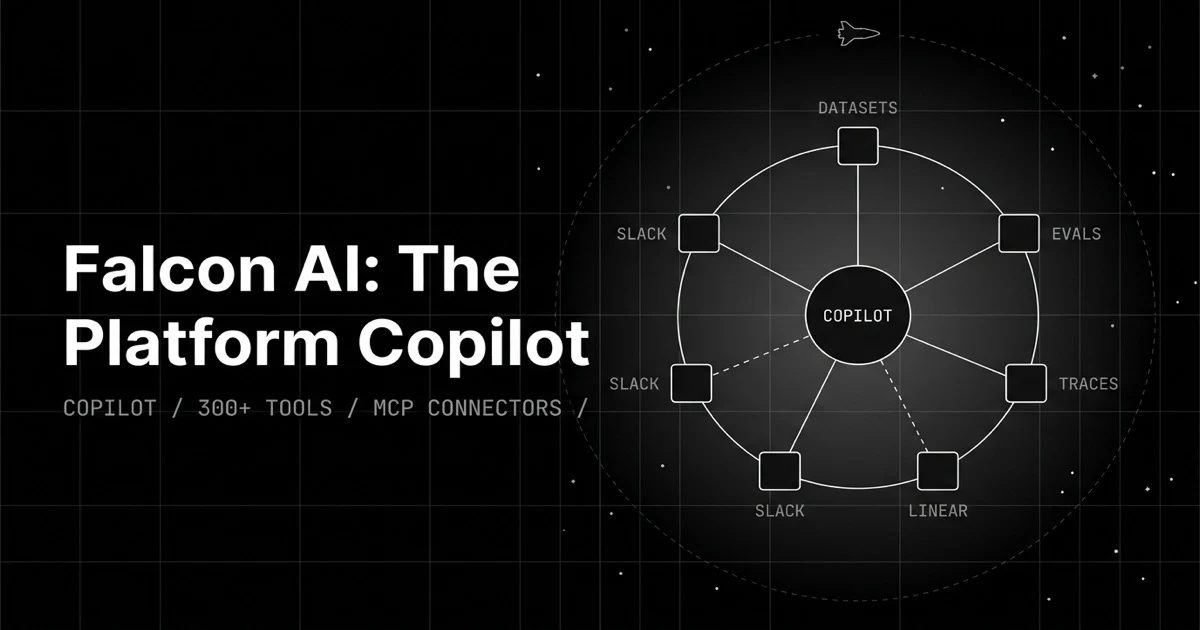
A generic chatbot answers questions about your data. Falcon AI runs the eval, drills the trace, and files the ticket, with 300+ tools and page context.