Error Analysis for LLM Applications: 2026 Workflow Guide
A 2026 error analysis workflow for LLM apps. Cluster failure cases, label root causes, prioritize fixes. Concrete dataset, code, and rubrics that ship.
Table of Contents
A team running a customer-support agent at a fintech ships a prompt update on a Wednesday. By Monday, escalation rate is up 14 percent and the customer success team is angry. The team’s eval dashboard says aggregate pass rate dropped from 91 percent to 87 percent; that’s all the data they have. Three days of debugging later, they find it: a small wording change in the system prompt caused the agent to refuse 4-of-10 valid refund requests on accounts older than 24 months. The fix is one line. The cost was three days because nobody had clustered the failures. Error analysis is the workflow that turns “we regressed” into “the >24-month-account refund cluster regressed by 18 percent on prompt v23 and you should look at the refusal logic.”
This guide walks through a practical seven-step error analysis workflow for production LLM teams, with code that works against a typical trace store and a reproducible structure for your own dataset. For the conceptual foundation, see what error analysis for LLMs is.
TL;DR: Error analysis in seven steps
| Step | Output | Tools |
|---|---|---|
| 1. Pull failed traces | List of trace_ids | trace store query |
| 2. Embed and cluster | Cluster id per trace | OpenAI embeddings + HDBSCAN |
| 3. Label root causes | Failure-mode tag per cluster | hand-label + LLM-judge assist |
| 4. Prioritize by impact | Top 3 to fix | spreadsheet |
| 5. Build regression set | Per-cluster dataset | jsonl |
| 6. CI gate per cluster | Per-cluster pass rate | pytest |
| 7. Re-run weekly | Fresh prioritization | scheduled job |
If you only read one row: the per-cluster pass rate is the unit of measurement that engineers actually want to see. Aggregate scores are lagging indicators.
Step 1: Pull failed traces
The signal sources for “failed”:
- Judge below threshold. Span-attached judge score below the per-rubric threshold (groundedness, refusal calibration, tool-call accuracy).
- User thumbs-down. Explicit feedback signal joined to the trace.
- Escalation. User escalated to a human or the agent self-escalated.
- Abandonment. Session ended before task completion.
- Schema violation. Structured output didn’t validate.
- Tool error. A tool call returned an error.
- Refusal mismatch. Refusal calibration judge said the agent refused valid or accepted invalid.
Pull 500-2,000 failed traces per workflow per week. Below 500, clusters are noisy. Above 2,000, triage time outpaces the value.
from datetime import datetime, timedelta
import os
from clickhouse_connect import get_client  # or whichever store you use

client = get_client(host=os.environ["CLICKHOUSE_HOST"])

def pull_failed_traces(workflow: str, days: int = 7) -> list[dict]:
    since = datetime.utcnow() - timedelta(days=days)
    # Use parameterized queries; never f-string user input into SQL.
    sql = """
        SELECT trace_id, query, response, judge_score, user_feedback, escalated
        FROM spans
        WHERE workflow = %(workflow)s
          AND timestamp >= %(since)s
          AND (judge_score < 0.7 OR user_feedback = 'down' OR escalated = true)
        LIMIT 2000
    """
    rows = client.query(sql, parameters={"workflow": workflow,
                                          "since": since.isoformat()}).result_rows
    return rows
Step 2: Embed and cluster
Embed each failure case using a query, response, and trace-summary string. Cluster with HDBSCAN (handles variable cluster size and a noise bucket) or KMeans with a chosen K (5-15 typical).
from openai import OpenAI
from sklearn.cluster import HDBSCAN
import numpy as np

oai = OpenAI(api_key=os.environ["OPENAI_API_KEY"])

def cluster_failures(rows: list[dict]) -> dict:
    texts = [f"Query: {r['query']}\nResponse: {r['response']}" for r in rows]
    # Batch-embed
    emb_resp = oai.embeddings.create(model="text-embedding-3-small", input=texts)
    embeddings = np.array([e.embedding for e in emb_resp.data])
    # Cluster
    clusterer = HDBSCAN(min_cluster_size=20, metric="cosine")
    labels = clusterer.fit_predict(embeddings)
    clusters = {}
    for row, label in zip(rows, labels):
        clusters.setdefault(int(label), []).append(row)
    return clusters
HDBSCAN’s noise bucket (label = -1) is fine; investigate it last. Most production workloads land on 8-15 named clusters plus noise.
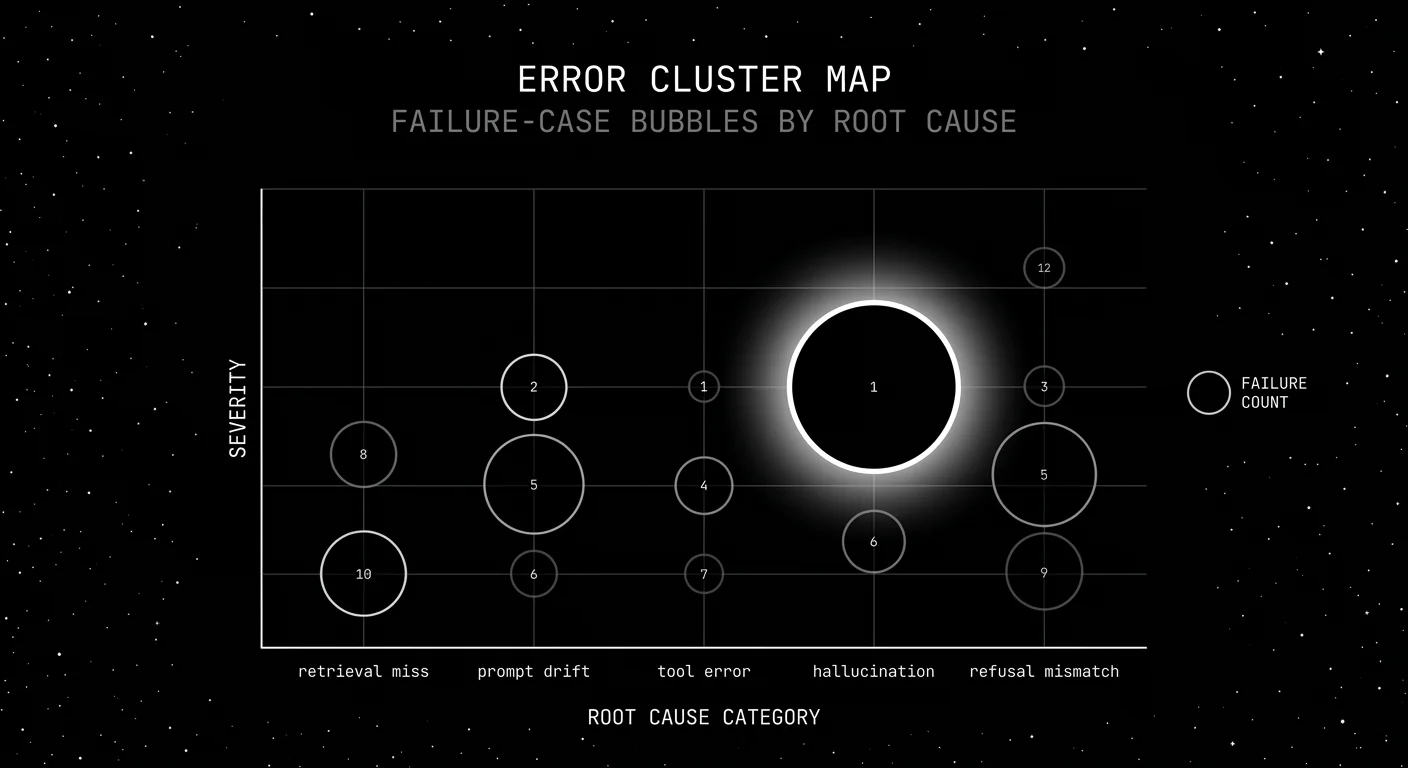
Step 3: Label root causes
Hand-label each cluster with a failure-mode tag. Two reviewers, kappa above 0.6 minimum.
The 2026 failure-mode taxonomy (the five-category agent failure taxonomy covers the agent-specific modes in depth):
| Tag | Description | Common cause |
|---|---|---|
retrieval_miss | RAG returned wrong chunks | Stale index, query rewrite bug |
prompt_drift | Model behavior shifted on same prompt | Provider model update |
tool_error | Tool call failed or had wrong args | Schema mismatch, expired token |
hallucination | Factually wrong, not refused | Long context, weak grounding |
refusal_mismatch | Refused valid or accepted invalid | Refusal threshold off |
schema_violation | Output didn’t validate | Free-form prompt, missing structured output |
context_overflow | Input exceeded effective context | Long history, no summarization |
persona_break | Broke character | Adversarial input, jailbreak |
tone_mismatch | Wrong register or empathy | Prompt edits |
latency_breach | Above p99 budget | Provider issue, retries |
LLM-as-judge can assist labeling at the cluster level; pull 5 representative samples per cluster, ask a frontier model to suggest the tag, then human-confirm.
Step 4: Prioritize by impact
Frequency alone is misleading. A 12 percent failure on FAQ matters less than a 1 percent failure on refund. Get an impact weight from the business owner per intent class.
IMPACT_WEIGHTS = {
    "refund": 10,
    "onboarding": 7,
    "billing": 6,
    "support": 4,
    "faq": 1,
}

def prioritize(clusters: dict) -> list[dict]:
    ranked = []
    for cluster_id, rows in clusters.items():
        if cluster_id == -1:
            continue
        n = len(rows)
        # weighted by intent class
        weight = sum(IMPACT_WEIGHTS.get(r.get("intent", "support"), 1) for r in rows)
        impact = n * (weight / max(n, 1))
        ranked.append({"cluster_id": cluster_id, "size": n, "impact": impact,
                       "tag": rows[0].get("tag", "unlabeled")})
    ranked.sort(key=lambda x: -x["impact"])
    return ranked
Fix the top 3 this sprint. Re-run after the fix.
Step 5: Build regression set per cluster
Each labeled cluster contributes 50-200 rows to its regression dataset. The dataset rows are the original failed traces plus a gold answer (corrected by a human reviewer or the post-fix expected output).
def build_regression_set(clusters: dict, output_dir: str):
    os.makedirs(output_dir, exist_ok=True)
    for cluster_id, rows in clusters.items():
        if cluster_id == -1:
            continue
        tag = rows[0].get("tag", "unlabeled")
        with open(f"{output_dir}/{tag}_cluster_{cluster_id}.jsonl", "w") as f:
            for row in rows[:200]:
                f.write(json.dumps({
                    "query": row["query"],
                    "response_actual": row["response"],
                    "expected_pattern": row.get("gold_pattern", ""),
                    "tag": tag,
                }) + "\n")
Step 6: CI gate per cluster
Each cluster gets its own pass-rate gate.
# tests/test_clusters.py
import pytest
from glob import glob

CLUSTER_FILES = glob("data/clusters/*.jsonl")

@pytest.mark.parametrize("cluster_file", CLUSTER_FILES)
def test_cluster_pass_rate(cluster_file):
    rows = [json.loads(line) for line in open(cluster_file)]
    threshold = THRESHOLDS.get(cluster_file, 0.7)
    pass_count = 0
    for row in rows:
        actual = run_agent(row["query"])
        if matches_expected(actual, row["expected_pattern"]):
            pass_count += 1
    pass_rate = pass_count / len(rows)
    assert pass_rate >= threshold, \
        f"Regression in {cluster_file}: {pass_rate:.3f} < {threshold}"
A merge that regresses a known cluster blocks. The PR comment surfaces which cluster regressed.
Step 7: Re-run weekly
Schedule the full workflow weekly. Three things shift across runs:
- Cluster shape. New failure modes appear; stale ones shrink.
- Prioritization. As the top cluster shrinks (because you fixed it), the next one rises.
- Regression set. Datasets grow; old rows still pass; new rows pressure the next prompt update.
A weekly cadence keeps error analysis a workflow, not a one-time investigation.
Common mistakes in error analysis
- Eyeballing 20 traces. A real cluster needs at least 100 examples. Pattern recognition on 20 is noise.
- Single-engineer triage. Without two reviewers, kappa is unverified.
- Frequency-only prioritization. A 1 percent refund failure beats a 12 percent FAQ failure.
- No closed loop. A fix without a regression test gets re-broken next quarter.
- Stale cluster labels. Clusters drift; refresh labels every 4-6 weeks.
- Hand-labeling everything. LLM-judge assists at the cluster summary level; the judge is the speed multiplier.
- No business impact weights. Engineers cannot guess weights; ask the business owner.
- Skipping noise bucket. HDBSCAN’s noise often hides the most informative outliers.
Tools that support error analysis in 2026
- FutureAGI. Apache 2.0. Trace store with cluster queries, dataset auto-build, judge calibration. ClickHouse-backed.
- LangSmith. Closed platform. Datasets, clusters by user-feedback signal.
- Langfuse. MIT core. Datasets v2, annotation queues, judge runs over clusters.
- Phoenix. ELv2. OpenInference-aligned trace store, cluster analysis.
- Custom on Postgres + scikit-learn. A 200-line Python script gets you 80 percent of the workflow if you do not want a platform.
Recent error analysis updates
| Date | Event | Why it matters |
|---|---|---|
| Mar 2026 | FutureAGI shipped Agent Command Center and ClickHouse trace storage | Cluster queries across millions of spans became cheap. |
| 2023 | HDBSCAN added to scikit-learn 1.3 | HDBSCAN became a one-import default; pin scikit-learn>=1.3. |
| Jan 2024 | OpenAI text-embedding-3 family | text-embedding-3-small at $0.02 per 1M tokens (current) made large-scale failure clustering cheap; text-embedding-3-large is $0.13 per 1M. |
| Jun 2025 | Galileo Luna 2 announcement | Smaller-language-model judges with lower latency and cost than frontier judges, available on Galileo Enterprise. |
| Dec 2025 | DeepEval v3.9.x agent metrics | First-party metrics for tool-call, plan, and conversational failures aligned with cluster tags. |
Sources
- scikit-learn HDBSCAN
- OpenAI embeddings
- DeepEval GitHub
- traceAI GitHub repo
- OpenInference GitHub repo
- Phoenix docs
- Langfuse docs
- LangSmith datasets
- FutureAGI pricing
- Galileo research
- Cohen’s kappa
- OpenTelemetry GenAI semantic conventions
Series cross-link
Read next: Best LLM Monitoring Tools 2026, LLM Testing Playbook 2026, LLM Observability Platform Buyer’s Guide 2026
Related reading
Frequently asked questions
What is error analysis for LLM applications?
Why does error analysis matter in 2026?
How do I cluster failure cases in 2026?
What are the common failure modes for LLM apps?
How do I prioritize fixes from error analysis?
Can I run error analysis without a proprietary SDK?
How does error analysis fit into CI?
What are common mistakes in error analysis?

FutureAGI, Langfuse, Phoenix, Braintrust, LangSmith, and DeepEval as Comet Opik alternatives in 2026. Pricing, OSS license, judge metrics, and tradeoffs.


What LLM observability captures, what LLM evaluation scores, where the two overlap, and the seven axes that separate them in 2026 across vendors.

Honest 2026 comparison of Langfuse alternatives: Future AGI, LangSmith, Phoenix, Braintrust, Helicone on eval depth, gateway, and the loop.
