Observability vs Monitoring: What the Difference Means for AI Agents
The observability vs monitoring difference decides whether you catch a wrong-but-successful agent answer that green dashboards hide, and why evals catch it.
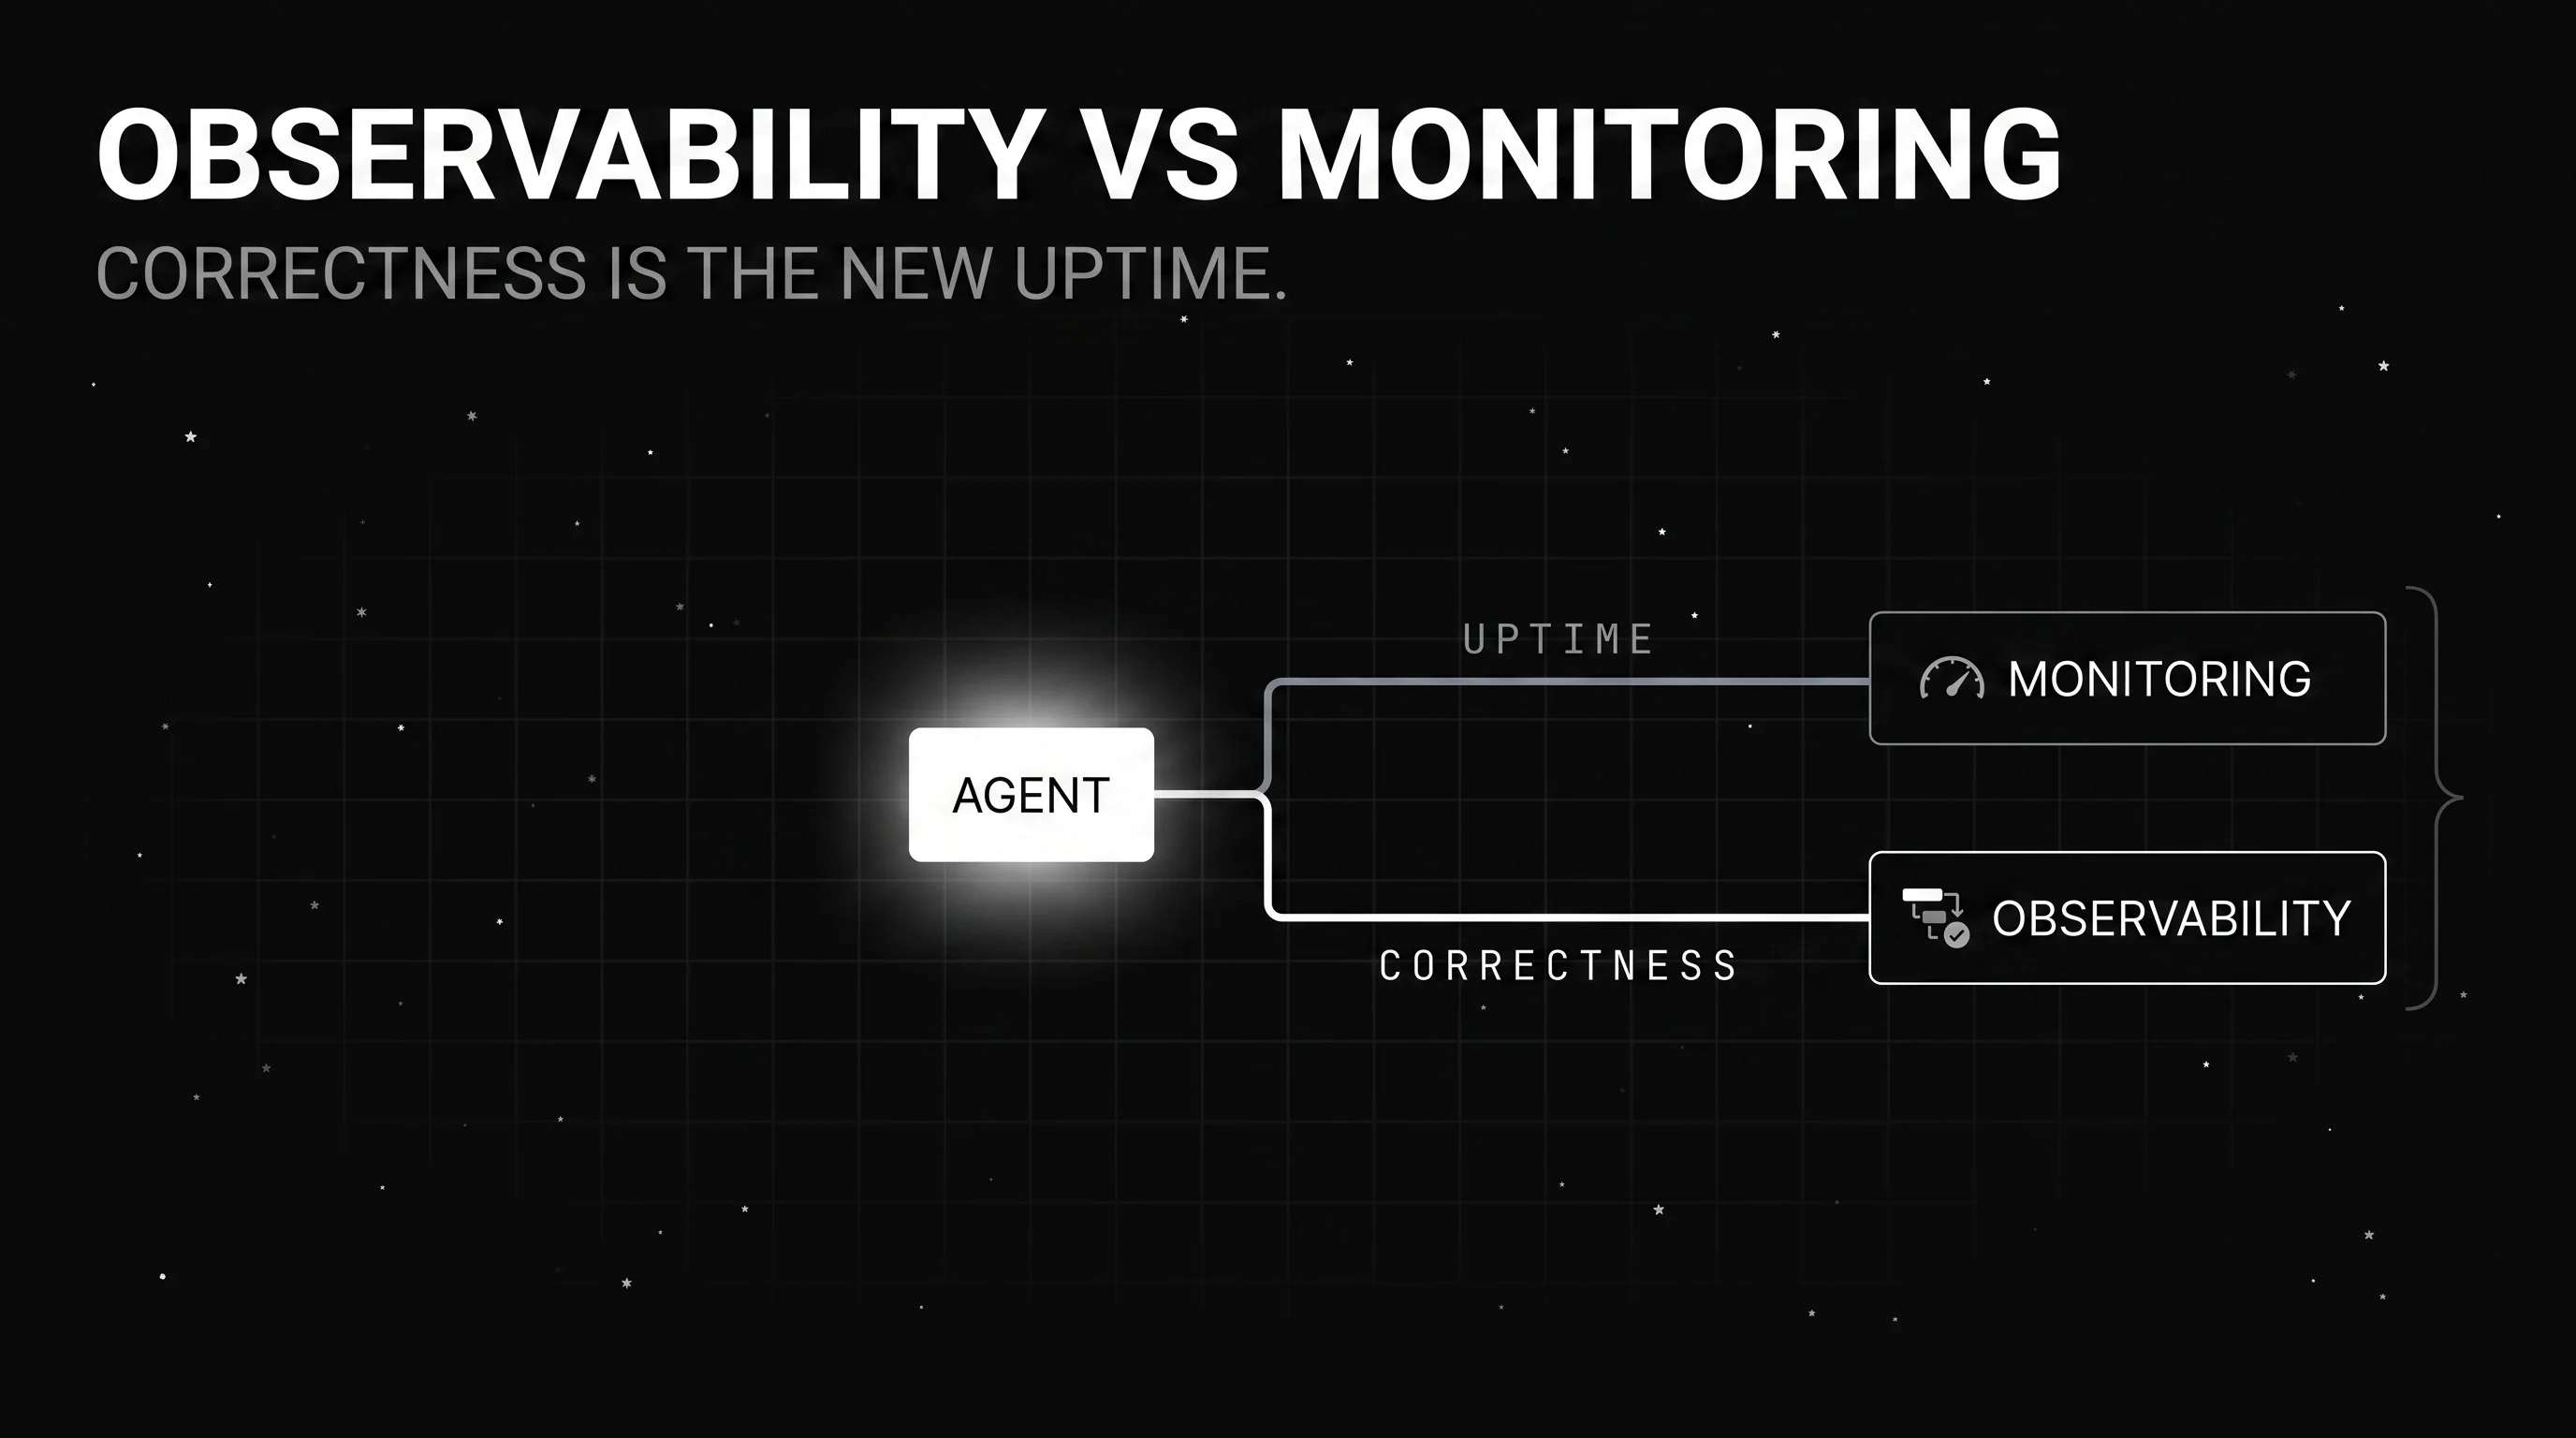
Table of Contents
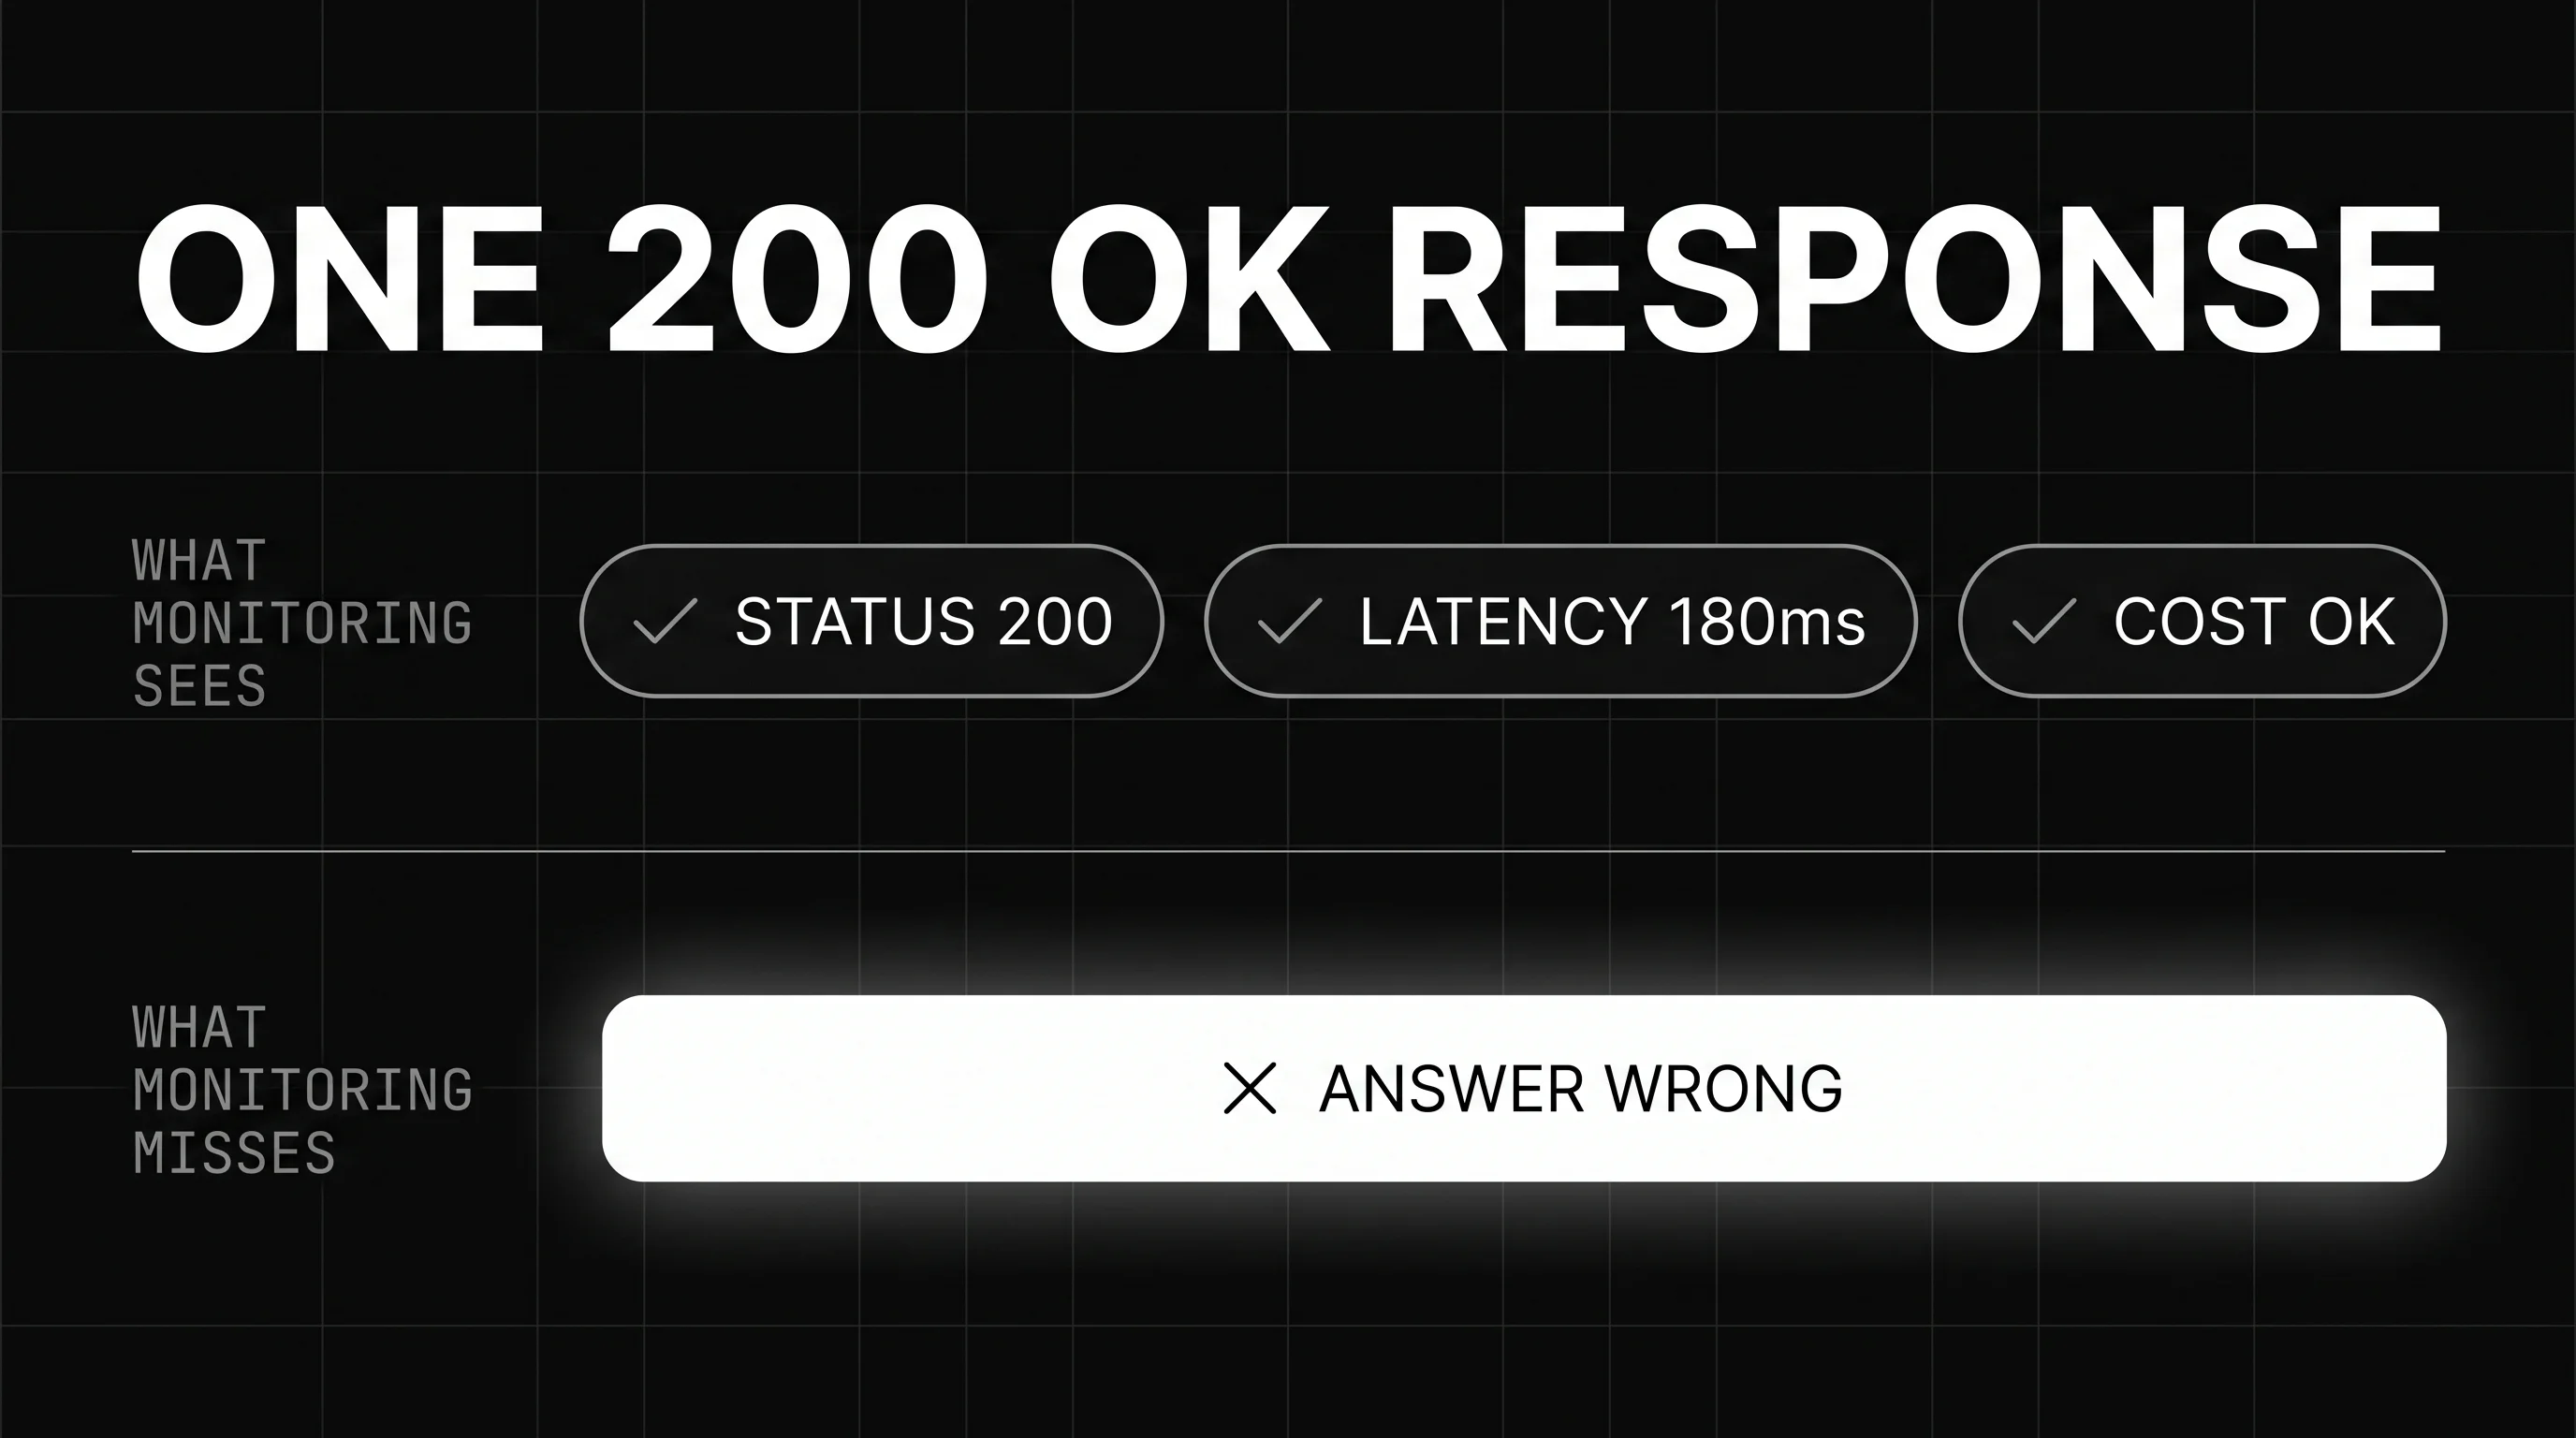
Your AI agent just returned a 200 OK in 180 milliseconds. Latency looks fine, the error rate is flat, and every dashboard is green. It also confidently invented a refund policy that does not exist, and monitoring never flagged it. That gap is what observability vs monitoring is really about.
Teams keep treating observability vs monitoring as two words for the same thing. For traditional services that blur was mostly harmless. For AI agents it gets expensive, because an agent can fail while every metric you watch stays green. The difference decides whether you ever see that failure at all.
Monitoring watches for problems you already know how to describe. Observability lets you ask questions you did not plan for, using the data your system emits. One tells you a known threshold broke. The other helps you explain a failure nobody predicted. Agents produce that second kind constantly.
This guide answers the classic distinction first, then spends its back half on what changes for AI agents. You will see the three pillars, why deterministic monitoring misses a wrong answer, how evaluation becomes the new correctness check, and where both layers still belong together in production.
Observability vs Monitoring: The Core Difference
The core observability vs monitoring difference is the kind of question each one answers. Monitoring tracks known failure modes with predefined metrics and thresholds, so it answers what broke and when. Observability infers a system’s internal state from its outputs, so it answers why and how something failed in the first place.
The idea comes from control theory. In 1960, the engineer Rudolf Kálmán defined a system as observable when its internal state can be inferred from its external outputs. Modern software borrows that directly. If your telemetry lets you reconstruct what happened inside a system, that system is observable.
What monitoring does
Monitoring is the practice of watching predefined signals and firing alerts when they cross a line. You pick the metrics in advance: CPU, latency, error rate, queue depth. Dashboards chart them, thresholds guard them, and alerts page you. It is very good at catching the failures you already knew to anticipate.
What observability does
Observability starts from the raw telemetry and works outward. Instead of pre-chosen thresholds, you explore logs, metrics, and traces together to answer questions you never wrote in advance. When a novel failure shows up, observability is what lets you investigate it there and then, without shipping new instrumentation first.
| Dimension | Monitoring | Observability |
|---|---|---|
| Question answered | Known-unknowns | Unknown-unknowns |
| Approach | Predefined thresholds | Exploratory investigation |
| Primary data | Metrics and alerts | Logs, metrics, and traces |
| Failure it catches | Crash or latency spike | Silent or novel failure |
| Posture | Reactive | Proactive |
Read the two as complementary layers. Monitoring gives a fast signal that something crossed a known line. Observability gives you room to ask why when that signal makes no sense. Production systems lean on both, and agent systems lean on them even harder than classic services ever did.
The Three Pillars of Observability
Three pillars make a system observable: logs, metrics, and traces. Logs are discrete, timestamped records of individual events. Metrics are aggregated numeric measurements over time. Traces follow a single request as it moves across services. Together they let you reconstruct what a system did and why it did it.
Each pillar answers a different question. Metrics tell you that something changed, like a latency jump at noon. Logs tell you what a specific component recorded at that exact moment. Traces tell you the path a request took and where it slowed down. Correlated, the three turn a raw symptom into a root cause.
Picture a real incident. A metric shows checkout latency doubled at noon. A trace pins the slowdown to one payment call, and the logs for that service show a timeout to a third party. No single pillar named the cause on its own, and the three together did within minutes.
The pillars matter because no single signal is enough on its own. A metric without a trace raises an alarm you cannot explain. A trace without metrics has no baseline to stand against. Real observability comes from holding all three signals and moving between them freely as questions arise.
The model also has critics. Some practitioners argue real observability comes from high-cardinality events you can slice any way after the fact, and that logs, metrics, and traces name data types more than they define observability itself. Treat the three pillars as a popular starting frame, not a settled definition.
Some vendors add pillars like user experience or security telemetry on top of the core three. Those extensions are useful, and the base three still carry most of the weight. For LLM systems the same pillars apply, though what they capture changes sharply, which the next sections make concrete.
Why Does Monitoring Fall Short for AI Agents?
Monitoring falls short for AI agents because it assumes a successful response is a correct one. A traditional service that returns 200 OK has usually done its job. An LLM agent can return 200 OK just as fast and still hand back an answer that is wrong, unsafe, incomplete, or off-policy.
The silent semantic failure
This is the silent semantic failure. The request was fast, cheap, and technically successful, so every metric stays green while the output is quietly wrong. Latency dashboards cannot see it, because nothing about the response timing looks abnormal. The failure lives in the meaning of the answer, not in its status code.
That is exactly the refund policy from the opening. The agent invented a rule, returned it in perfect health, and monitoring reported a clean run. No threshold was ever designed to ask whether the content was actually true. Deterministic monitoring simply has no place to put that kind of question.
A dashboard is built from questions you asked ahead of time. It shows only the metrics you chose to chart and the thresholds you set. A wrong-but-successful answer matches none of them, so it passes every check by design. The dashboard stays blind to the meaning of the response.
Non-deterministic execution paths
Agents also break the assumption of a fixed path. One request can trigger three tool calls on one run and seven on another, depending on what the model decides. Static thresholds struggle to define normal when the path varies run to run. A rule expecting a set number of steps may alert on healthy behavior and miss real trouble.
So the monitoring vs observability gap widens sharply for agents. The questions that matter are causal and semantic: which step went wrong, and was the final answer any good. Those questions need trace-level detail and a correctness check, neither of which a fixed threshold on its own can ever provide.
What Observability Means for AI Agents
For AI agents, observability means reframing the three pillars around model behavior instead of infrastructure. The same logs, metrics, and traces still apply, but each one now captures something LLM-specific. The goal shifts from is the service healthy to did the agent reason and answer correctly on this particular run.
Logs, metrics, and traces for agents
The pillars take on new content. Logs become prompt and response pairs, the retrieved context, and the model version behind each call. Metrics become tokens per run, cost per model, and quality or hallucination scores. Traces become multi-step spans across tool calls, retrievals, and memory reads and writes within a single agent run.
| Pillar | Traditional system | AI agent |
|---|---|---|
| Logs | System and error logs | Prompts, responses, context, model version |
| Metrics | CPU, memory, latency | Tokens, cost, quality, hallucination rate |
| Traces | Service-to-service calls | Agent steps: tool calls, retrievals, memory |
The session as the unit of analysis
The unit of analysis also grows. For a web service the single request is usually enough. For an agent the session is what matters, because a conversation spans many calls that share state and memory. A failure often emerges across steps, so you have to watch the whole session, not one isolated call.
That session view is what makes agent observability different in practice. You go past checking whether each call simply returned a response. You follow how context, tool results, and model decisions accumulate into a final answer, then ask exactly where that chain went right or wrong.
This is where observability for LLMs earns its keep in production. The raw traces show the full path of a run, and the LLM-specific logs and metrics give that path real meaning. What is still missing is a verdict on quality, which the next section adds on top. Tracing shows the run; evaluation grades it.
Evaluation Is the New Monitoring for AI Agents
For AI agents, evaluation plays the role monitoring plays for infrastructure. Online evaluation attaches quality scorers, including custom evals and LLM-as-judge checks, to live production traces and spans. Tracing tells you what the agent did on a given run. Evaluation tells you whether what it did was actually any good.
That pairing is the agent equivalent of a monitoring alert, moved from uptime to correctness. A threshold alert says the service is slow. An online eval says the last hundred answers drifted off-policy, or that faithfulness dropped after a prompt change. One guards availability, the other guards output quality on real traffic.
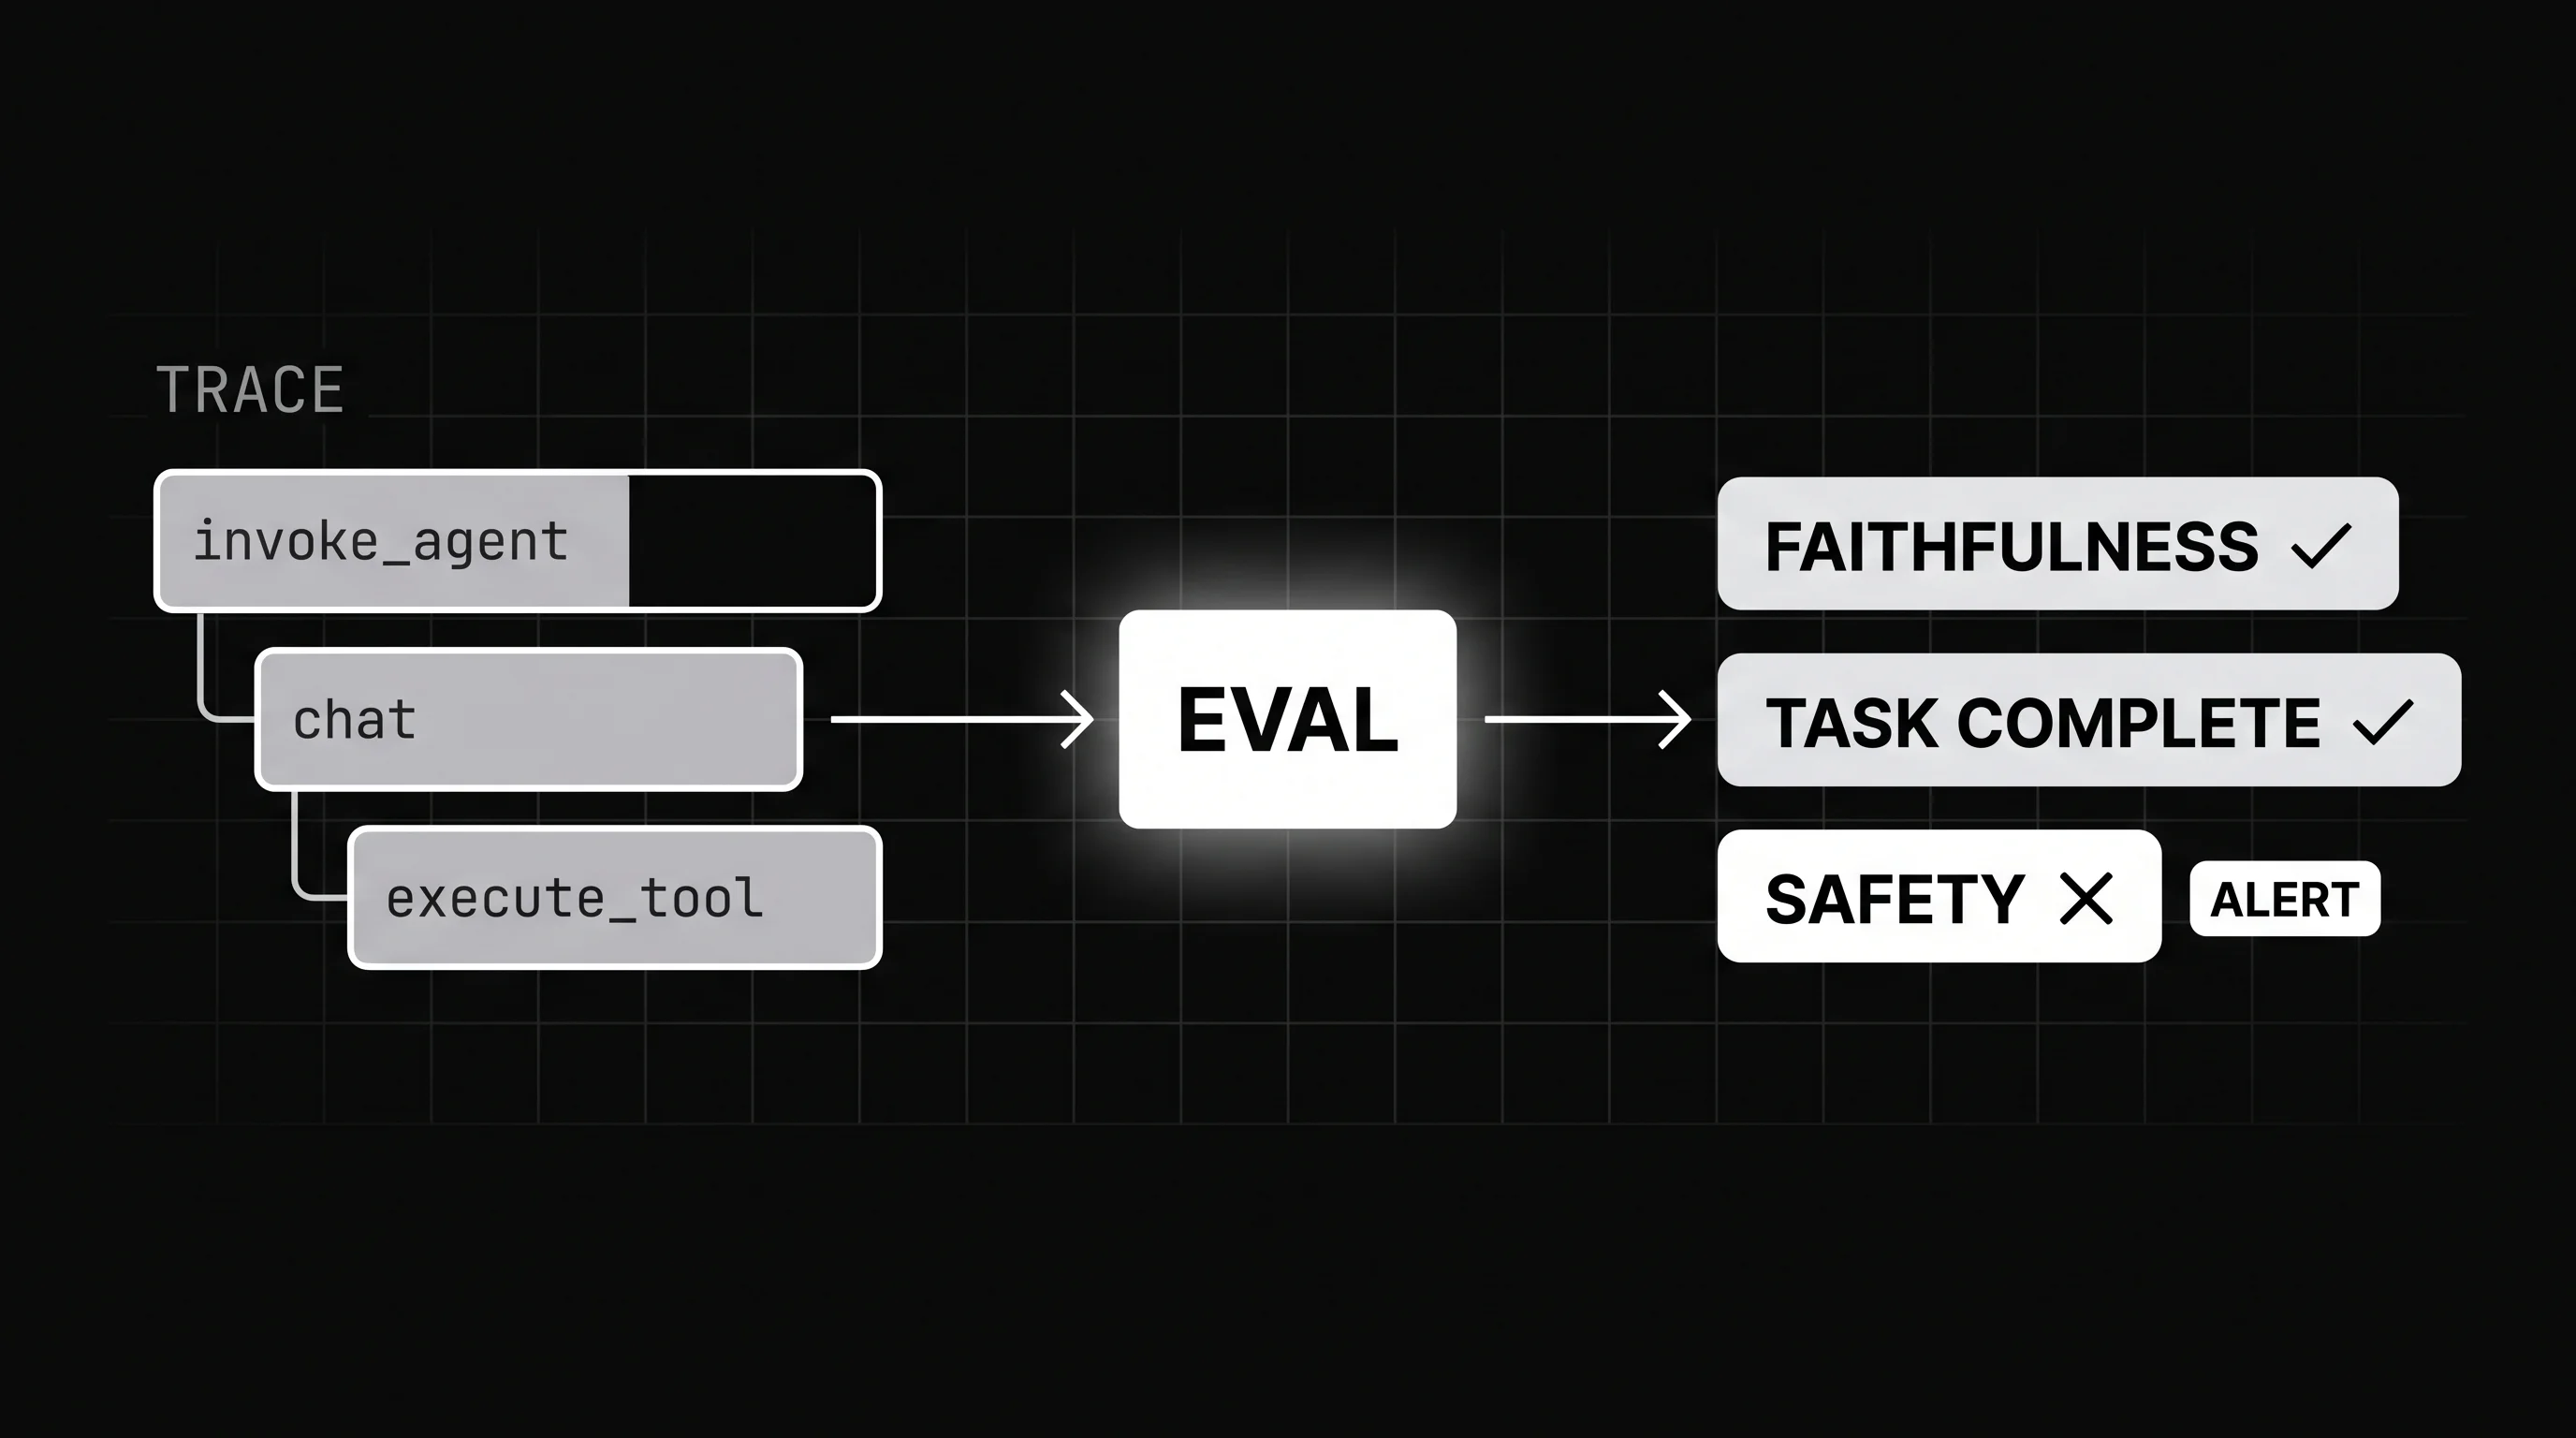
Eval signals become first-class metrics you can watch over time. Faithfulness, task completion, safety regressions, and prompt drift each turn into a scored series on live traffic. When one slips, you get the same early warning a latency alert gives, except now it is warning you about meaning rather than about speed.
None of this replaces traces; it sits directly on top of them. The trace supplies the evidence of what happened, and the eval supplies the judgment of whether it was right. Read together, they turn a silent semantic failure into a scored, visible, alertable event you can act on.
This is the correctness layer that threshold monitoring cannot provide for agents. It runs on production traces, not a static test set, so it catches wrong-but-successful answers as they happen. For a fuller picture of the space, see our guide to LLM observability and monitoring.
How OpenTelemetry Standardizes AI Agent Observability
OpenTelemetry standardizes AI agent observability by giving agent telemetry a shared vocabulary. Its GenAI semantic conventions define standard operations like invoke_agent, execute_tool, and chat, each emitted as a span named after the operation, plus gen_ai attributes for the model, tokens, and outcomes. Instrument once against that standard and your agent traces stay portable across tools.
Portability is the payoff. Popular agent frameworks can emit OpenTelemetry-compliant spans, and major observability vendors can read them, so you avoid lock-in to one proprietary format. The same agent trace can feed two backends at once, or move to a new one later, without re-instrumenting every tool call by hand.
One honest caveat belongs here. As of August 2026 these GenAI conventions are still maturing: every agent span and attribute is marked development-stage, not stable, and names can shift between versions. They were split into a dedicated OpenTelemetry GenAI semantic conventions repository. Pin your instrumentation versions and plan to update as the standard settles.
The direction of travel is clear even so. Agent observability is converging on an open standard rather than a dozen proprietary schemas. For a deeper look at instrumenting spans well, see our notes on LLM tracing best practices and how to structure them.
When You Still Need Both Observability and Monitoring
You do not drop monitoring when you adopt observability and evals. Monitoring still tracks infrastructure health: uptime, latency, error rates, and resource limits. Observability plus evals tracks agent behavior and output correctness. The two cover different failure classes, and a production agent stack needs protection against both at once.
The practical split is clean. Let monitoring alert on infrastructure, so you know instantly when a service is down or slow. Let observability and online evals investigate and gate quality, so you know when the agent is confidently wrong. One keeps the system running, the other keeps the answers trustworthy.
Skipping either one leaves a hole. Monitoring alone passes a fast, cheap, wrong answer straight through to users. Observability alone can explain a bad run but will not page you the moment the servers fall over. Both layers together are what production AI actually requires, not a choice between the two.
So the observability vs monitoring answer, for agents, is both, with a clear division of labor. Monitoring owns the infrastructure signal. Observability and evals own the behavior and correctness signal. Keep them side by side and each one covers the exact blind spot that the other one has.
AI Agent Observability with Future AGI
This is where Future AGI’s Observe fits the agent observability problem. Observe captures each instrumented production request as a trace you can open, search, and score, then attaches quality scores from custom evals to whole traces or single spans on live traffic. It puts a real correctness check on actual agent behavior.
The detail that matters here is scoring on live production traces, not a static test set. Observe follows a full conversation, or one customer across sessions, so the session view this post described is native to it.
Custom evals run on that live traffic and flag the wrong-but-successful answers that infrastructure monitoring waves right through.
On top of the traces and scores sit an error feed and alerts, so a quality drop reaches you the moment a metric slips. That closes the loop back to the opening scenario. The invented refund policy would surface as a low-scoring trace, rather than hiding behind a green dashboard as a silent failure.
It is the correctness layer this whole comparison points toward, running directly on live agent traffic. For a sense of where it sits among similar tools, see our roundup of the best AI agent observability tools and how the leading ones compare on production scoring.
Correctness Is the New Uptime for AI Agents
Here is the takeaway. Monitoring tells you the system is up. Observability plus evals tells you the agent is right. For traditional services those two questions nearly overlapped. For AI agents they have split apart, and correctness is the new part you now have to measure on purpose.
Go back to the green dashboard and the invented refund policy. With trace-level observability and a correctness eval on live traffic, that answer stops being invisible. The metrics still read healthy, and now a low quality score flags the exact run that monitoring alone would have quietly passed.
For an agent, uptime is only half of the real question. Whether the answer was actually right is the other half. Future AGI is built to help teams see and score agent behavior in production, so correctness gets watched just as closely as uptime always has been.
Frequently Asked Questions
What is the difference between observability and monitoring?
Why does monitoring fall short for AI agents?
Is observability just monitoring with extra steps?
What are the three pillars of observability?
Do AI agents still need monitoring?
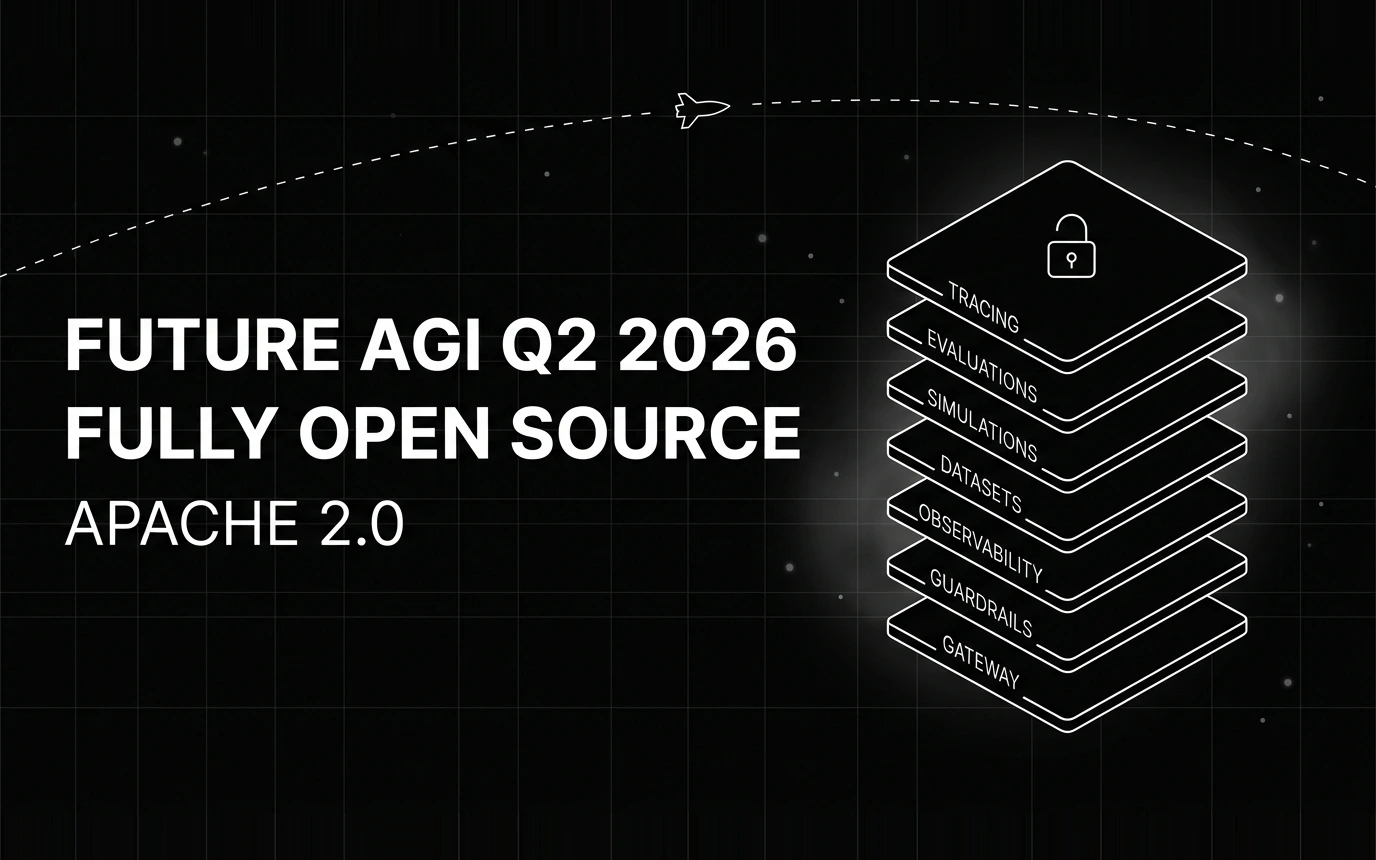
Inside Future AGI open source in Q2 2026: the platform shipped under Apache 2.0, Error Feed and the Agent Command Center went live, traces hit billions.

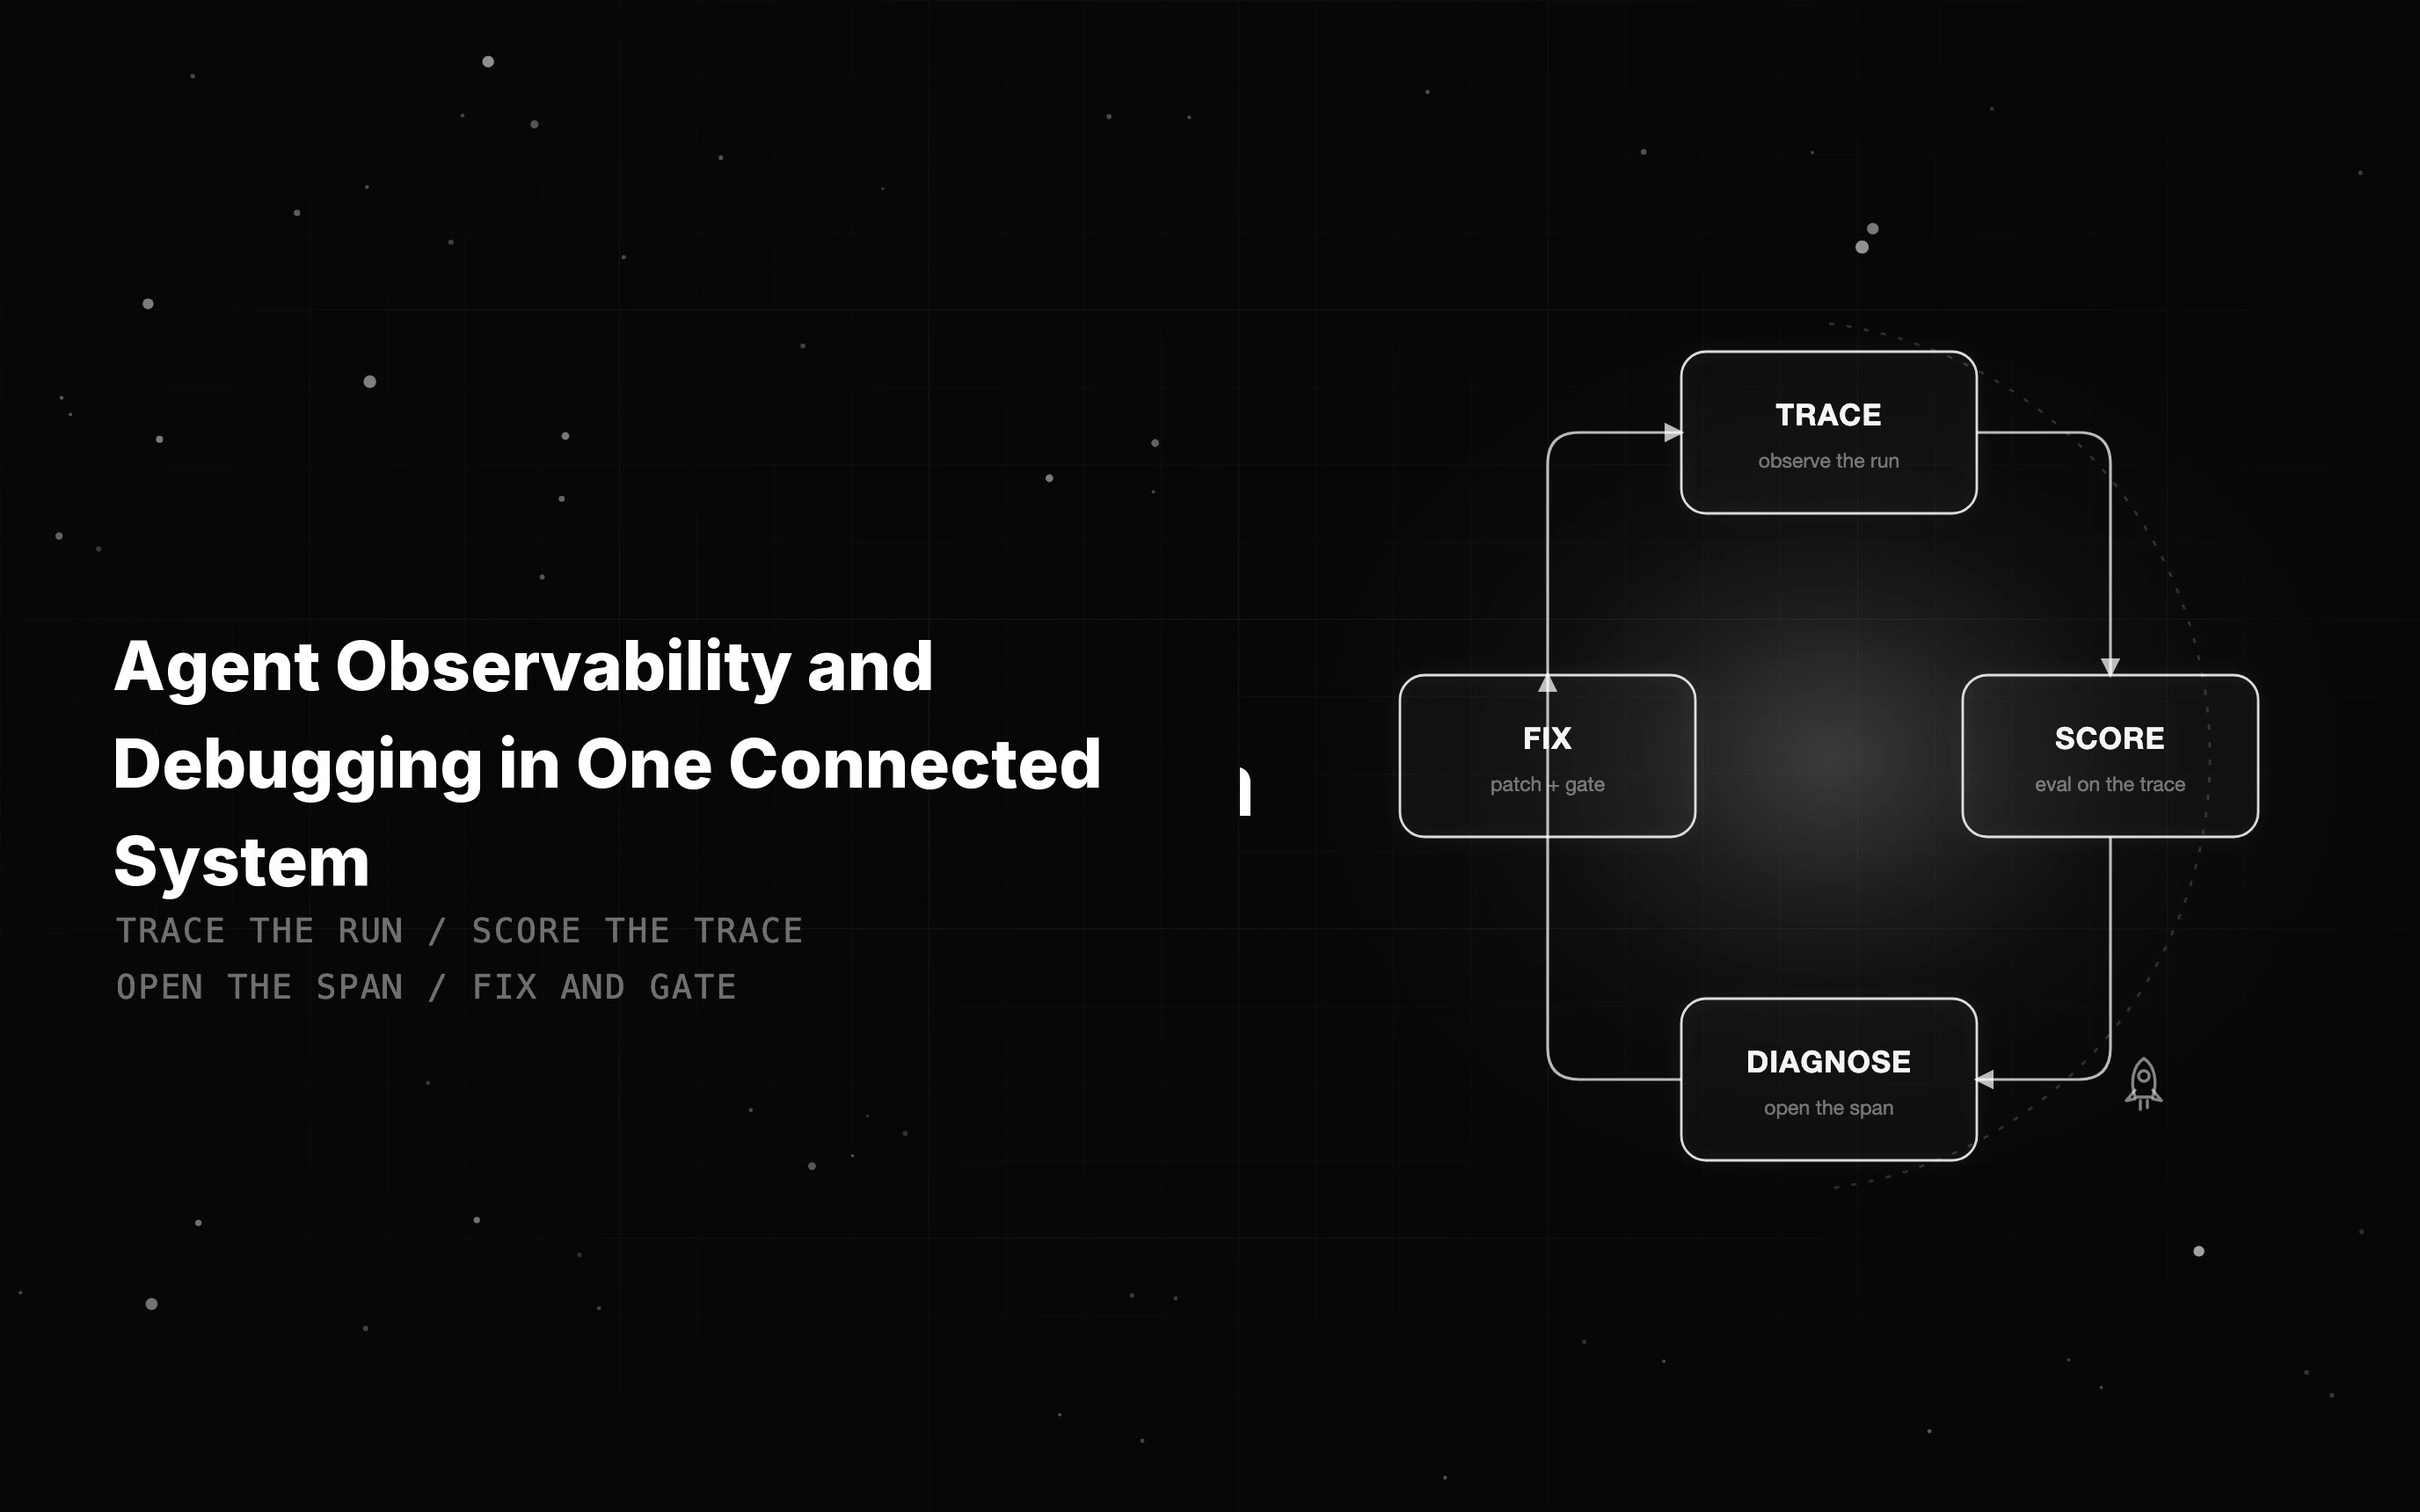
Agent observability shows what an agent did; debugging fixes it. See what to instrument and how tracing, evals, and fixes meet on one trace to close the gap.

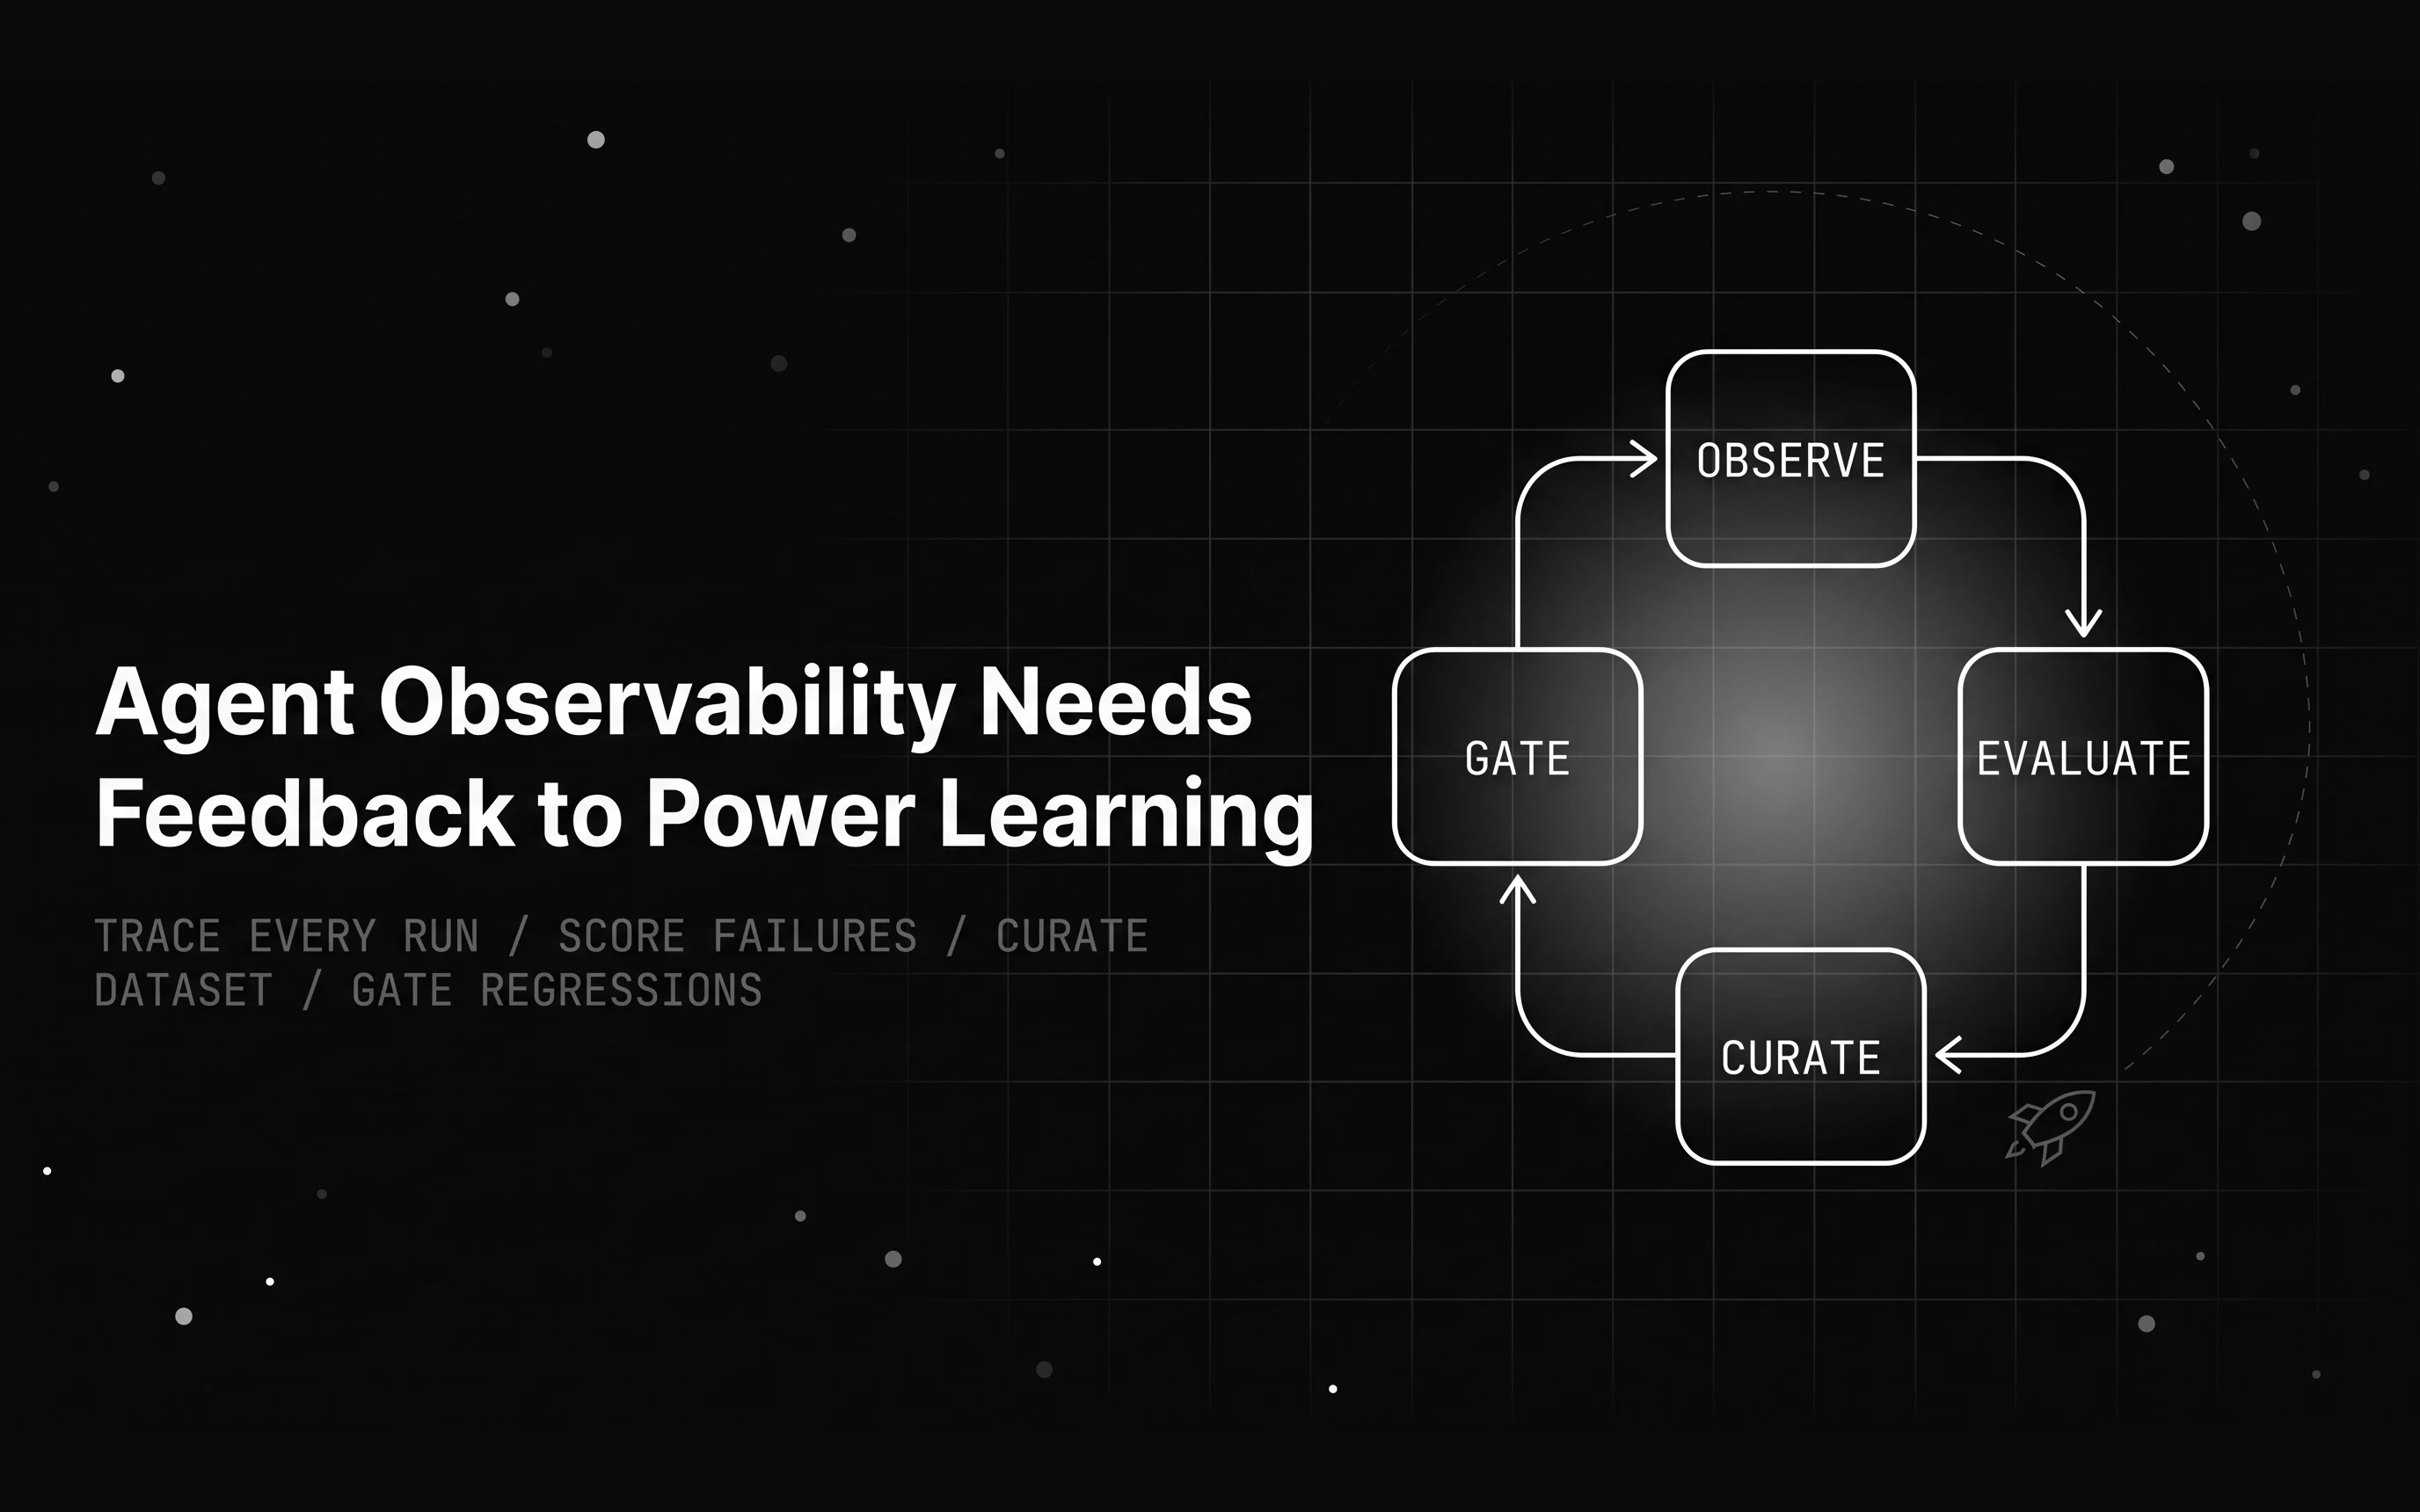
Agent observability captures what happened, but traces alone never improve an agent. Here is how to close the feedback loop from traces to agent learning.
