traceAI: OpenTelemetry-Native LLM and Agent Tracing in 2026
traceAI is the open-source OpenTelemetry-native tracing library for LLM and agent apps. Span model, 30+ integrations, OTLP transport, how to choose.

Table of Contents
traceAI is the open-source, OpenTelemetry-native tracing library for LLM and agent applications. It is Apache 2.0 licensed and built on the OpenTelemetry SDK, so it inherits standard spans, trace context, and OTLP export instead of reinventing them. What it adds is the layer a generic OTel install lacks: span kinds that understand LLM calls, retriever calls, tool calls, agent steps, and multi-step chains. The catalog ships 30+ documented integrations across Python and TypeScript. Spans export over OTLP to the FAGI Observe backend, where 70+ eval templates score them and Error Feed clusters the failures. This post covers what traceAI is, why OpenTelemetry-native tracing matters, the span model, and how to choose your tracing layer.
TL;DR
- traceAI is Future AGI’s open-source tracing library for LLM and agent apps. Apache 2.0, built on the OpenTelemetry SDK, Python and TypeScript.
- It auto-instruments five span kinds: LLM, retriever, tool, agent, and chain spans. A generic OTel install has no concept of these.
- The catalog ships 30+ documented integrations: OpenAI, Anthropic, LangChain, LlamaIndex, Groq, Bedrock, plus dedicated framework packages including
traceai-livekitandtraceAI-pipecat. - Because traceAI rides plain OpenTelemetry, spans export over OTLP and stay portable. They join your existing app traces under one trace ID and render in any OTel-compatible backend.
- Spans ship to the FAGI Observe backend, where 70+ eval templates score them, Error Feed clusters failures, and Protect adds inline guardrails.
- Pick traceAI when you want an open-source, OTel-portable tracing layer with an eval and observability platform on top, not a proprietary trace format you cannot move.
The rest of the post walks the span model, the integration surface, the decision criteria, and where traceAI fits in the wider loop.
What is traceAI?
traceAI is Future AGI’s open-source tracing library for LLM and agent applications. It is Apache 2.0 licensed, the source lives at github.com/future-agi/traceAI, and it is built directly on the OpenTelemetry SDK. That last point does most of the work: traceAI does not invent a wire format, a context-propagation scheme, or an export protocol. It inherits all three from OpenTelemetry and spends its design budget on the part OTel does not ship, a span model that understands what an AI application actually does.
A plain OpenTelemetry install knows about HTTP requests, database queries, and message queues. It has no concept of an LLM call, a retrieval step, a tool invocation, or an agent that loops. traceAI adds those span kinds and the attributes that go with them. When you register traceAI in a service, every LLM call, every retriever lookup, every tool function, and every agent step emits a structured span with the provider, the model, the latency, the token counts, and the input and output payloads attached.
The catalog ships 30+ documented integrations across Python and TypeScript. Most instrument an LLM provider or an agent framework: OpenAI, Anthropic, Google Gemini, Groq, Mistral, AWS Bedrock, Vertex, LangChain, LlamaIndex, and the long tail. Some are framework-specific, including the dedicated voice packages traceai-livekit for LiveKit Agents and traceAI-pipecat for Pipecat. Each integration is a standalone package you install with pip or npm. There is no Java or C# package; traceAI focuses on Python and TypeScript, the two languages most AI services are actually written in.
Spans export over OTLP to the FAGI Observe backend. There the eval engine runs 70+ built-in templates against the spans, Error Feed clusters the failures into named issues, and the dashboard renders each request as a trace tree. Because traceAI rides standard OpenTelemetry, the same spans also render in any OTel-compatible backend; the eval scoring and clustering are FAGI Observe features. You wire traceAI once at service startup and every request produces a span tree without you writing instrumentation code per call.
Why does OpenTelemetry-native tracing matter for LLM apps?
OpenTelemetry-native tracing matters because it keeps your trace data portable and joins your AI spans to the rest of your system. The alternative, a tracing tool with its own proprietary trace format, locks the most valuable debugging artifact you produce inside one vendor’s storage.
OpenTelemetry is the CNCF standard for distributed tracing. Almost every backend, collector, and APM tool already speaks it. When traceAI emits OpenTelemetry spans, four things follow.
- The spans are vendor-portable. A span is a span. If you change observability backends, the trace data moves with you. You are not re-instrumenting your whole application because a contract ended.
- AI spans join your existing app traces. Your service already emits HTTP and database spans under a trace ID. traceAI’s LLM and tool spans land under the same trace ID. A slow request shows the full picture: the HTTP layer, the retrieval call, the LLM call, and the tool calls, in one tree, not in two disconnected dashboards.
- OTLP is the transport. OTLP, the OpenTelemetry Protocol, is the wire format the rest of your stack uses. traceAI exports over OTLP gRPC or HTTP. There is no bespoke ingest API to learn and no extra agent to run.
- There is no proprietary lock-in on the instrumentation layer. traceAI is Apache 2.0 and built on the open SDK. You can point the exporter at a self-hosted OTel backend and never send a span to Future AGI. The instrumentation does not depend on the platform.
For a deeper treatment of running an LLM app on OpenTelemetry end to end, see LLM app observability with OpenTelemetry. The practical takeaway: a tracing layer built on the OpenTelemetry standard survives a backend change because the spans move with you, and a tracing layer built on a closed format does not.
What tracing catches that logs miss
Logs answer “did this line run.” Traces answer “what was the shape of the request.” For an LLM app that distinction decides whether you can debug at all, because the failures that hurt are the ones that do not throw.
An agent returns a confident wrong answer. Nothing errors. The logs say the request completed in 4.2 seconds with a 200. A trace shows the request as a tree: an LLM span that planned three tool calls, a tool span whose return payload is an empty array, a second LLM span that received that empty array and answered anyway. The trace makes the silent failure visible because it records the input and output of every step, not just the fact that the step ran.
This is why the span kind matters. A log line for a tool call is a timestamp and a status. A traceAI tool span is the tool name, the JSON arguments the model passed, the return payload, and the latency, all queryable. You can filter to every tool span where the return was empty across a week of traffic. You cannot do that with log grep. The trace is structured; the log is a string.
The same logic applies to cost and latency. A log tells you the request was slow. A trace tells you the retrieval span took 80 milliseconds, the first LLM span took 600, and the second LLM span took 3.4 seconds because the context had grown to 18,000 tokens. The fix is obvious from the trace and invisible from the log.
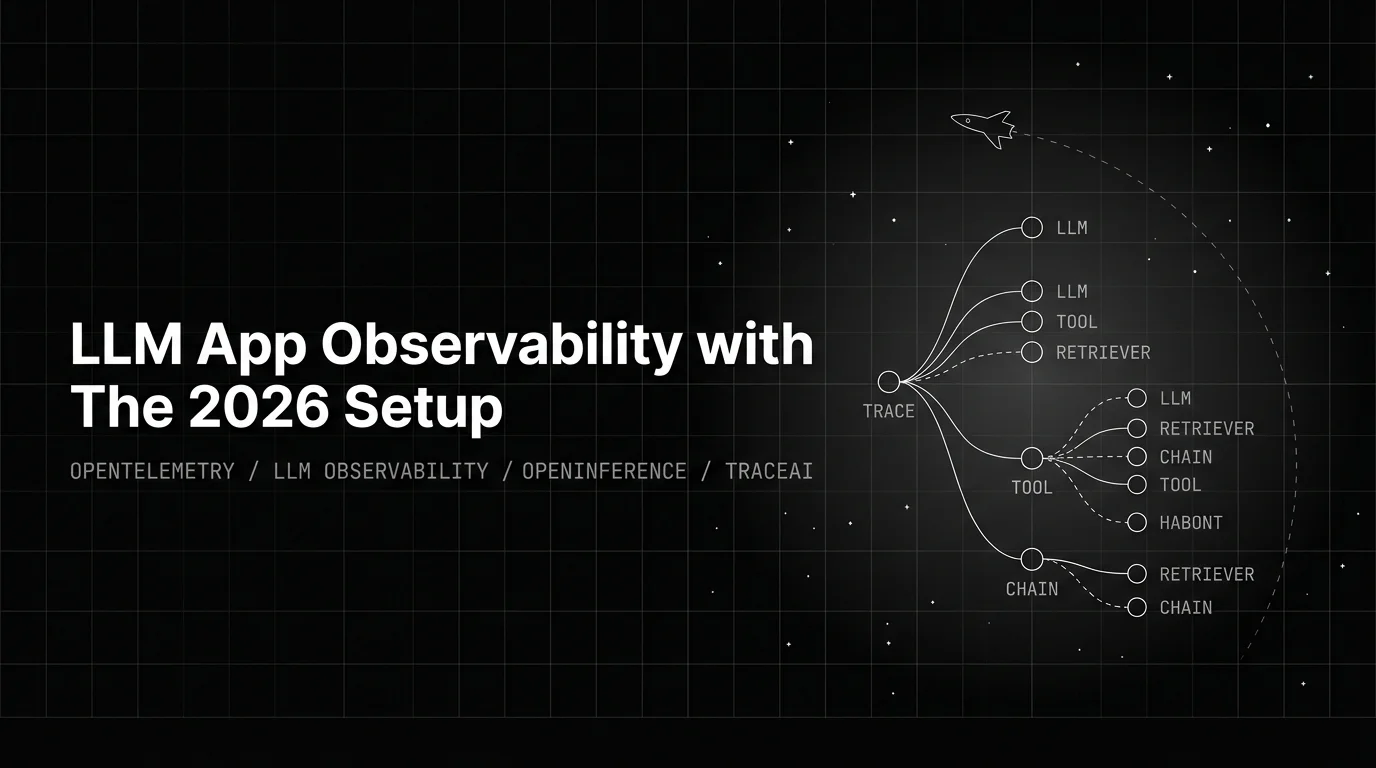
The traceAI span model
A trace is a tree of spans, and the value is in choosing span kinds that map to how an AI app actually runs. traceAI captures five.
LLM spans. One per model call. The span carries the model name, the provider, the serialized input messages, the serialized output, the prompt and completion token counts, and the invocation parameters (temperature, max tokens, the tools list). When a request is slow or expensive, the LLM span tells you which call and how much.
Retriever spans. One per retrieval step in a RAG pipeline. The span carries the query, the retrieved documents or chunks, the embedding model used for the query, and the top-k value. A RAG answer that is wrong is usually wrong because retrieval returned the wrong chunks. The retriever span is where you see that before you blame the LLM.
Tool spans. One per tool or function call the agent makes. The span carries the tool name, the JSON arguments passed, and the return payload. Silent agent failures almost always live here. The LLM did not hallucinate; a tool returned an empty string or a stale value and the model filled the gap. The tool span shows the empty return.
Agent spans. One per agent invocation. The agent span is the parent that wraps the LLM, retriever, and tool spans for a single agent’s turn. In a multi-agent system, each agent gets its own agent span, and the tree shows which agent did what.
Chain spans. One per multi-step sequence. A chain span wraps an ordered set of steps, a retrieve-then-rerank-then-generate pipeline, or a tool-using loop. Chain spans give you the per-step view that a single root span buries.
A trace tree for a single RAG-agent request reads top to bottom like this:
root span: handle_request (kind: AGENT)
  span: retrieve_context (kind: CHAIN)
    span: kb_lookup (kind: RETRIEVER, top_k: 5)
    span: rerank (kind: RETRIEVER)
  span: plan (kind: LLM, model: claude-sonnet-4-7)
    span: lookup_order (kind: TOOL)
    span: check_inventory (kind: TOOL)
  span: compose_answer (kind: LLM, model: claude-sonnet-4-7)
Every span sits under one trace ID, so the whole request is one tree. The retriever spans show what context was pulled and reranked. The LLM spans show the planning call and the final-answer call separately, with token counts on each. The tool spans show the two function calls the plan triggered. When the answer is wrong, you read the tree from the bottom: was the final LLM span ungrounded, did a tool span return junk, did the retriever pull the wrong chunks. The span kinds turn a vague “the agent is broken” into a specific failing node.
The attributes follow the OpenTelemetry GenAI semantic conventions where they exist, the gen_ai.* namespace: gen_ai.request.model, gen_ai.usage.input_tokens, gen_ai.usage.output_tokens, and the rest. Future AGI documents two extensions the vanilla conventions do not yet specify. The gen_ai.voice.* namespace carries audio-leg attributes for voice agents (STT and TTS spans), and the gen_ai.evaluation.* namespace carries eval scores that attach back onto spans after the eval engine runs. Those are the FAGI-documented keys the Observe backend renders; the core LLM, retriever, tool, agent, and chain attributes are standard OpenTelemetry.
On top of the per-kind attributes, you set cross-cutting ones when you wrap the request root: a session.id so multi-request conversations tie together, a user.id for tenant filtering, and a version tag for the prompt or build so you can compare releases. The integration sets the per-kind attributes for you; the cross-cutting ones you pass once. Skip them and you get tracing but not analytics, because there is no axis to filter or group on.
Registration is the same regardless of which span kinds your app produces:
from fi_instrumentation import register
from fi_instrumentation.fi_types import ProjectType

trace_provider = register(
    project_name="my_llm_app",
    project_type=ProjectType.OBSERVE,
    set_global_tracer_provider=True,
)
One call at service startup. After that, the integration you installed for your provider or framework emits the right span kinds automatically, and the spans inherit the OpenTelemetry context so they join under one trace per request.
The traceAI integration surface
The integration surface is the practical reason to pick one tracing library over another. A library with a span model but no integrations means you write the instrumentation by hand for every provider. traceAI ships 30+ documented integrations across Python and TypeScript, so for most stacks the instrumentation is an install and one register call.
The integrations fall into three groups.
LLM provider integrations wrap the model SDK so every call emits an LLM span without you touching the call site. Agent and orchestration framework integrations wrap the framework so chains, retrievers, tools, and agent steps emit their span kinds. Voice framework integrations wrap a voice runtime so the audio legs of a call get first-class spans.
Here is a representative slice, not the full catalog:
| Integration | Type | Span kinds emitted |
|---|---|---|
traceai-openai | LLM provider | LLM |
traceai-anthropic | LLM provider | LLM |
traceai-google-genai | LLM provider | LLM |
traceai-groq | LLM provider | LLM |
traceai-mistral | LLM provider | LLM |
traceai-bedrock | LLM provider | LLM |
traceai-langchain | Agent framework | LLM, retriever, tool, chain |
traceai-llamaindex | Agent framework | LLM, retriever, chain |
traceai-livekit | Voice framework | LLM, tool, plus audio-leg spans |
traceAI-pipecat | Voice framework | LLM, tool, plus audio-leg spans |
Two things to read off this table. First, the agent framework integrations emit more than LLM spans, because a LangChain or LlamaIndex pipeline is more than one model call; the retriever and chain spans come for free. Second, the voice packages exist because a voice agent is a multi-stage workload with audio legs, and a generic LLM integration would miss the speech-to-text and text-to-speech calls. Every package emits the same span model and the same attribute names, so a stack running OpenAI directly plus LangChain plus a voice runtime renders as one consistent trace view in the same Observe project.
If your framework is not in the catalog, you are not stuck. traceAI is built on the OpenTelemetry SDK, so you can create spans by hand with the standard API and set traceAI’s attribute names. The FAGI Observe backend renders hand-emitted spans the same as packaged ones as long as the attribute names match. For a worked example of instrumenting a RAG pipeline, see LangChain RAG observability with traceAI.
How spans get from your app to the backend
The transport is OTLP, and the lifecycle is the standard OpenTelemetry pattern. traceAI’s register() call sets up a TracerProvider, attaches a BatchSpanProcessor that buffers spans, and points an OTLP exporter at the ingest endpoint. You do not write any of that; you call register() once at startup and the wiring is done.
Two transport variants matter. OTLP gRPC is the low-overhead default. OTLP HTTP is the fallback for environments where a proxy or a compliance layer makes gRPC awkward. Pick gRPC unless something forces HTTP.
The BatchSpanProcessor is the part worth understanding even though you do not configure it by hand. It collects spans in memory and flushes them in batches instead of one network call per span. That keeps tracing overhead off the request path. Two consequences follow. First, an LLM workload emits more spans per request than a plain HTTP service, so the batching defaults are tuned for AI shapes when you use register(). Second, a service that scales down has to flush the buffer before the process exits, or the last batch of spans is lost; the provider that register() returns exposes a shutdown() for the graceful-stop hook.
If you run an OpenTelemetry Collector in front of your backend, traceAI spans flow through it like any other OTLP traffic. The collector lets you filter attributes before export, fan spans out to more than one destination, and absorb a backend outage without dropping trace data. It is optional. traceAI exports straight to the backend without one.
Moving off OpenInference-only tooling
Many teams started their AI tracing with a tool wired to a single semantic-convention spec, such as OpenInference. The practical issue shows up later, when your tracing layer speaks only one dialect and the rest of your system runs on OpenTelemetry. The spans sit in their own silo, a backend change means re-instrumenting, and the AI traces never join the HTTP and database traces under one request.
traceAI is OpenTelemetry-native. The spans follow OpenTelemetry semantic conventions and export over OTLP, which means three things stay true as your system grows.
- Spans stay portable. They render in any OTel-compatible backend. A backend change moves your trace data with you instead of stranding it.
- AI spans join the rest of the trace. Your LLM and tool spans land under the same trace ID as the HTTP, database, and queue spans your services already emit. One tree, one request, no stitching across two formats.
- The transport is standard. OTLP over gRPC or HTTP, the same wire format your collector already handles. No bespoke ingest path.
On top of the portable trace stream, the FAGI platform adds the layer that makes traces actionable. The eval engine scores the spans with 70+ templates. Error Feed clusters low-scoring spans into named failure modes with a root cause and a quick fix. Future AGI Protect adds inline guardrails across four safety dimensions: Content Moderation, Bias Detection, Security, and Data Privacy Compliance. And agent-opt closes the loop with prompt optimization. That stack runs on standard spans, so adopting it does not lock your trace format.
The decision is not “which convention is correct.” It is “do you want your most valuable debugging artifact in a portable format or a closed one.” traceAI keeps it portable. If you are weighing instrumentation libraries more broadly, the best OTel instrumentation tools for LLMs lays out the field.
How do you choose your LLM tracing layer?
You choose a tracing layer by matching span coverage, integration breadth, backend depth, and license to what your app actually needs. Here is the decision in four questions.
Does it cover the span kinds your app produces? A chat wrapper needs LLM spans. A RAG app needs retriever spans too. An agent needs tool and agent spans. A multi-step pipeline needs chain spans. A tracing layer that only models LLM calls leaves you blind on the steps that actually fail. traceAI covers all five. Check this first, because no amount of backend polish fixes a missing span kind.
Does it integrate with your frameworks? Count the providers and frameworks in your stack, then check how many the library ships an integration for. Every gap is instrumentation you write and maintain by hand. traceAI’s 30+ integrations cover the common Python and TypeScript stacks; if yours is exotic, confirm the hand-emit path works for you.
How deep is the backend? A trace tree you can look at is the floor. The useful question is what runs on top: can the backend score spans for correctness, cluster failures into named issues, attach guardrails inline, and feed an optimization loop. Tracing tells you what happened. The backend is where you find out whether it was right and what to do about it.
What is the license, and is the instrumentation independent of the platform? An Apache 2.0 instrumentation layer built on open OpenTelemetry means you can self-host, modify, and avoid a per-seat fee on the tracing itself. traceAI is Apache 2.0, and the instrumentation runs independently of the FAGI platform; point the exporter at a self-hosted OTel backend and no span leaves your infrastructure.
A short way to hold the four questions together:
| Evaluate | Weak tracing layer | What traceAI gives you |
|---|---|---|
| Span coverage | LLM spans only | LLM, retriever, tool, agent, chain |
| Integrations | A handful, or hand-rolled | 30+ across Python and TypeScript |
| Backend depth | Trace viewer only | Trace tree plus eval, Error Feed, guardrails, optimization |
| License and portability | Proprietary trace format | Apache 2.0, OpenTelemetry-native, OTLP export |
traceAI fits when you want an open-source, OpenTelemetry-portable tracing layer and an eval and observability platform on top. It is less of a fit if you want only a bare trace viewer with nothing layered on, or if your stack is Java or C# heavy, since traceAI is Python and TypeScript.
One caution worth stating plainly: the tracing layer and the backend are separable decisions, and you should treat them that way. traceAI as instrumentation is Apache 2.0 and rides standard OpenTelemetry, so adopting it does not commit you to any one backend. FAGI Observe is the backend Future AGI builds, and the eval, clustering, and guardrail features are real reasons to use it, but the spans are portable either way. Evaluate the instrumentation on span coverage and integration breadth, and evaluate the backend on what runs on top of the trace. Do not let a backend pitch sell you a closed instrumentation format. For the broader buyer’s view across observability platforms, see the LLM observability platform buyer’s guide, and for how tracing differs from evaluation as a discipline, agent observability vs evaluation vs benchmarking.
From traces to the rest of the loop
traceAI gets the spans into the FAGI Observe backend. The reason most teams adopt the pair is the loop that runs once the spans land. Three layers sit on top of the trace stream.
Evaluation scores the spans. The FAGI ai-evaluation library ships 70+ built-in eval templates, Apache 2.0. They score the spans for things like groundedness, context relevance, task completion, conversation coherence, and tone. The scores attach back onto the traceAI spans, and the gen_ai.evaluation.* namespace carries them, so a scored span is filterable in the dashboard. Tracing tells you a tool returned an empty string; evaluation tells you the final answer was ungrounded because of it.
Error Feed clusters the failures. Error Feed reads the low-scoring and failing spans and auto-clusters them into named failure modes. Each cluster comes with an auto-written root cause, the supporting evidence from the spans, a quick fix to ship today, and a long-term recommendation. It is zero-config; you do not write the clustering rules. The output turns a wall of failed traces into a short list of distinct problems.
agent-opt optimizes. Once you know the failure modes, agent-opt closes the loop. It ships six prompt optimizers: Bayesian Search, Meta-Prompt, ProTeGi, GEPA (Genetic-Pareto), Random Search, and PromptWizard. They run as a UI workflow and as a Python SDK, scored against your eval templates. Every optimization run is human-initiated and gated by an evaluator; agent-opt never auto-rewrites a production prompt without review.
The sequence is straightforward: traceAI produces the spans, evaluation scores them, Error Feed groups the failures, and agent-opt fixes them. The trace is the raw material every later step reads from.
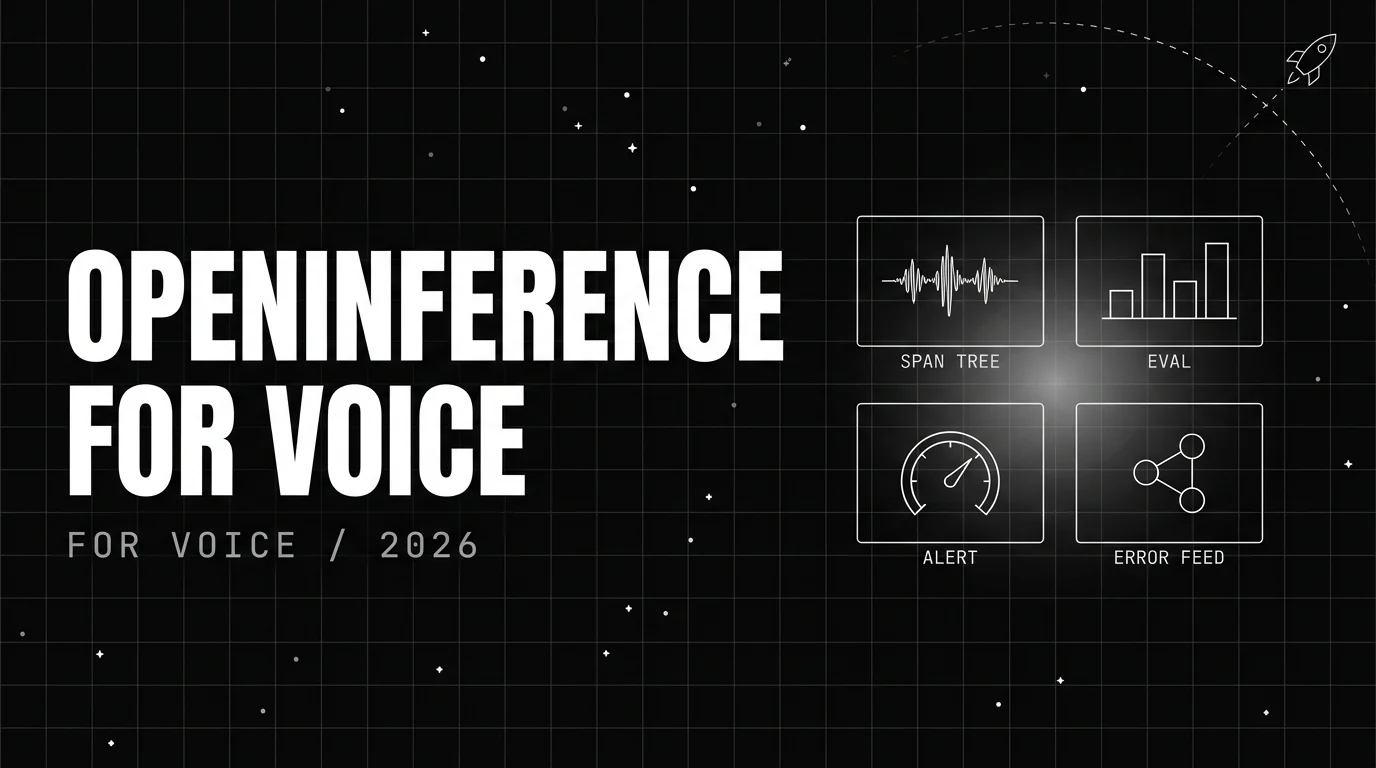
traceAI for voice specifically
Voice agents are one application of the span model among several. A voice call is a multi-stage workload with audio legs at the edges, which is why traceAI ships two dedicated voice packages, traceai-livekit for LiveKit Agents and traceAI-pipecat for Pipecat. They emit the audio-leg spans alongside the usual LLM and tool spans and carry the gen_ai.voice.* attributes, so a call renders as one trace tree like any other traceAI workload.
The setup is the same as everything above: install the framework package, call register() once, and every turn emits a span tree over OTLP to FAGI Observe. Voice has its own instrumentation depth, and that depth is a separate post rather than part of this overview. For the step-by-step voice walkthrough, see How to Trace Voice Agents with traceAI. For monitoring voice agents in production once they are traced, see how to monitor AI voice agents in production.
Related reading
- How to Trace Voice Agents with traceAI: STT, LLM, TTS, and Tool Spans
- LLM app observability with OpenTelemetry in 2026
- Best OTel instrumentation tools for LLMs in 2026
- Agent observability vs evaluation vs benchmarking in 2026
- Multi-modal LLM tracing in 2026
- LangChain RAG observability with traceAI
Sources
- traceAI on GitHub: github.com/future-agi/traceAI
- ai-evaluation on GitHub: github.com/future-agi/ai-evaluation
- Observe and Error Feed docs: docs.futureagi.com/docs/observe
- Evaluation docs: docs.futureagi.com/docs/evaluation
- Future AGI Protect docs: docs.futureagi.com/docs/protect
- agent-opt optimization docs: docs.futureagi.com/docs/optimization
- OpenTelemetry: opentelemetry.io
- OTLP spec: github.com/open-telemetry/opentelemetry-proto
- OpenTelemetry GenAI semantic conventions: opentelemetry.io/docs/specs/semconv/gen-ai
Frequently asked questions
What is traceAI?
Does traceAI work with my existing OpenTelemetry setup?
Which frameworks does traceAI integrate with?
Looking for an OpenInference alternative?
Python or TypeScript: which traceAI SDK should I use?
What backend does traceAI ship spans to?
How does tracing connect to evaluation?
Is traceAI really open source?

2026 buyer guide for LLM observability platforms: 10 criteria, 7 vendor categories, the 5-question vendor interview, an honest and calibrated ranking.

OTel for LLM apps in 2026 = OTel-GenAI + OpenInference + eval-as-span-attribute. Three layers, traceAI register pattern, span enrichment, sampling.

Trace voice agents with traceAI in 2026: STT/LLM/TTS/tool spans, OTLP transport, the FAGI Observe backend, code for LiveKit and Pipecat.
