LLM Latency Tail Evaluation: p99 Methodology for 2026
P50 lies, p99 tells truth. The 2026 method for measuring throttling, retries, and cache misses per component with traceAI and ACC.
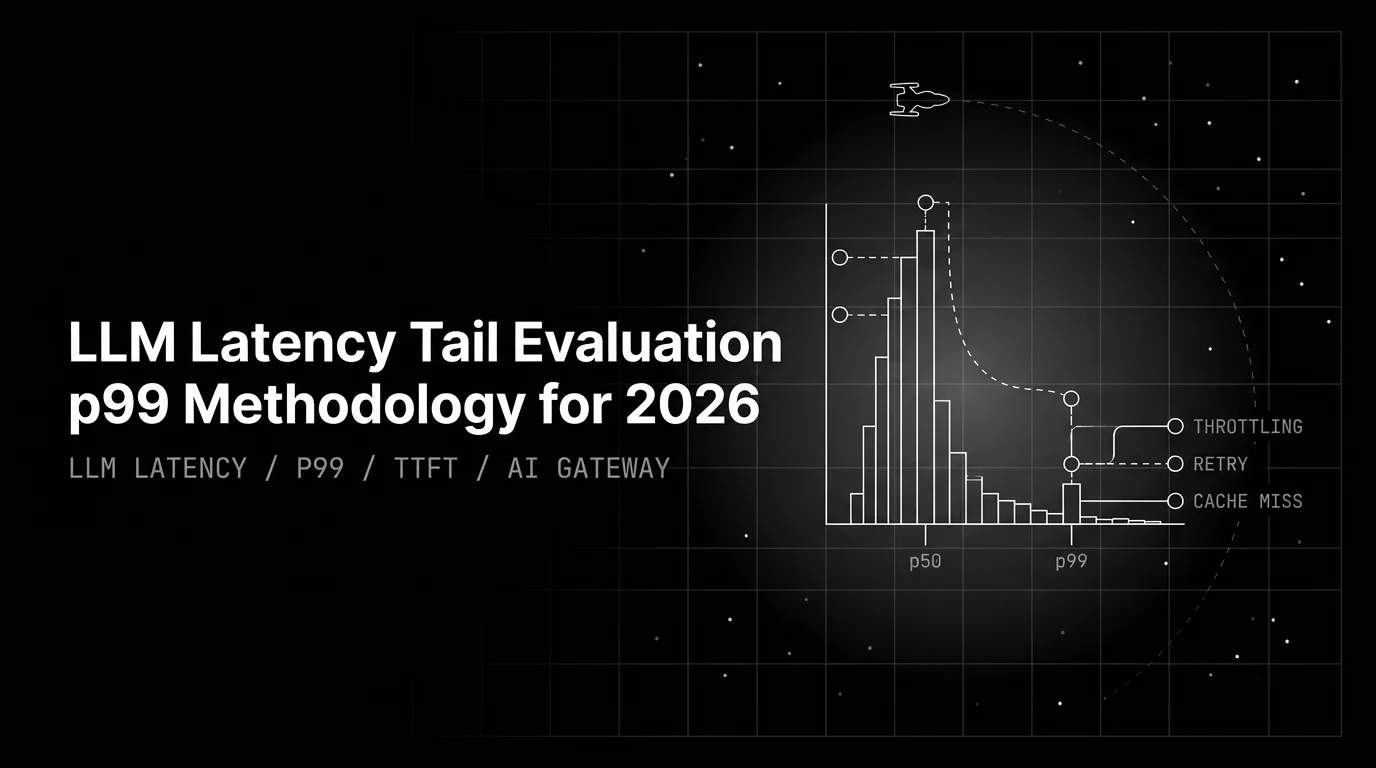
Table of Contents
Originally published May 19, 2026. Updated May 20, 2026.
P50 is a lie; p99 is the truth. The median is the dashboard number that lets a tail problem survive a launch review. The tail is what your users actually experience, and in 2026 the LLM tail comes from three sources: provider throttling, retry storms, and cache misses. Measure all three independently with per-component decomposition and you fix the right stage. Measure them in aggregate and you chase ghosts.
This post is the working methodology: per-component p50/p99 across ASR, LLM, TTS, tool, and network; retry-attempt distribution per route; cache-hit correlation against latency; and the FAGI surfaces (traceAI, Agent Command Center, Error Feed) that wire it into a span tree your team already has.
TL;DR
Three measurements on the same trace. Per-component p50/p99 across ASR, LLM, TTS, tool, and network, so the tail attributes to a stage. Retry-attempt distribution per route, because three transparent retries at 2 seconds each is a 6-second user wait the per-call latency hides. Cache-hit correlation against the latency distribution, because a bimodal cached-vs-cold split makes the tail look like noise. traceAI ships the span attributes; Agent Command Center exports x-prism-retry-count, x-prism-cache-hit, and x-prism-latency-ms so tail rows attribute to one of the three sources. Error Feed clusters the rest.
Why p50 hides the tail
Classical web services treat the median as a reasonable proxy for user experience. A REST endpoint at 80 ms median with a 400 ms p99 is fine; the 99th percentile rounds off into a slightly slower page load. LLM apps don’t have that property. The tail is multi-second, and the user notices.
The shape per surface:
- Voice agents. Sub-500 ms is the conversation target. Past 1 second the user assumes the agent broke and starts talking over it.
- Coding agents. Users tolerate a 2-5 second median. They abandon at 15 seconds. The tail is the cancel button.
- Support chat. A streaming UI hides total duration as long as TTFT stays under 1 second, but a streaming-aware tail (see our streaming evaluation guide) still kills the session when inter-token jitter spikes.
- RAG knowledge bases. Long contexts make latency a function of token count; p99 tracks the long-document user, not the average user.
P50 averages all of these into one green line. The 400 ms median is real. The 2.4 second p99 is also real, and it is what one in a hundred users sees. On a million calls a day, p99 is ten thousand sessions. That’s a churn cohort, not a rounding error. The dashboard headline is p99 per route, with median demoted to a sanity check.
The three tail sources
Most teams treat LLM latency as one number and try to optimize it with one lever. The tail doesn’t work that way. Three independent sources produce three different distributions, each with a different fix.
Source 1: Provider throttling. Vendors run shared inference tiers, and shared tiers have congestion windows. The signature is a near-vertical p99 cliff in a specific time slice: p99 sits at 1.8 seconds for the day, jumps to 11 seconds between 14:00 and 16:00 EST. The call isn’t slow; the request is queued behind other tenants. Fix: failover to a secondary provider, enable race mode, or move to a dedicated tier.
Source 2: Retry storms. Most provider SDKs retry transparently on 429 or 5xx with exponential backoff. A first call at 2 seconds, a second at 2 seconds, a third at 4 seconds is an 8-second user wait, but if you log only the successful response duration you see “2 seconds” and the cause is invisible. Retry storms compound: a small rate-limit incident causes every caller to retry, retry load triggers more throttling, the tail goes vertical. Fix: instrument attempt count, cap retries explicitly, route around the throttled provider.
Source 3: Cache misses. Semantic or prefix caching moves most calls onto a fast path. Hit latency might be 40 ms; miss latency 1.8 seconds. Aggregate p50 is fast because hits dominate; aggregate p99 is the miss distribution. The dashboard reports a 200 ms median and a 1.6 second p99, which looks like a moderate tail. It’s two distributions glued together. Fix: correlate hit-versus-miss with latency, address the cold path separately, stop optimizing a bimodal aggregate.
Each source is independent. A retry-storm tail can exist without throttling; a cache-miss tail without retries. The methodology has to attribute every tail event to one of the three or you spend the optimization budget on the wrong lever.
Per-component decomposition: ASR, LLM, TTS, tool, network
A voice agent at 1.2 second p99 isn’t a “voice agent” problem; it’s a stage problem. The components stack and one of them owns the tail. Same logic for a RAG pipeline (retrieval, rerank, LLM, post-process), an agent loop (planner, tool call, observer, LLM), or any composite system.
traceAI auto-instrumentation tags each span with a component name and standard latency attributes. A typical voice agent span tree:
voice_turn.total_duration_ms = 1180
  ├─ asr.duration_ms = 120
  ├─ llm.duration_ms = 680
  │   ├─ llm.ttft_ms = 240
  │   ├─ llm.inter_token_ms_p99 = 38
  │   └─ llm.total_duration_ms = 680
  ├─ tool.duration_ms = 80
  ├─ tts.duration_ms = 240
  └─ network.duration_ms = 60
Roll per-component duration to p50 and p99 per route and the binding constraint becomes obvious. Above, the LLM stage owns 58 percent of total duration and almost certainly owns the tail. ASR and TTS are noise. The optimization budget goes to the LLM stage; the others don’t move regardless of effort.
The setup in Python:
from fi_instrumentation import register
from fi_instrumentation.fi_types import ProjectType
from traceai_openai import OpenAIInstrumentor

trace_provider = register(
    project_type=ProjectType.OBSERVE,
    project_name="latency-tail-eval",
)
OpenAIInstrumentor().instrument(tracer_provider=trace_provider)

# ASR, TTS, tool, and custom orchestration spans use the standard
# OTel API; component name lives in the span attributes so the
# aggregator can roll per-stage percentiles.
traceAI covers OpenAI, Anthropic, Bedrock, Vertex, the agent frameworks (LangChain, LangGraph, LlamaIndex, CrewAI, Agno, AutoGen, Pydantic AI, Smolagents, Strands, Mastra, OpenAI Agents SDK), and the voice stack (Deepgram, ElevenLabs, Whisper). Same span shape across TypeScript, Java (Spring Boot starter, Spring AI, LangChain4j, Semantic Kernel), and C#. For deeper patterns, see instrument your AI agent with traceAI. What ships is per-route, per-component, per-percentile, per-region; “p99 of the voice turn” is a query, not a pipeline.
Retry-attempt distribution: the metric most teams miss
The most common tail source in production audits is retries nobody knows about. Provider SDKs retry on 429 and 5xx by default. A chat.completions.create that retried twice still returns successfully, and your application timer might or might not include the retry wall time depending on where you placed it. The span tree, if instrumented correctly, contains the truth.
Capture the retry attempt count as a span attribute on every LLM call, then aggregate the distribution per route. A healthy route:
route: /voice/turn
  first-attempt success:    96.4%
  second-attempt success:    2.8%
  third-attempt success:     0.6%
  exhausted retries:         0.2%
A retry-storm route during an incident:
route: /voice/turn (during incident window)
  first-attempt success:    71.2%
  second-attempt success:   18.4%
  third-attempt success:     7.8%
  exhausted retries:         2.6%
Aggregated p99 in the window is twice the baseline. First-attempt latency is unchanged. The cause is retries, not slow inference, and the fix is failover or rate-limit headroom, not a faster model. Without the attempt-count distribution you cannot tell those stories apart.
Agent Command Center exports the retry count as x-prism-retry-count on every response header. The eval surface reads it like x-prism-latency-ms:
# Per-call span attributes after the gateway hop:
#   gateway.retry_count = 2
#   gateway.attempt_durations_ms = [2010, 2150, 1920]
#   gateway.fallback_used = false
#   gateway.routing_strategy = "single"
Pair the per-call retry count with the wall-clock total. Routes where wall-clock p99 sits well above per-attempt p99 are retry-bound. Gate on the percentage past attempt 1; +2 points week over week fails the build. Anything past attempt 3 hard-fails the call.
Cache-hit correlation: the bimodality fix
The third tail source is the bimodal distribution most caches produce. Prefix and semantic caching both move large fractions of traffic onto fast paths, which is the point; they leave the cold path slower than the average user expects. Aggregate p50 looks fast, aggregate p99 looks bad, and a well-meaning engineer reads that and tries to optimize the fast path, which doesn’t move p99 because the fast path is already fast.
The methodology: correlate the cache-hit flag with the latency distribution per call. The shape:
| Bucket | Volume | p50 | p99 |
|---|---|---|---|
| Cache hit | 78% | 38 ms | 110 ms |
| Cache miss | 22% | 1820 ms | 4900 ms |
| Aggregate | 100% | 220 ms | 4100 ms |
The aggregate is the dashboard story; the per-bucket split is the actionable story. Cold-path p99 is the real number for any user whose request is unique. Fixes split cleanly: warmer keys, longer TTL, broader semantic match, or a faster cold-path model. None of those help the hit bucket, which is already fast.
Agent Command Center exports x-prism-cache-hit and x-prism-cache-strategy (prefix, semantic, exact) on every response, and traceAI writes the same attributes onto the LLM span. Reading the correlation is a query on the span tree:
# Pseudo-query against the span attributes:
#   p99(llm.total_duration_ms | gateway.cache_hit = true)
#   p99(llm.total_duration_ms | gateway.cache_hit = false)
# Plot both per route; the gap is the cold-path tax.
For the cost side of the same instrumentation, see our AI agent cost optimization and observability guide; latency and cost share the cache surface.
Agent Command Center: span-attached cost and latency headers
The gateway is where attribution becomes mechanical. traceAI tells you the call was slow; the gateway tells you why. Agent Command Center is the OpenAI-compatible network hop in front of the model, and it exports normalized response headers the eval suite reads as span attributes:
x-prism-latency-ms: canonical normalized latency across providers, so a 1.8 s Anthropic call compares directly with a 1.8 s OpenAI call.x-prism-retry-count: gateway retries before success; the retry-distribution metric reads here.x-prism-cache-hitandx-prism-cache-strategy: hit flag and cache type.x-prism-model-used: the actual model served, not always the configured one once fallback engages.x-prism-fallback-used: most common explanation for an unexpected tail spike.x-prism-routing-strategy: single, shadow, mirror, race, weighted. The lever for shifting the tail.x-prism-cost: paired with latency for the cost-versus-tail trade.x-prism-guardrail-triggered: flags when a guardrail added latency.
A real tail row from a production dashboard:
ts          route    p99_ms  retry  cache  fallback  strategy  cause
14:32:10    /chat    8420    0      false  true      race      throttle+fallback
14:33:02    /chat    11200   2      false  false     single    retry storm
14:34:15    /chat    4900    0      false  false     single    cache miss cold path
14:35:48    /chat    2150    0      true   false     race      healthy
The cause column writes itself once the attributes are on the span. Row 1 is a throttle that triggered race-mode fallback. Row 2 is a retry storm. Row 3 is a cold-path cache miss. Row 4 is the healthy baseline. Each row maps to one of the three tail sources, which means each row maps to a different fix.
The gateway is Apache 2.0, self-hostable as a single Go binary, or hosted at gateway.futureagi.com/v1 as an OpenAI SDK drop-in. Benchmarked at ~29k req/s, P99 21 ms with guardrails on, on t3.xlarge. SOC 2 Type II, HIPAA, GDPR, CCPA per the trust page; ISO 27001 in active audit. For routing details see our LLM routing primer and the failover and fallback guide.
Clustering tail events with Error Feed
Once the attribution lands on the span, the volume of tail events is the next problem. Reading 11-second traces by hand doesn’t scale.
Error Feed sits inside the eval stack. HDBSCAN soft-clustering groups tail traces by embedding similarity over the span attributes; a Sonnet 4.5 Judge with a 30-turn budget writes an immediate_fix paragraph per cluster. The clusters that show up most:
- “Anthropic p99 spike on US-East 14:00-16:00 EST.” Throttling window.
immediate_fix: shift to a secondary provider or enable race mode on the affected route. - “Retry-attempt distribution skews to attempt 3 on
/agent/plan.” Retry storm.immediate_fix: cap retries, switch provider, or move to a dedicated tier. - “Cold-path cache miss adds 1.6 s p99 on long-tail queries.” Cold-path miss.
immediate_fix: extend semantic match radius, warm keys nightly, or route cold-path calls to a faster model. - “Fallback to Bedrock adds 800 ms cold start.” Fallback warm-up tax.
immediate_fix: pre-warm or pick a fallback without the cold-start tax.
Each cluster is a named issue with a per-cluster fix. The Judge’s immediate_fix is what the on-call engineer reads, not a raw trace dump, and the clusters feed the platform’s self-improving evaluators so the rubrics that flag the tail get sharper over time.
Honest framing on integrations: Linear OAuth ships today; Slack, GitHub, Jira, and PagerDuty are roadmap. The trace-to-optimizer connector that would turn a cluster into an agent-opt run automatically is in progress; today the engineer reads the immediate_fix and points one of the six optimizers (RandomSearch, BayesianSearch with teacher-inferred few-shot and resumable Optuna, MetaPrompt, ProTeGi, GEPA, PromptWizard) at the prompt manually. For the broader observability frame, see our best agent observability tools round-up and the Datadog alternatives comparison.
Scoring quality alongside latency
Latency alone isn’t the gate; latency at acceptable quality is. A 200 ms wrong answer is worse than a 1.5 s right one. The same EvalTemplate classes you run in CI run alongside the latency profile:
from fi.evals import Evaluator
from fi.evals.templates import (
    Groundedness, TaskCompletion, ContextAdherence, Completeness,
)
from fi.testcases import TestCase

evaluator = Evaluator(fi_api_key="...", fi_secret_key="...")
results = evaluator.evaluate(
    eval_templates=[Groundedness(), TaskCompletion(), ContextAdherence(), Completeness()],
    inputs=[TestCase(query=q, response=r, context=ctx) for q, r, ctx in batch],
)
For latency-specific judges, CustomLLMJudge defines them in natural language: LatencyBudgetAdherence (did the response complete within the route’s SLA tier), RetryAttemptCoherence (did quality match the retried-attempt expectation), and CacheMissAcceptability (did a cold-path call stay within the looser cold-path budget). Output is a joint quality-versus-latency score per call. For the rubric story, see our LLM evaluation playbook and the agent evaluation frameworks overview.
A 5-step setup
A team starting from zero can run tail attribution in a week.
Step 1: instrument with traceAI plus gateway headers. Drop in the per-framework instrumentor. Forward x-prism-latency-ms, x-prism-retry-count, x-prism-cache-hit, x-prism-fallback-used, and x-prism-routing-strategy onto the LLM span.
Step 2: build a load profile that exercises the three sources. Sustained baseline at typical RPS for 30 minutes. Burst patterns at 3-5x peak (provoke throttling). Long-tail unique queries (force misses). Distribute via Ray Serve, Celery, Temporal, or Kubernetes runners from the ai-evaluation SDK.
Step 3: decompose per component and per source. Roll p50 and p99 per stage (ASR, LLM, TTS, tool, network) and per source (throttling, retries, cache). The binding tail is usually one stage and one source.
Step 4: gate quality alongside latency. Run the EvalTemplate set plus the CustomLLMJudge latency rubrics in the same pass.
Step 5: cluster with Error Feed and apply the immediate_fix. Match each cluster to a routing strategy, retry policy, or cache config. Re-run the profile and confirm p99 moves.
For tooling context, see our LLM load-testing tools review.
Anti-patterns to avoid
Headlining p50. Median is a sanity check, not a gate. The headline is per-route p99. Build the dashboard accordingly or you’ll keep shipping tail regressions that look green.
Aggregating across components. A “voice turn p99” rolls ASR, LLM, TTS, tool, and network into one number that’s useless for action. Decompose first, aggregate second.
Letting the SDK retry silently. Default retry behavior with no attempt-count attribute means retry storms are invisible. Cap retries, log attempt count, gate the route on the distribution.
Treating the cache as a single bucket. Hit and miss are different distributions glued together. Correlate the flag with latency or optimize the wrong path.
Reading the tail row by row. A 100 RPS service produces enough tail events per day that hand-review doesn’t scale. Cluster with Error Feed; read named issues.
Closing thought
Tail evaluation in 2026 is per-component p50/p99, plus retry-attempt distribution, plus cache-hit correlation, on the same trace tree. P50 is a lie; p99 is the truth. The three tail sources (throttling, retries, cache misses) need independent measurement because they need independent fixes. traceAI ships the span attributes; Agent Command Center adds the per-call headers; Error Feed clusters the rest. The p99 is the product. Treat it that way.
Related reading
- LLM Evaluation Playbook 2026
- Evaluating Streaming LLM Responses in 2026
- AI Agent Cost Optimization and Observability
- Best AI Gateways for LLM Failover and Fallback
- Best LLM Load Testing Tools 2026
- Self-Improving AI Agent Pipeline
Sources and references
- OpenTelemetry GenAI semantic conventions (
gen_ai.server.time_to_first_token,gen_ai.server.time_per_output_token) - Future AGI trust and compliance: futureagi.com/trust
- Agent Command Center docs: docs.futureagi.com/docs/command-center
- traceAI repository: github.com/future-agi/traceAI
- ai-evaluation repository: github.com/future-agi/ai-evaluation
Frequently asked questions
Why is p50 misleading for LLM latency and p99 the real metric?
What are the three sources of LLM latency tail?
How do you decompose latency per component in a voice or RAG pipeline?
How does retry-attempt distribution catch hidden tail problems?
What does cache-hit correlation reveal about tail latency?
How does Future AGI attribute tail events to throttling, retries, or misses?
What anti-patterns hide LLM latency tail in production?

Streaming LLM evaluation is four metrics, not one. TTFT, inter-token p99, mid-stream consistency, premature termination. The honest 2026 playbook.

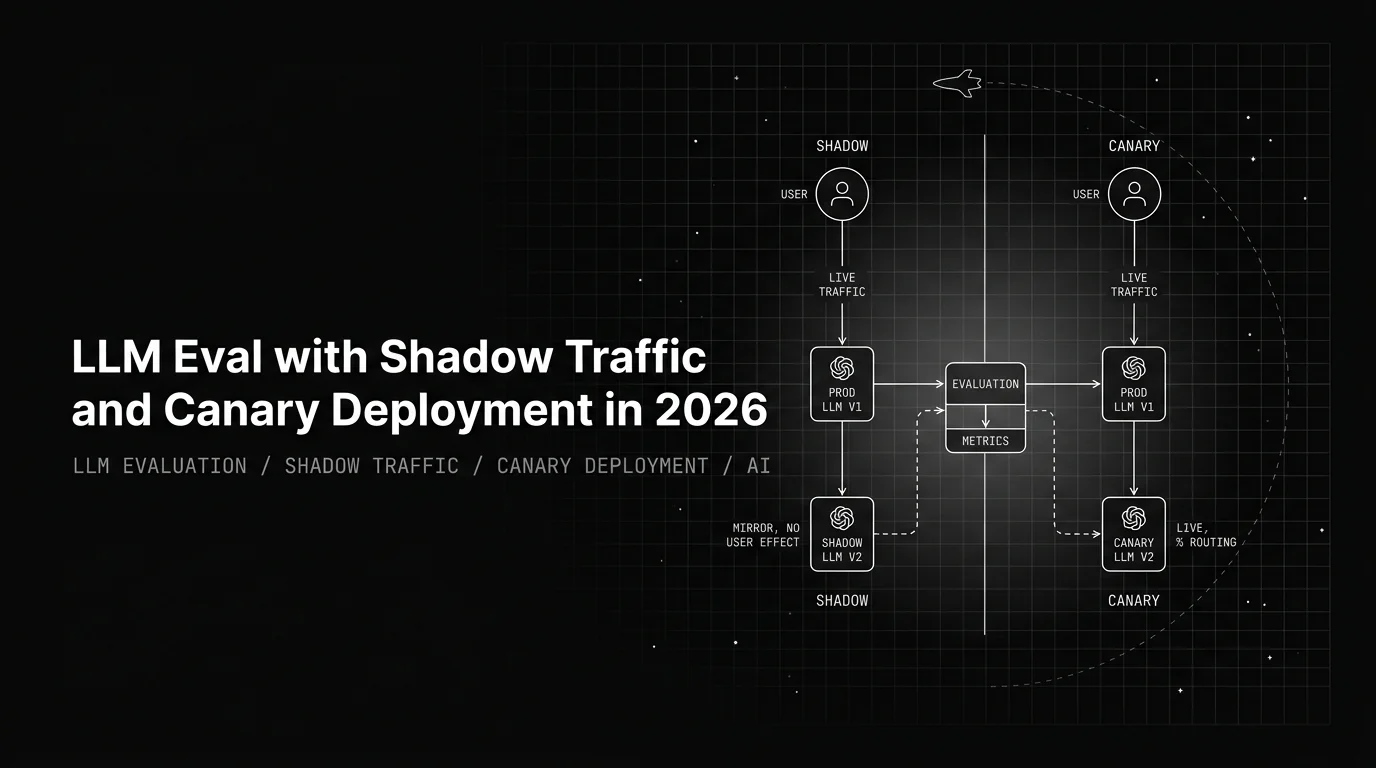
Shadow is not canary. Mirror routing with no user effect vs percentage routing with rollback. Score-attached traffic, ACC patterns, gotchas.

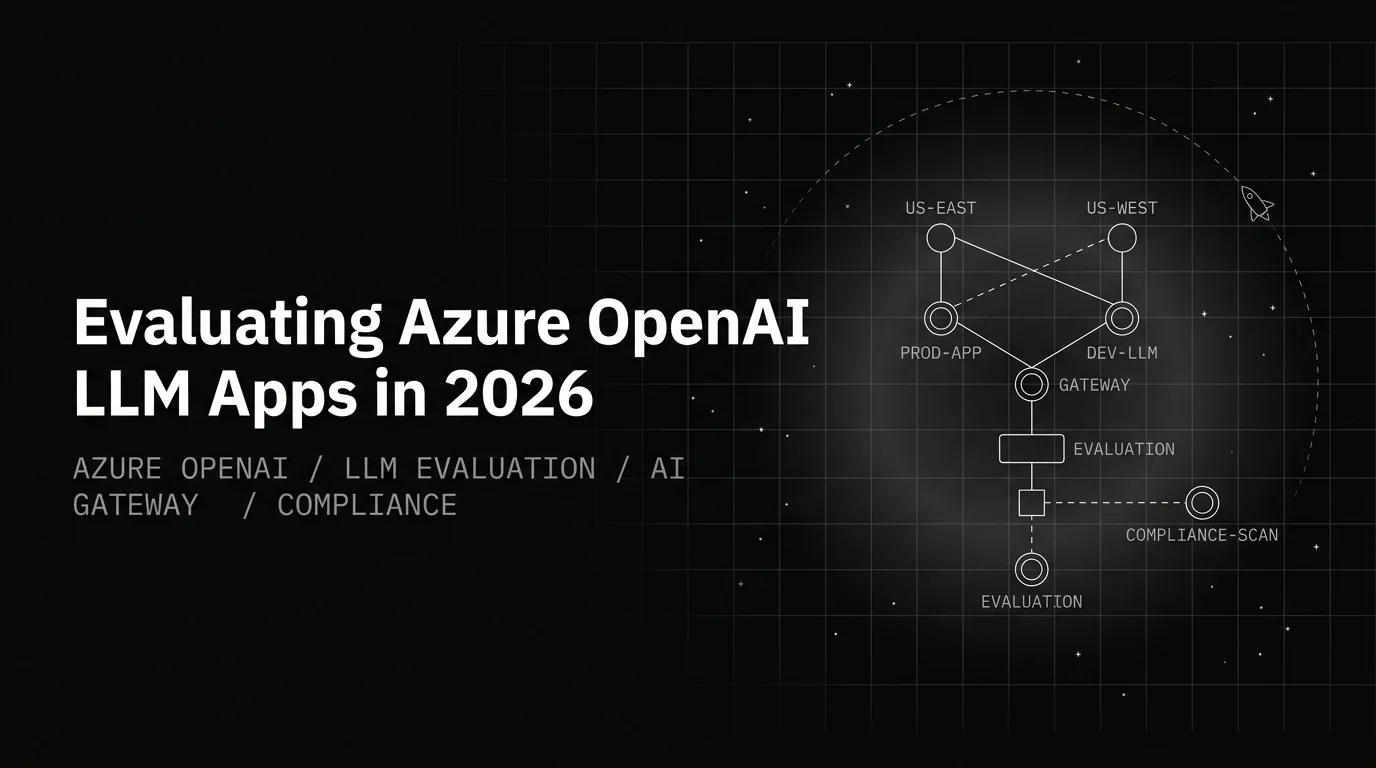
Azure OpenAI eval has three Azure-specific axes: deployment-name drift, region-pinning, and Content Safety precision on benign queries. Here's the pattern.