Agent Observability and Debugging in One Connected System
Agent observability shows what an agent did; debugging fixes it. See what to instrument and how tracing, evals, and fixes meet on one trace to close the gap.
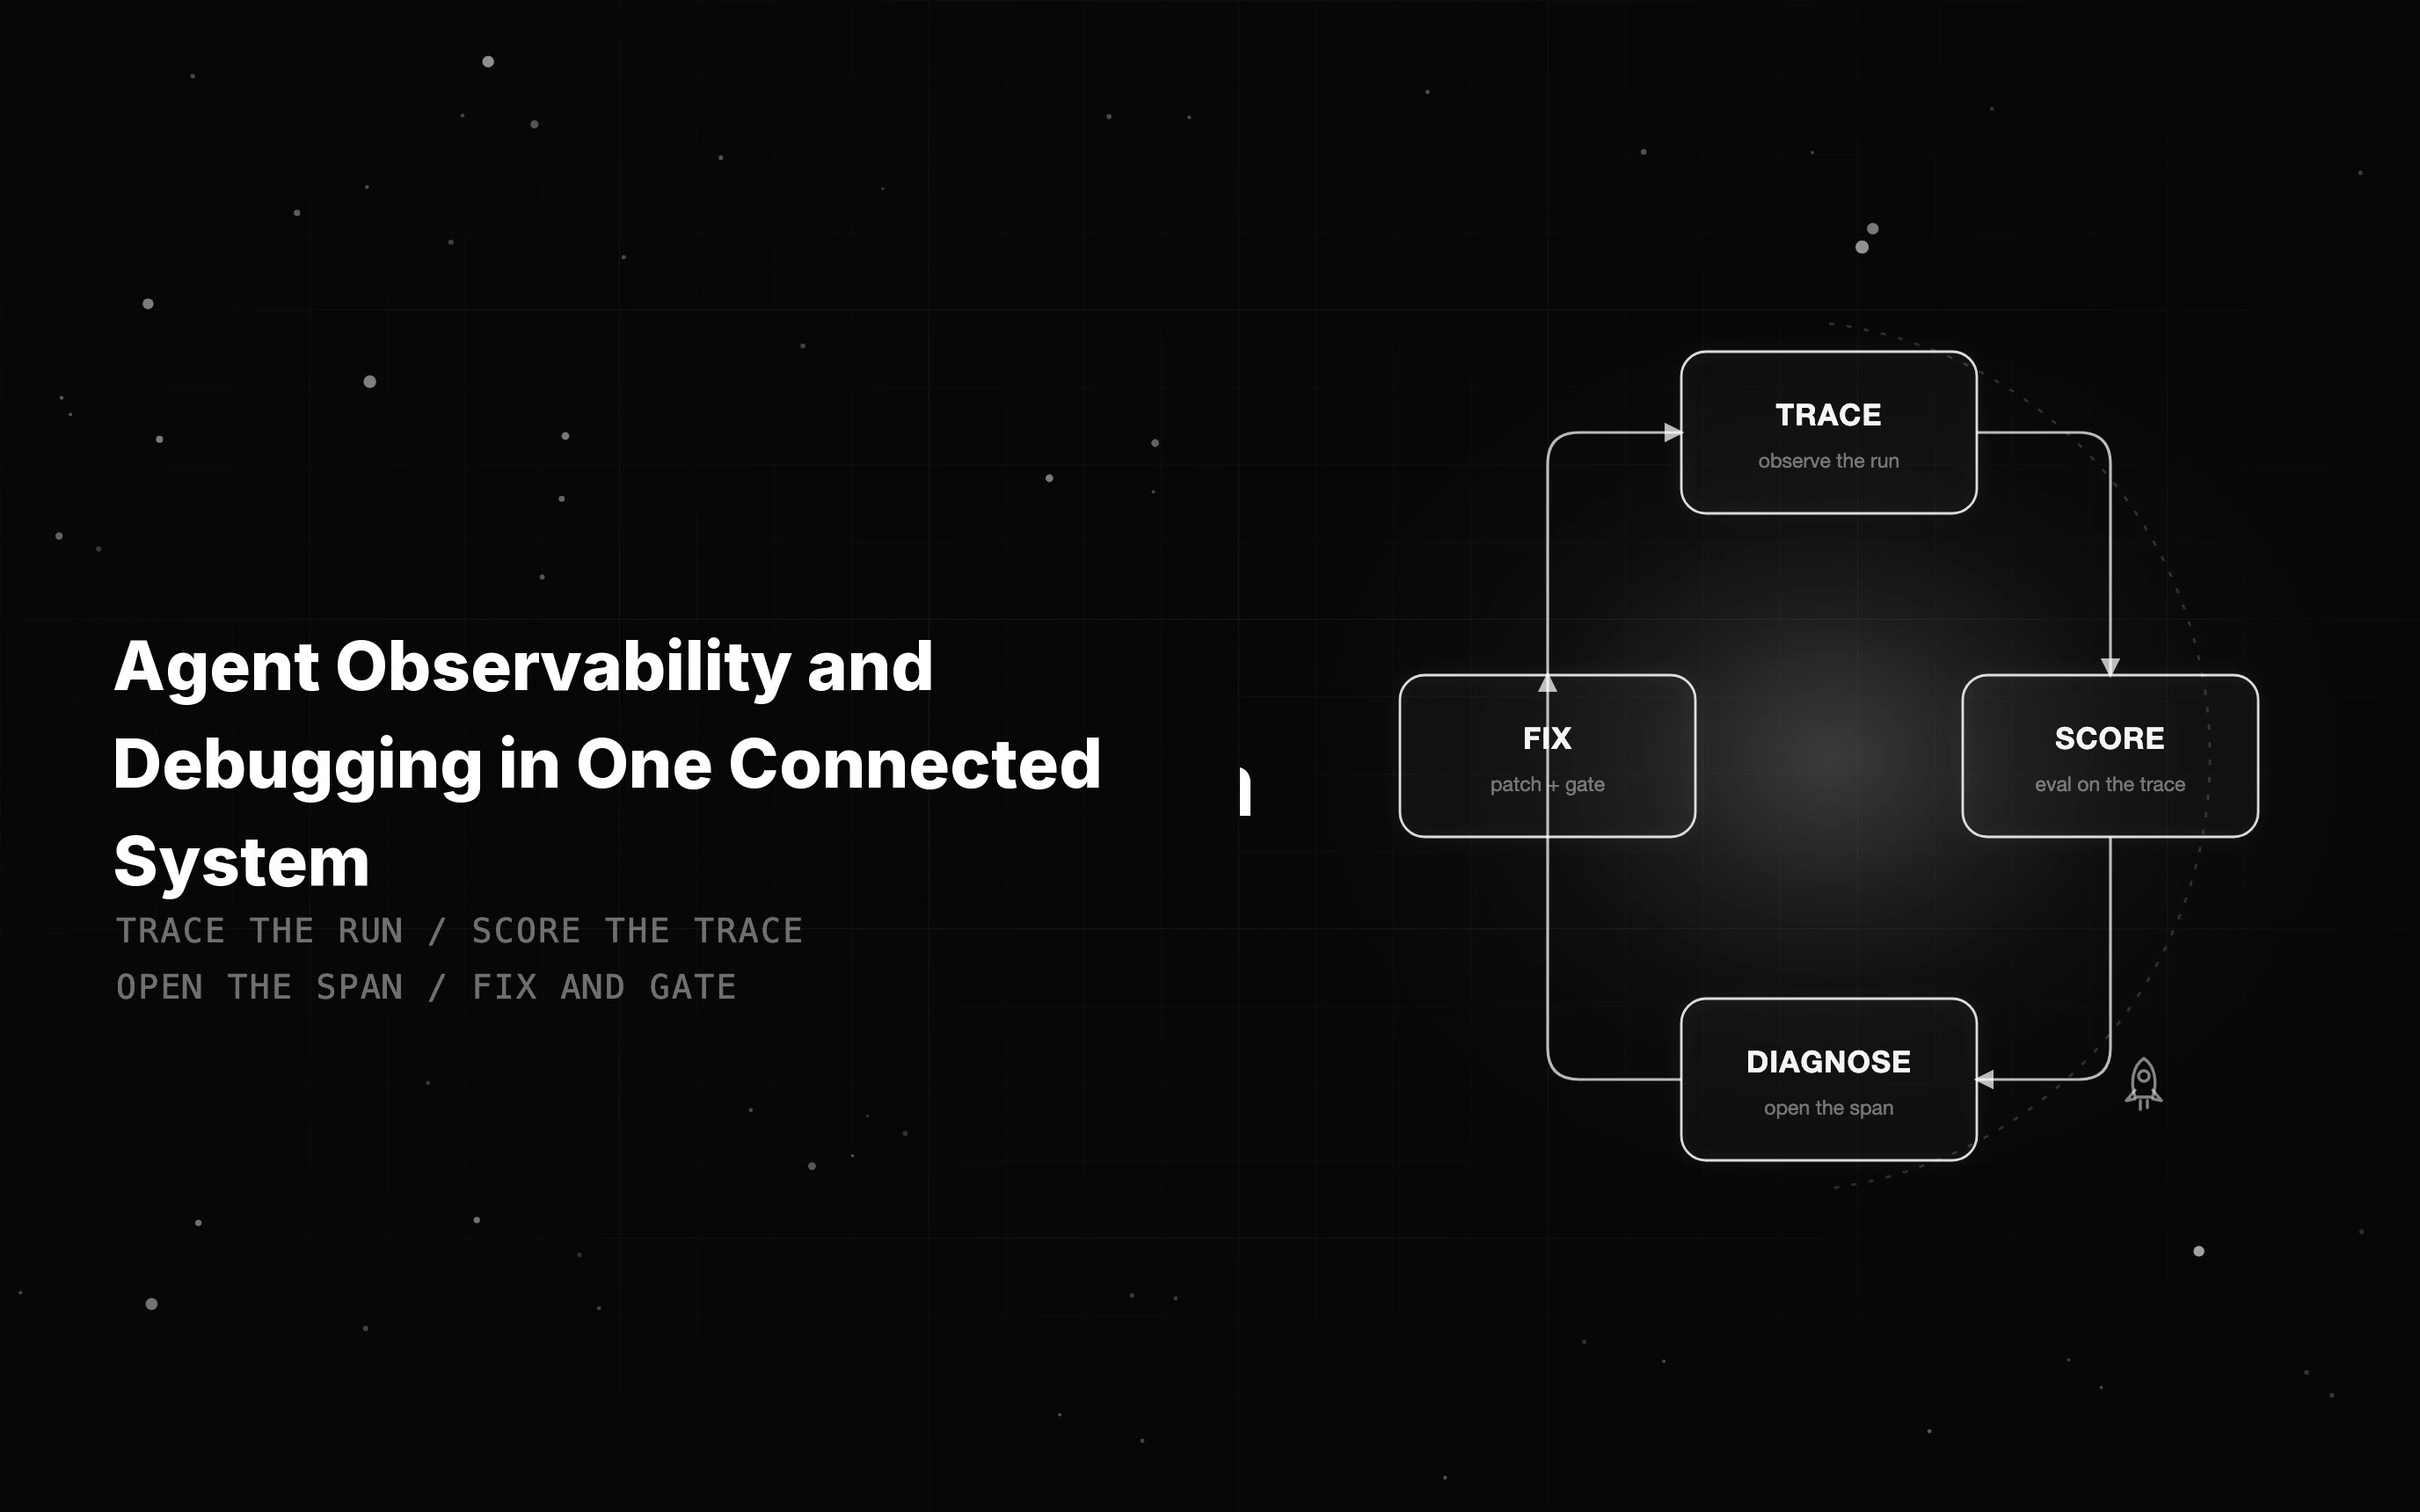
Table of Contents
A support agent books the wrong refund. Step 4 of its nine-step run picked the wrong tool, but every log says 200 OK. The service was healthy the whole time. The only thing that broke was the outcome the customer saw.
Request and response logging tells you the agent ran. It does not tell you why it went wrong. You see a green status code and a returned payload, while the reasoning that led to the bad action stays invisible between the two.
That gap is where agent failures live. An agent makes a chain of decisions: it plans, calls tools, reads memory, and hands work to other agents. A single wrong turn at step 4 produces a confident, well-formed, completely wrong result.
Agent observability and debugging only work when three things share one system: the trace that records what happened, the evaluation that judges whether it was right, and the fix that closes the gap. Split them across three tools and the link between a failure and its cause breaks.
TL;DR
- Request logs prove an agent responded. They do not show why it chose a wrong action, which is where most agent failures hide.
- Agent observability is full-trajectory visibility: every tool call, reasoning step, state change, memory operation, and handoff, captured as spans.
- The payoff comes from connection: a trace you can score, a failing span you can open, and a fix you can gate, all in one place.
- Instrument tool calls, plans, state transitions, and handoffs with OpenTelemetry so your traces stay portable, using its GenAI conventions where they exist (still experimental) and your own span names where they do not.
- Turn each recurring failure into an eval on the exact span that reveals it, and the same bug cannot ship twice.
What agent observability actually means
Agent observability is full-trajectory visibility into an autonomous system. It captures every tool call, every reasoning or planning step, every state change, every memory read and write, and every handoff between agents. The unit is not a request. It is the full path the agent took to an answer.
That is a different target from the two layers most teams already run. Application monitoring watches infrastructure: is the service up, how fast, what is the error rate. LLM observability watches a single model call: the prompt, the tokens, the response. Neither sees the multi-step trajectory where an agent goes wrong.
The distinction matters because the failure and its signal sit in different layers. A monitoring dashboard shows a healthy 200. An LLM view shows a fluent response. Only the agent trajectory shows that step 4 called the refund tool when the plan said escalate. The table below lines up what each layer answers and what it misses.
| Layer | Unit of visibility | Answers | Misses |
|---|---|---|---|
| APM / infra monitoring | Service, request | Is it up, how fast | Why the agent chose wrong |
| LLM observability | Single model call | Prompt, tokens, response | Multi-step trajectory, tool use |
| Agent observability | Full agent trajectory | Why it acted, where it broke | Whether the outcome was correct |
One framing helps here: let a production question steer the trace. Instead of scrolling dashboards hoping to spot trouble, you begin with a concrete symptom, “why did this run refund the wrong order?”, and follow it straight to the span that answers it. Observability becomes an investigation you drive from a real question.
What to instrument in an AI agent
If observability is trajectory visibility, instrumentation is the work that makes the trajectory visible. You wrap each meaningful action the agent takes in a span, and you attach the data that makes the span worth reading later.
Six span types cover most agents: tool-call spans, reasoning or plan spans, state transitions, memory reads and writes, retrieval spans, and inter-agent handoffs. Each one marks a place the agent could go wrong, so each deserves its own recorded step rather than a single opaque “agent ran” entry.
A span is only as useful as what it carries. Every span should record its inputs, its outputs, latency, any error, its parent and child links, and token cost. Without the parent-child link you get a pile of events. With it you get a tree you can walk from the final answer back to the decision that caused it.
Two cautions ride along with capturing that much. Inputs and outputs are exactly where personal data lands, so redact sensitive fields before a span leaves your process.
At real traffic you also cannot keep every trace, so sample deliberately: hold a small fraction of healthy runs and, ideally, every errored one, so the failures you actually debug are the ones that survive.
Lean on OpenTelemetry for those attributes rather than a homegrown schema. Its GenAI semantic conventions already name spans like invoke_agent and execute_tool, though they sit at an experimental stage and do not yet cover multi-agent handoffs, so you name those spans yourself.
Portable spans mean the same tracing works across backends, so you avoid lock-in to any one vendor’s format. Future AGI’s traceAI builds directly on OpenTelemetry, so your spans stay portable.
Sessions, traces, spans
The hierarchy keeps a busy system legible. A span is one operation. A trace is the ordered set of spans for one request, the full trajectory. A session groups the traces from one user or conversation, so a multi-turn failure that only appears on turn seven is still reachable from turn one.
Once you can trace an agent at this granularity, debugging changes shape. You stop guessing from inputs and outputs and start reading the recorded path the agent actually took.
The loop that turns a trace into a fix
A trace on its own is a recording. The value shows up when the recording drives a fix, and that only happens when the steps connect.
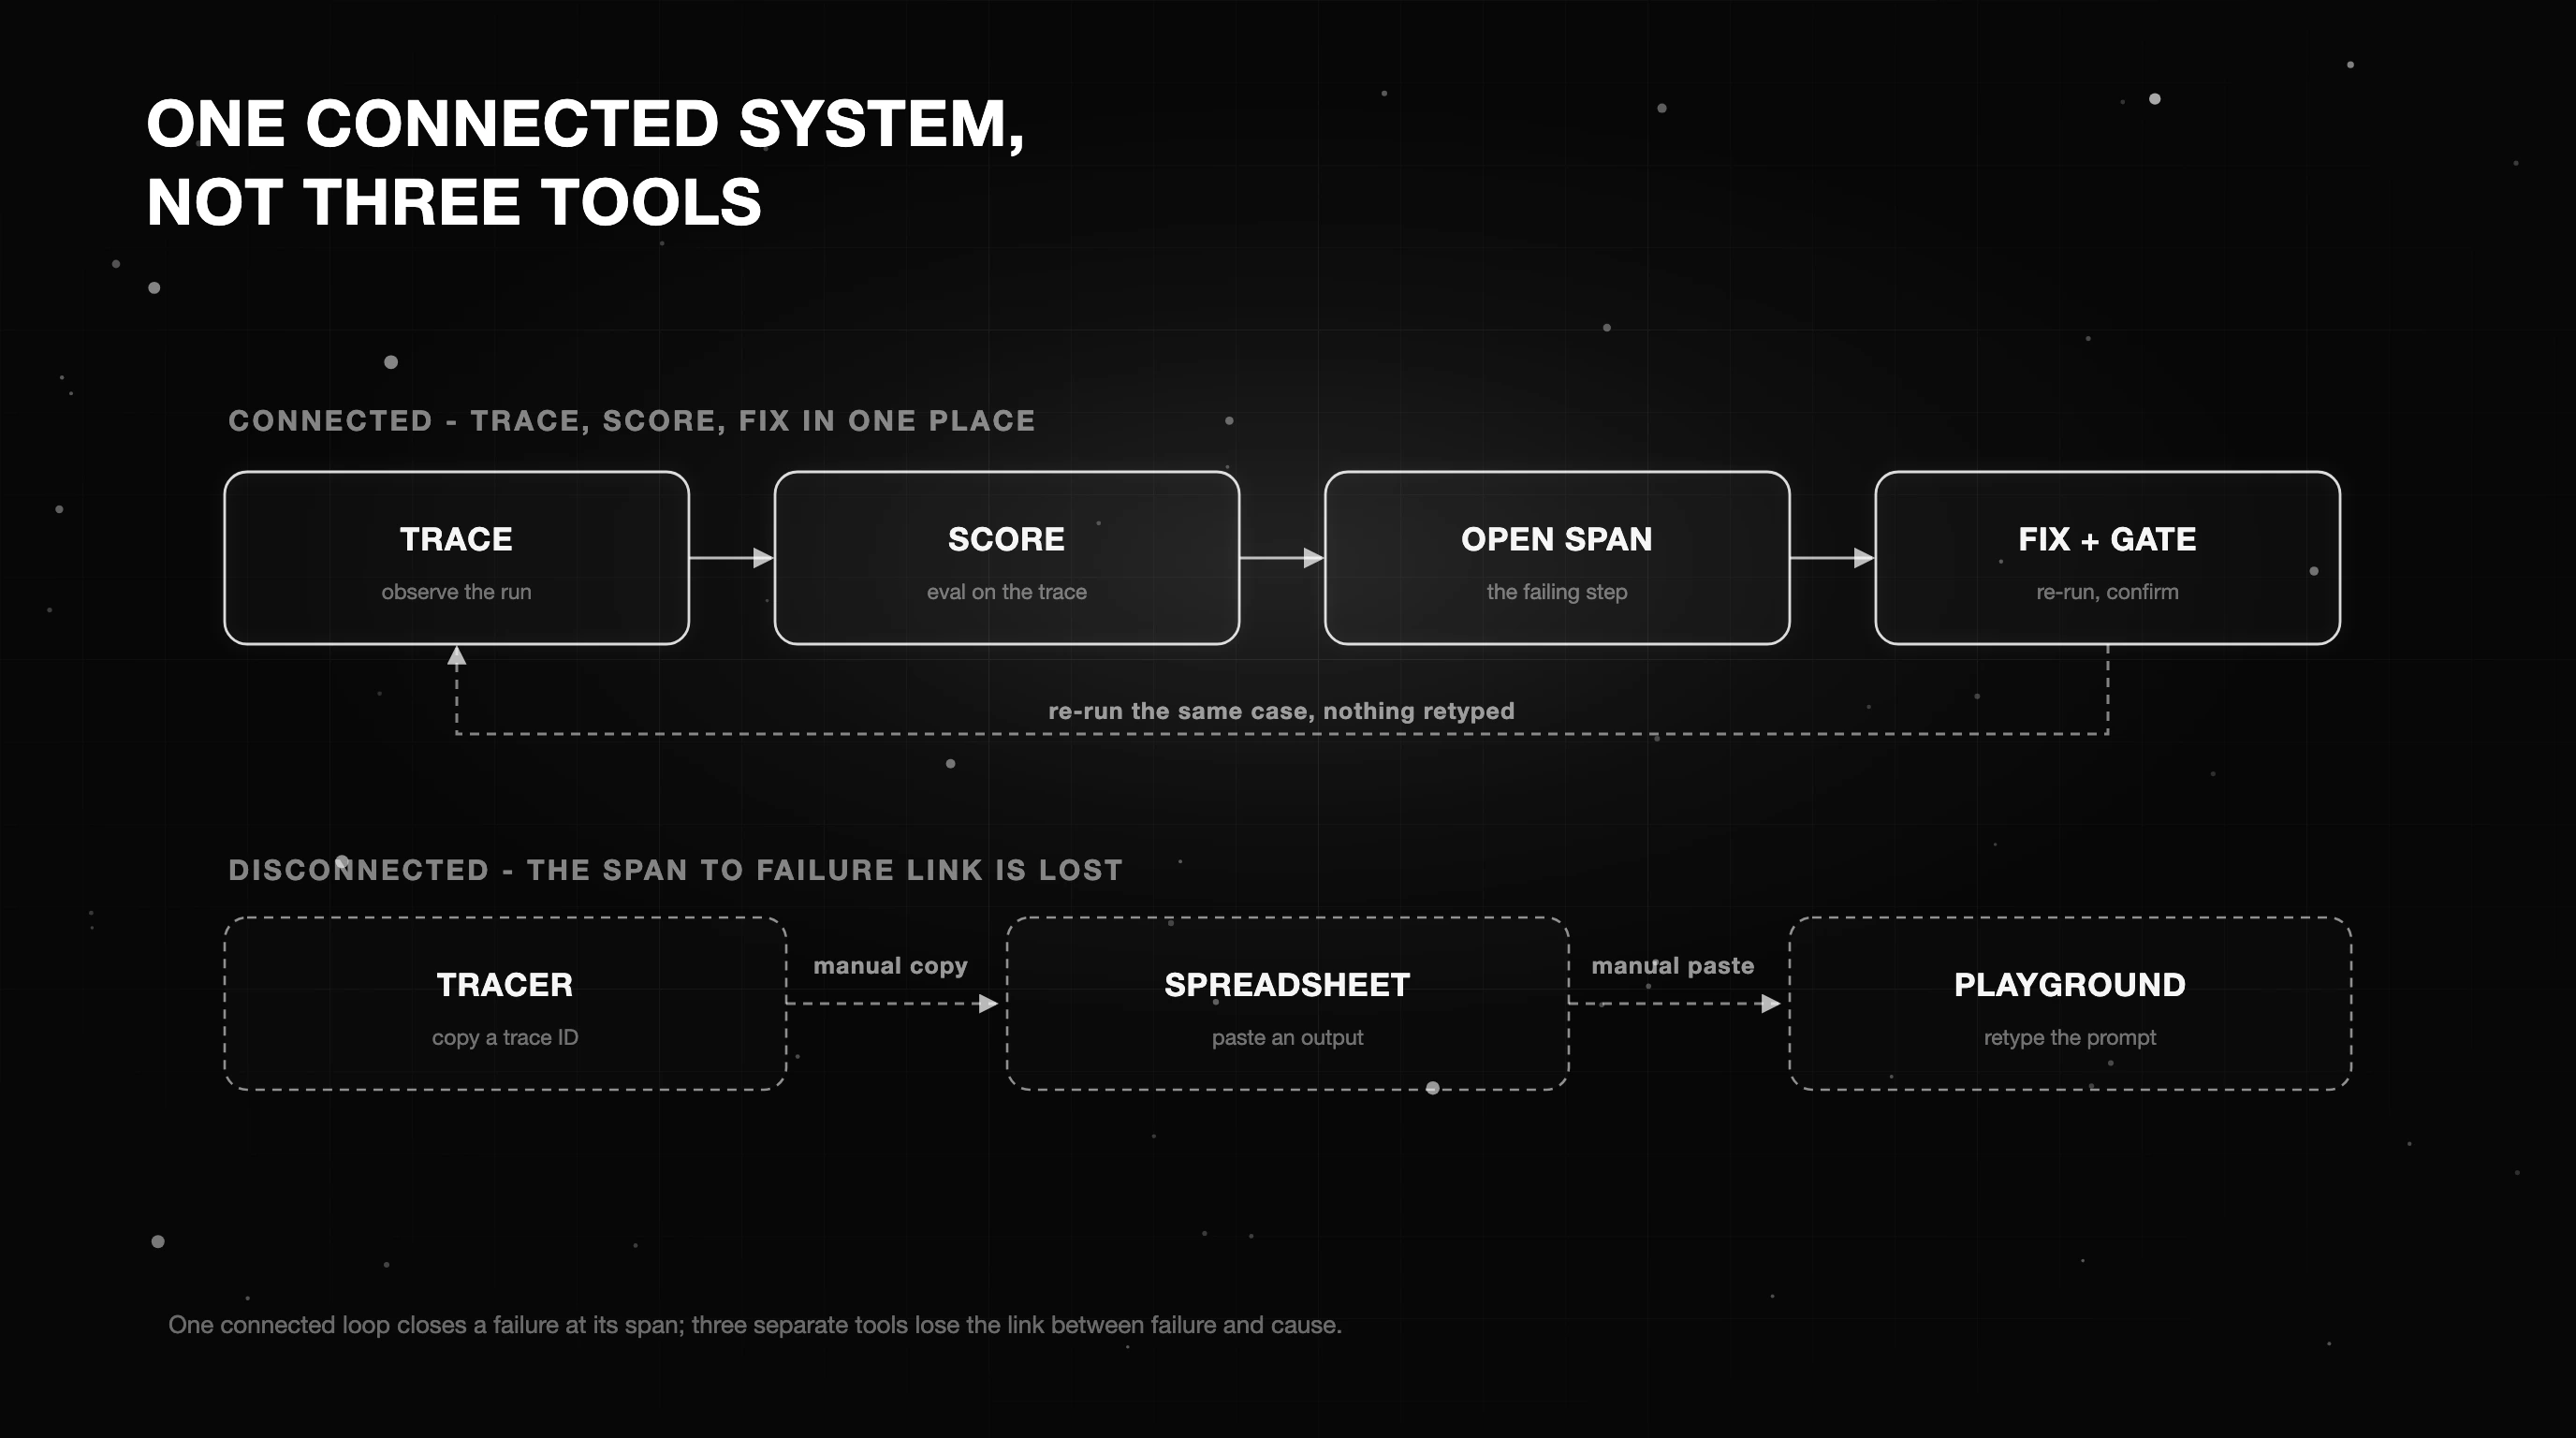
The loop has six moves: observe the run as a trace, detect a problem with an eval on that trace, diagnose by opening the failing span, fix the prompt or tool or route, re-run, and confirm the fix held. Our walkthrough on debugging AI agents from trace to fix takes one run through those moves step by step.
Each move hands its output to the next without a manual copy step. The eval reads the trace you already captured. The diagnosis opens the exact span the eval flagged. The re-run replays the same case the fix was written for. Nothing is retyped, so nothing is lost in translation.
This is why disconnected tooling breaks the loop. When the tracer, the scoring spreadsheet, and the prompt playground are three separate tools, you copy a trace ID into a sheet, paste an output into a playground, and lose the link between a specific failure and the span that caused it. The loop degrades into three chores nobody finishes.
That connection is what makes debugging repeatable instead of a fresh guess every time. A failure you can trace, score, and replay in one place is a failure you can close.
Turning a failing trajectory into a regression test
The last move is the one that compounds. When a fix holds, save the failing trajectory as a test case with its input, expected outcome, and the span-level check that caught it. Re-run it on every change. The bug you fixed once becomes a gate the agent has to pass forever, so it cannot return three deploys later.
Here is that gate as a few runnable lines. It replays the agent, captures the spans in memory, and asserts the exact span-level check that first caught the failure. Drop it in your test suite and the trajectory becomes a fixture CI has to pass.
from opentelemetry import trace
from opentelemetry.sdk.trace.export import SimpleSpanProcessor
from opentelemetry.sdk.trace.export.in_memory_span_exporter import InMemorySpanExporter
from agent import agent_step  # the instrumented agent from above

def collect_spans(fn, user_msg):
    exporter = InMemorySpanExporter()
    trace.get_tracer_provider().add_span_processor(SimpleSpanProcessor(exporter))
    fn(user_msg)
    return {s.name: s for s in exporter.get_finished_spans()}

def test_refund_trajectory():
    spans = collect_spans(agent_step, "refund order 123")
    # the span-level check the eval flagged: search must return a real result
    out = spans["tool.search"].attributes["tool.output"]
    assert out and out != "results for ", f"regression on refund path: {out!r}"
The check is deliberately small: one span, one attribute, one assertion. That is the point. Each failure you name becomes one of these, and the set of them is your regression suite.
Tracing multi-agent systems and handoffs
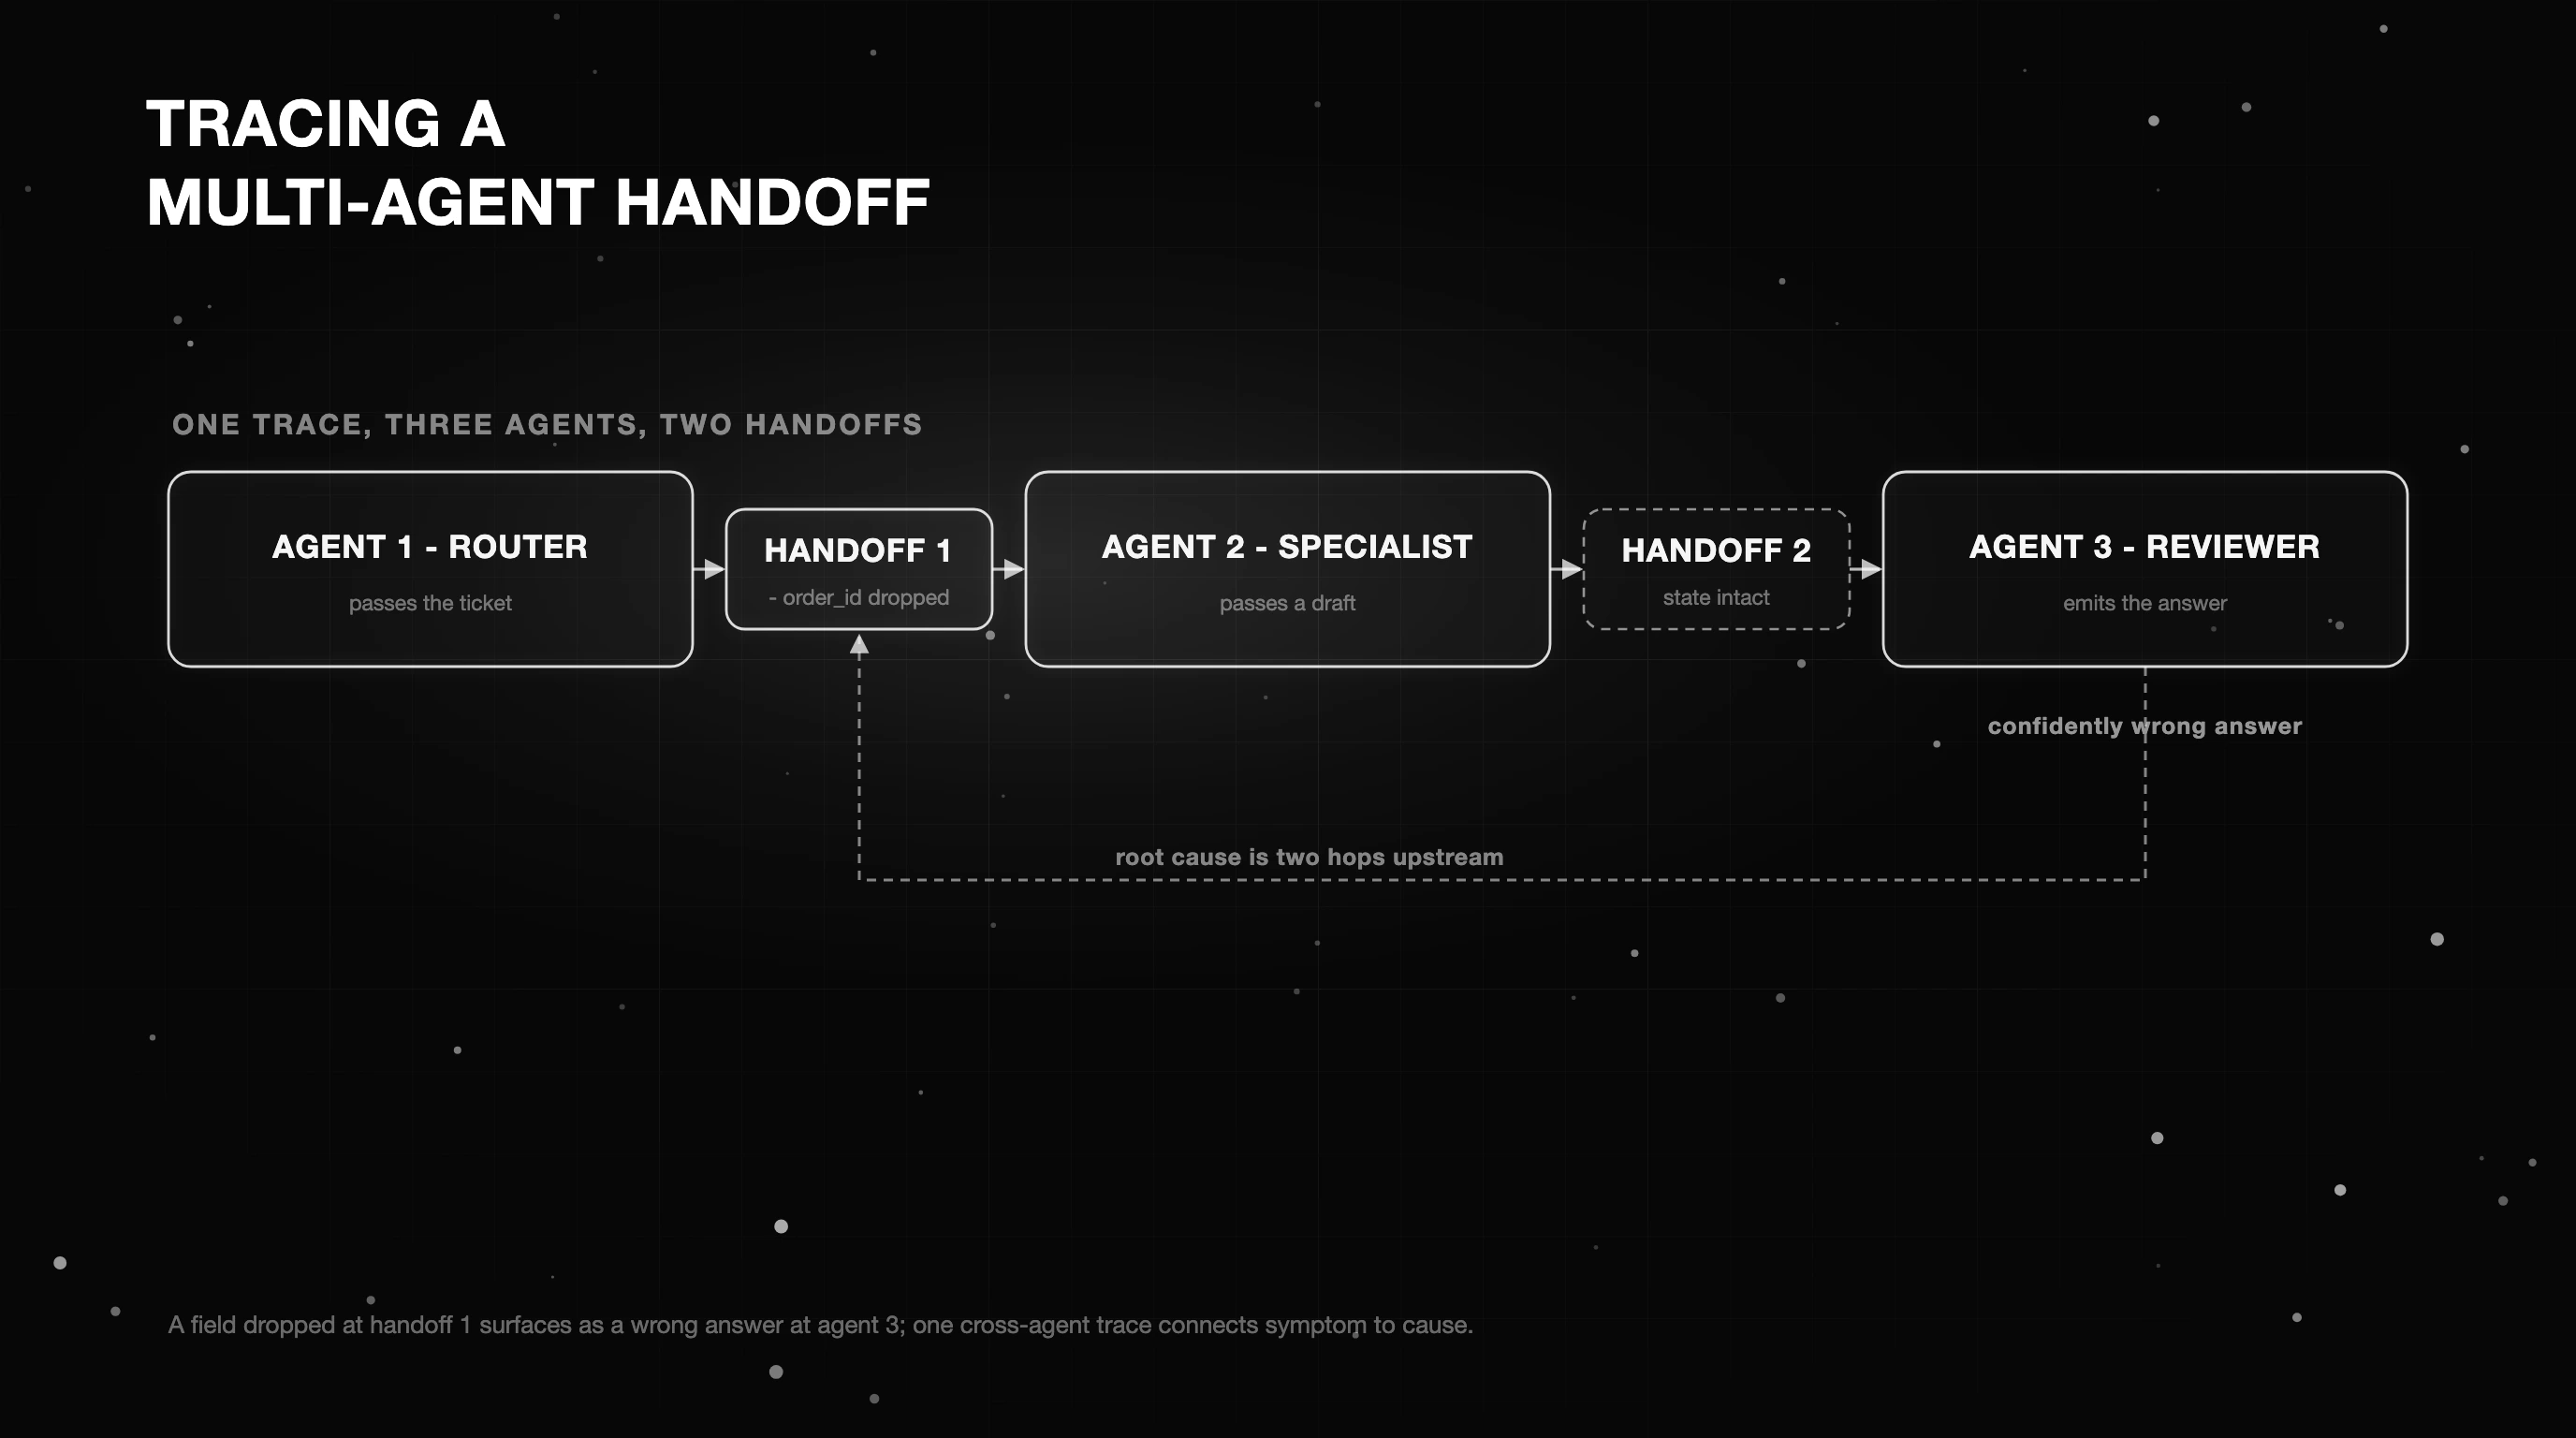
Multi-agent systems fail in a way single-agent tools rarely catch. Picture three agents and two handoffs: a router passes a ticket to a specialist, which passes a draft to a reviewer. The failure is a context field dropped at handoff 1 that nothing notices until agent 3 produces a confidently wrong answer.
The symptom and the cause are two hops apart. Agent 3 looks broken, but agent 3 did its job with the incomplete state it received. The real defect is the silent drop at the first handoff, and only a trace that spans all three agents shows it.
So capture the handoff itself as a first-class span. Record the state passed out, the receiving agent, and, most importantly, the diff: which fields were added, which carried through, and which went missing. A handoff span with a field diff turns “agent 3 is wrong” into “handoff 1 dropped the order ID.”
Single-agent tooling misses this because it has no cross-agent parent linking. Each agent’s spans form their own little tree, and the connection between them, the place the bug lives, is exactly what never gets recorded. To debug multi-agent systems you need one trace that threads every agent and every handoff under a shared parent.
From observability to evaluation on the same trace
The connected-system payoff is sharpest here: the quality score attaches to the exact span, not to a separate spreadsheet. When an eval runs on the trace itself, a failing grade points at the precise step that earned it, and you open that step in one click instead of reconstructing the run from a row in a dataset.
Evals are how you turn a trace into a pass or fail signal. You start from a built-in library (Groundedness, Context Relevance, Precision@K, and more) and add a custom eval when your domain needs one.
A grading rule is either a deterministic check (did the tool return valid JSON, did the answer cite a real order) or an LLM judge for fuzzier questions (was the response actually helpful). You point it at the span and columns you care about, set a threshold, and run it as a gate on new traces.
That gate is the difference between watching quality and enforcing it. A deterministic rule catches structural breakage. A judge catches the wrong-but-well-formed answers that every operational metric misses. Running both on traces you already capture means evaluation costs you almost no new plumbing.
This is also where the categories stop blurring. If you are still mapping the terms, the difference between observability versus evaluation is simple: observability records what the agent did, evaluation decides whether it was good. You evaluate a trace to close that gap, and the score lives on the span.
Instrumenting an agent, end to end
Here is the smallest real instrumentation that captures a trajectory. It uses OpenTelemetry directly, wraps each tool call in its own span with inputs, outputs, and errors, and nests those spans under an agent-step span so the trace reads as a tree.
from opentelemetry import trace
from opentelemetry.sdk.trace import TracerProvider
from opentelemetry.sdk.trace.export import BatchSpanProcessor, ConsoleSpanExporter

trace.set_tracer_provider(TracerProvider())
trace.get_tracer_provider().add_span_processor(
    BatchSpanProcessor(ConsoleSpanExporter())
)
tracer = trace.get_tracer("agent.demo")

def run_tool(name, fn, **kwargs):
    with tracer.start_as_current_span(f"tool.{name}") as span:
        span.set_attribute("tool.name", name)
        span.set_attribute("tool.input", str(kwargs))
        try:
            out = fn(**kwargs)
            span.set_attribute("tool.output", str(out))
            return out
        except Exception as e:
            span.record_exception(e)
            raise

def agent_step(user_msg):
    with tracer.start_as_current_span("agent.step") as step:
        step.set_attribute("input.message", user_msg)
        # each tool call becomes a child span under this step
        return run_tool("search", lambda q: f"results for {q}", q=user_msg)

if __name__ == "__main__":
    print(agent_step("refund order 123"))
Read it top down. The provider and exporter are standard opentelemetry-sdk setup; here they print spans to the console so you can run the file as is. The BatchSpanProcessor flushes on the interpreter’s exit hook, so a normal run prints everything, while a hard crash would drop whatever is still buffered, and SimpleSpanProcessor prints synchronously if you want that.
run_tool opens a span per tool call, records the input and output, and captures any exception on the span before re-raising, so a failure shows up in the trace instead of vanishing. agent_step is the parent span each tool call nests under.
To ship spans to a real backend, swap ConsoleSpanExporter for the OTLP exporter pointed at your collector. Nothing else in the code changes, which is the point of standard conventions: the instrumentation is portable and the destination is a config detail. A vendor’s tracer slots in exactly where the exporter is configured.
Follow send your first trace for the exact exporter configuration, and the same spans you printed to the console start landing in a backend you can search and score. The instrumentation you just wrote is the whole on-ramp.
Because the core is OTel-native and open source, you can read exactly what the instrumentation does before you adopt it. Future AGI on GitHub ships the Apache-2.0 tracing core, so there is no black box between your agent and the spans it emits.
A field taxonomy of agent failure patterns
Once you can read trajectories, debugging turns into pattern matching. The same failures recur across agents, and each one shows up as a recognizable shape in the trace. Naming them means you stop debugging from scratch every time and start reaching for the span you know reveals each one.
| Failure pattern | Symptom | Span that reveals it | Fix lever |
|---|---|---|---|
| Tool-call loop | Same tool 5x, no progress | Repeated sibling tool spans | Loop guard / max steps |
| Wrong tool selection | Plausible answer, wrong action | Reasoning span vs tool span mismatch | Tool descriptions / few-shot |
| Context loss at handoff | Agent 3 misses a field | Handoff span diff | Explicit state contract |
| Runaway token spend | Cost spike, no user gain | Token attribute per span | Budget cap / route change |
| Silent tool failure | 200 OK, bad outcome | Tool output vs expected eval | Output validation gate |
Use the table as a lookup. A cost spike with no user benefit sends you to the token attribute on each span. An answer that looks plausible but triggers the wrong action sends you to the mismatch between the reasoning span and the tool span. The trace tells you which pattern you are looking at.
The connection back to the loop is what makes this durable. Every row is also an eval you can gate on. A tool-call loop becomes a max-step assertion. A silent tool failure becomes an output-validation check. Each pattern you name once becomes a check that catches it from then on, so your taxonomy of failures doubles as your regression suite.
Future AGI for agent observability and debugging in one system
This is the loop in one system rather than three. Future AGI captures agent traces with OpenTelemetry-native instrumentation, so every tool call, reasoning step, and handoff lands as a span with inputs, outputs, latency, and cost. The traces stay portable because the core is standard OTel, not a proprietary format.
From there the connection is the product. Observe lets you open, search, and score any trace, and custom evals attach to the exact span, either a deterministic rule or an LLM judge, so a threshold turns a failing score into a merge gate.
Error Feed goes one step further: it groups similar failing traces into one issue you work like a ticket, so you fix a pattern once instead of chasing a hundred instances.
You get a large built-in evaluator library and write your own when “wrong” in your domain needs it, so you are never boxed into a fixed menu. The instrumentation layer, OpenTelemetry-native tracing through traceAI, is open source and Apache-2.0, so the path from your agent to a scored span stays fully inspectable.
Ship agents you can actually debug
Go back to the wrong refund from the opening. In a closed loop, that run is not a support ticket you discover on Monday. It is a failing span an eval catches before the change ships, with the exact tool call highlighted and a regression test already written from it.
That is the difference between observing agents and debugging them. Observation tells you something happened. A closed loop tells you what, why, and whether your fix held, without copy-pasting between three tools that each know a third of the story.
You do not need to instrument everything this week. Pick one agent and wrap its tool calls in spans. Attach one eval to the span that fails most. Gate one merge on it. That single closed loop is the whole method, and everything after that is the same loop, repeated.
Frequently Asked Questions
What is agent observability?
How is agent observability different from LLM observability?
What should you instrument in an AI agent?
What are common agent failure patterns?
Can agent observability connect to evaluation?
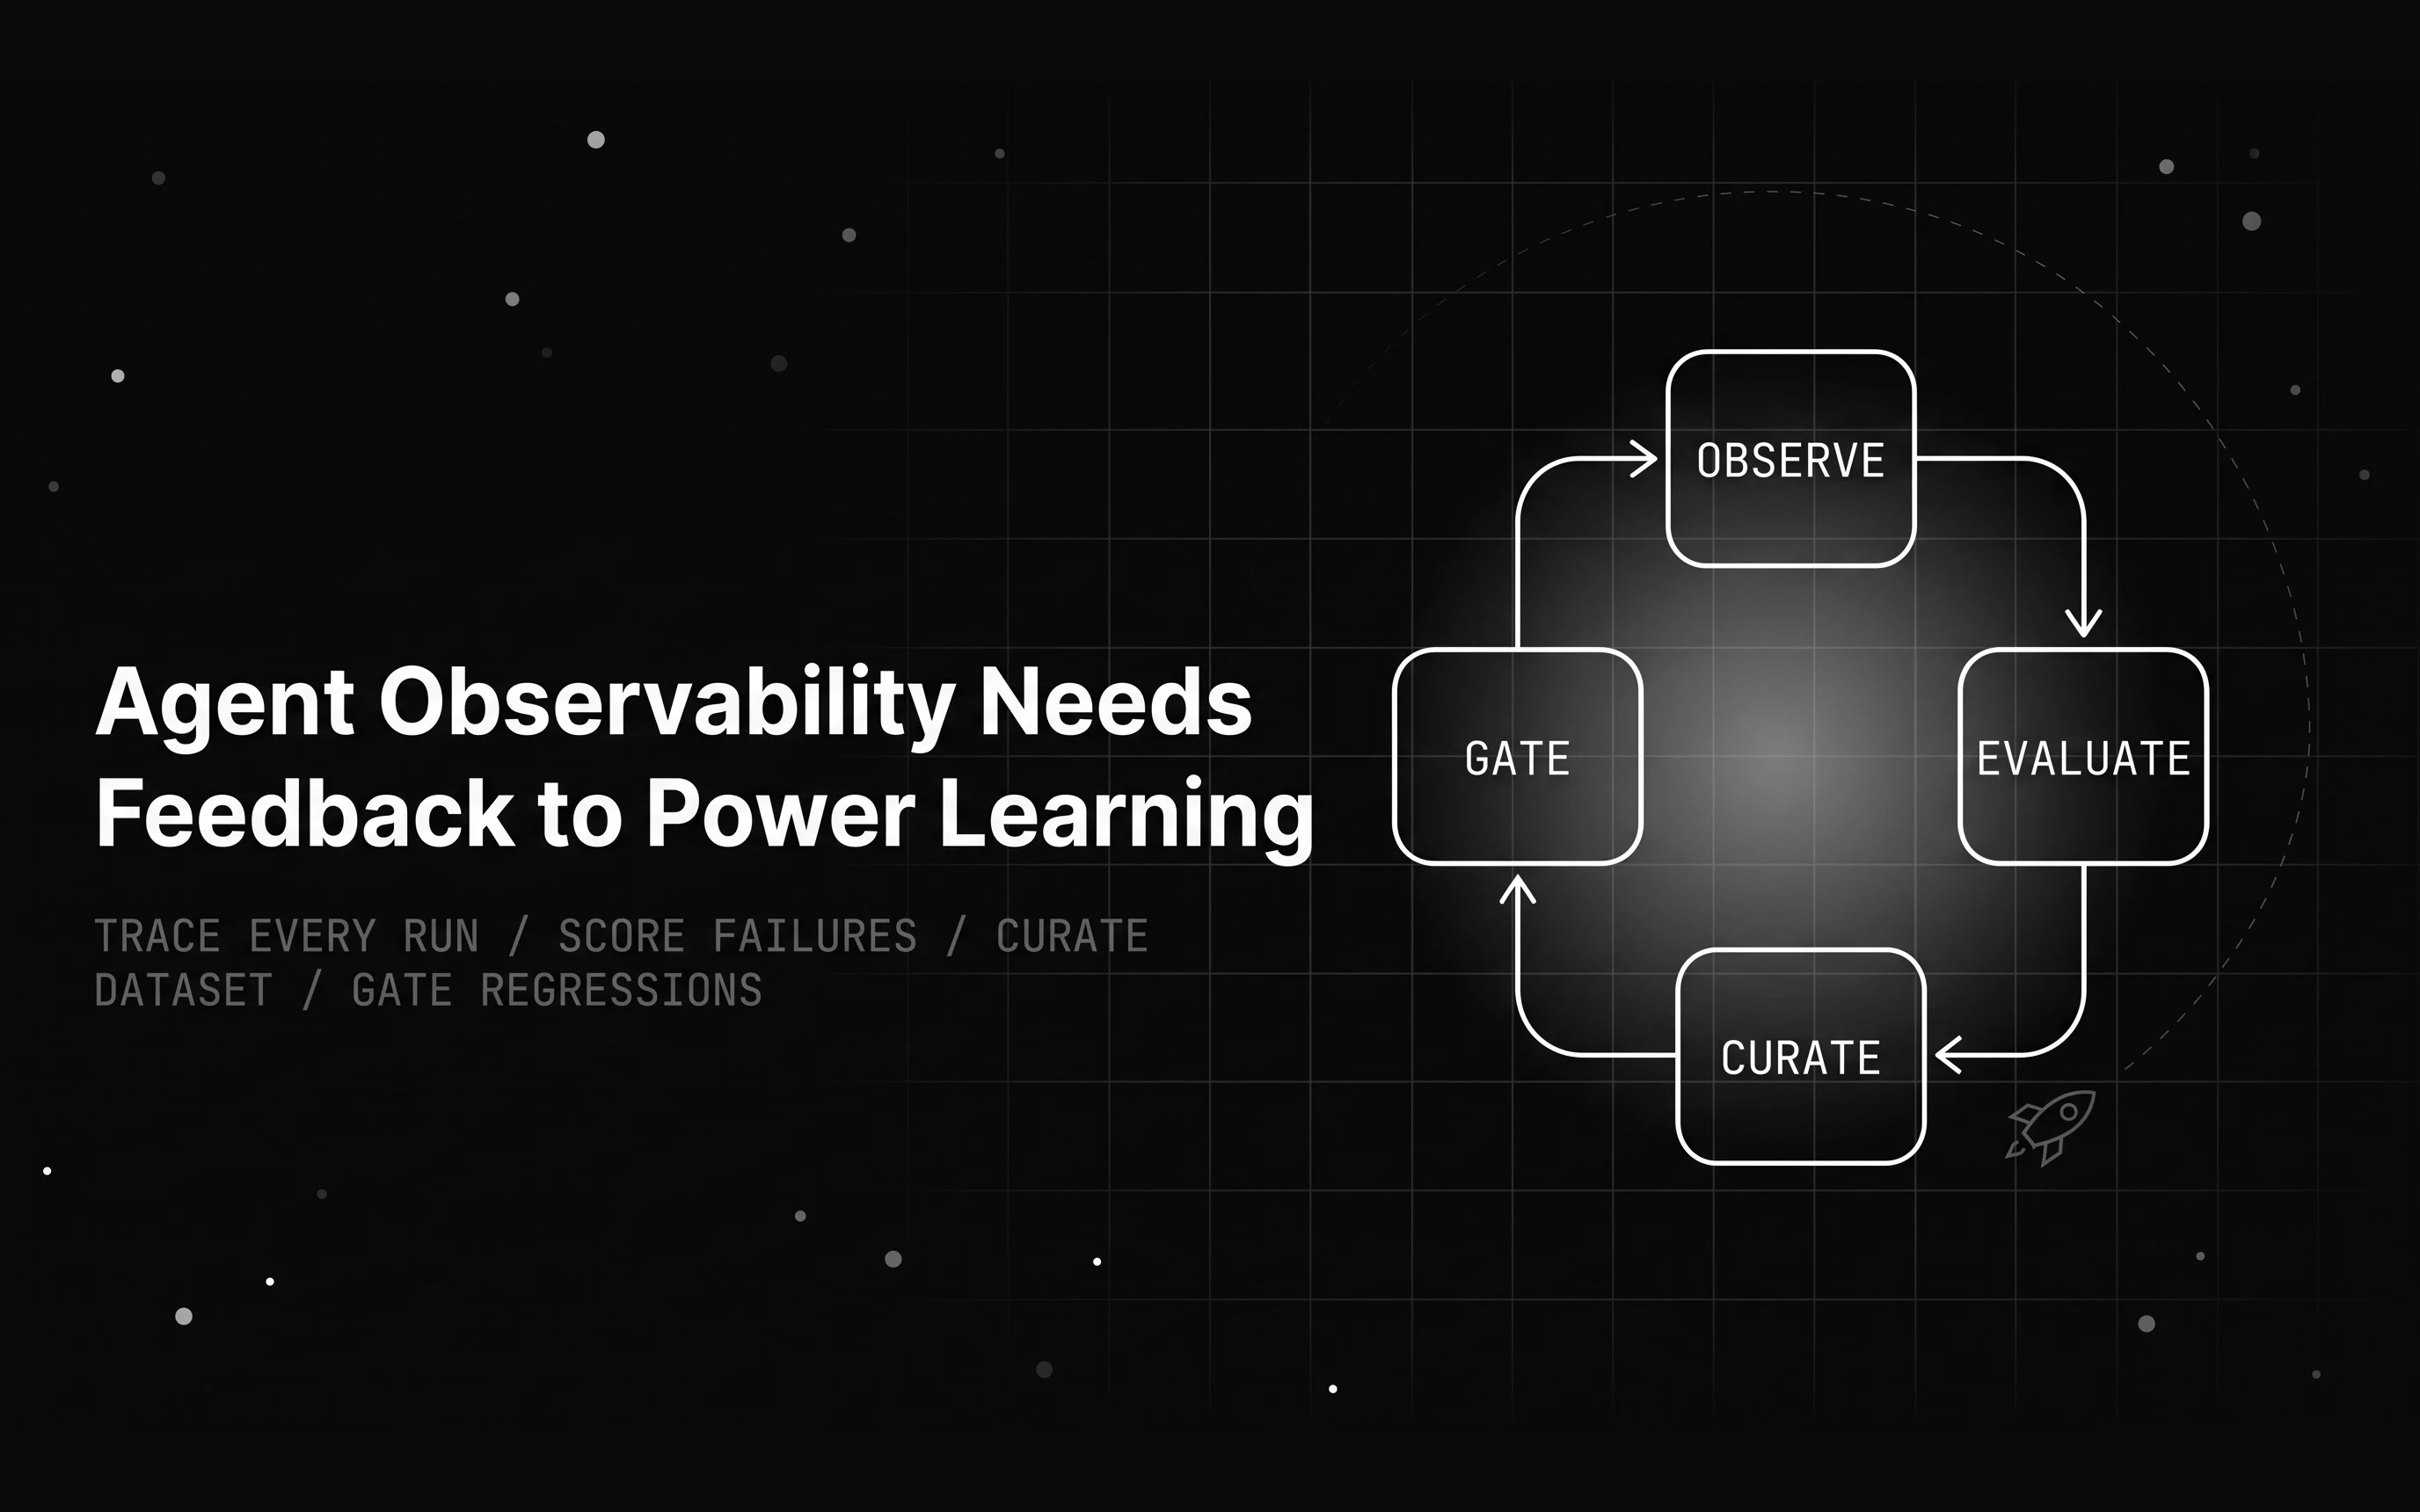
Agent observability captures what happened, but traces alone never improve an agent. Here is how to close the feedback loop from traces to agent learning.

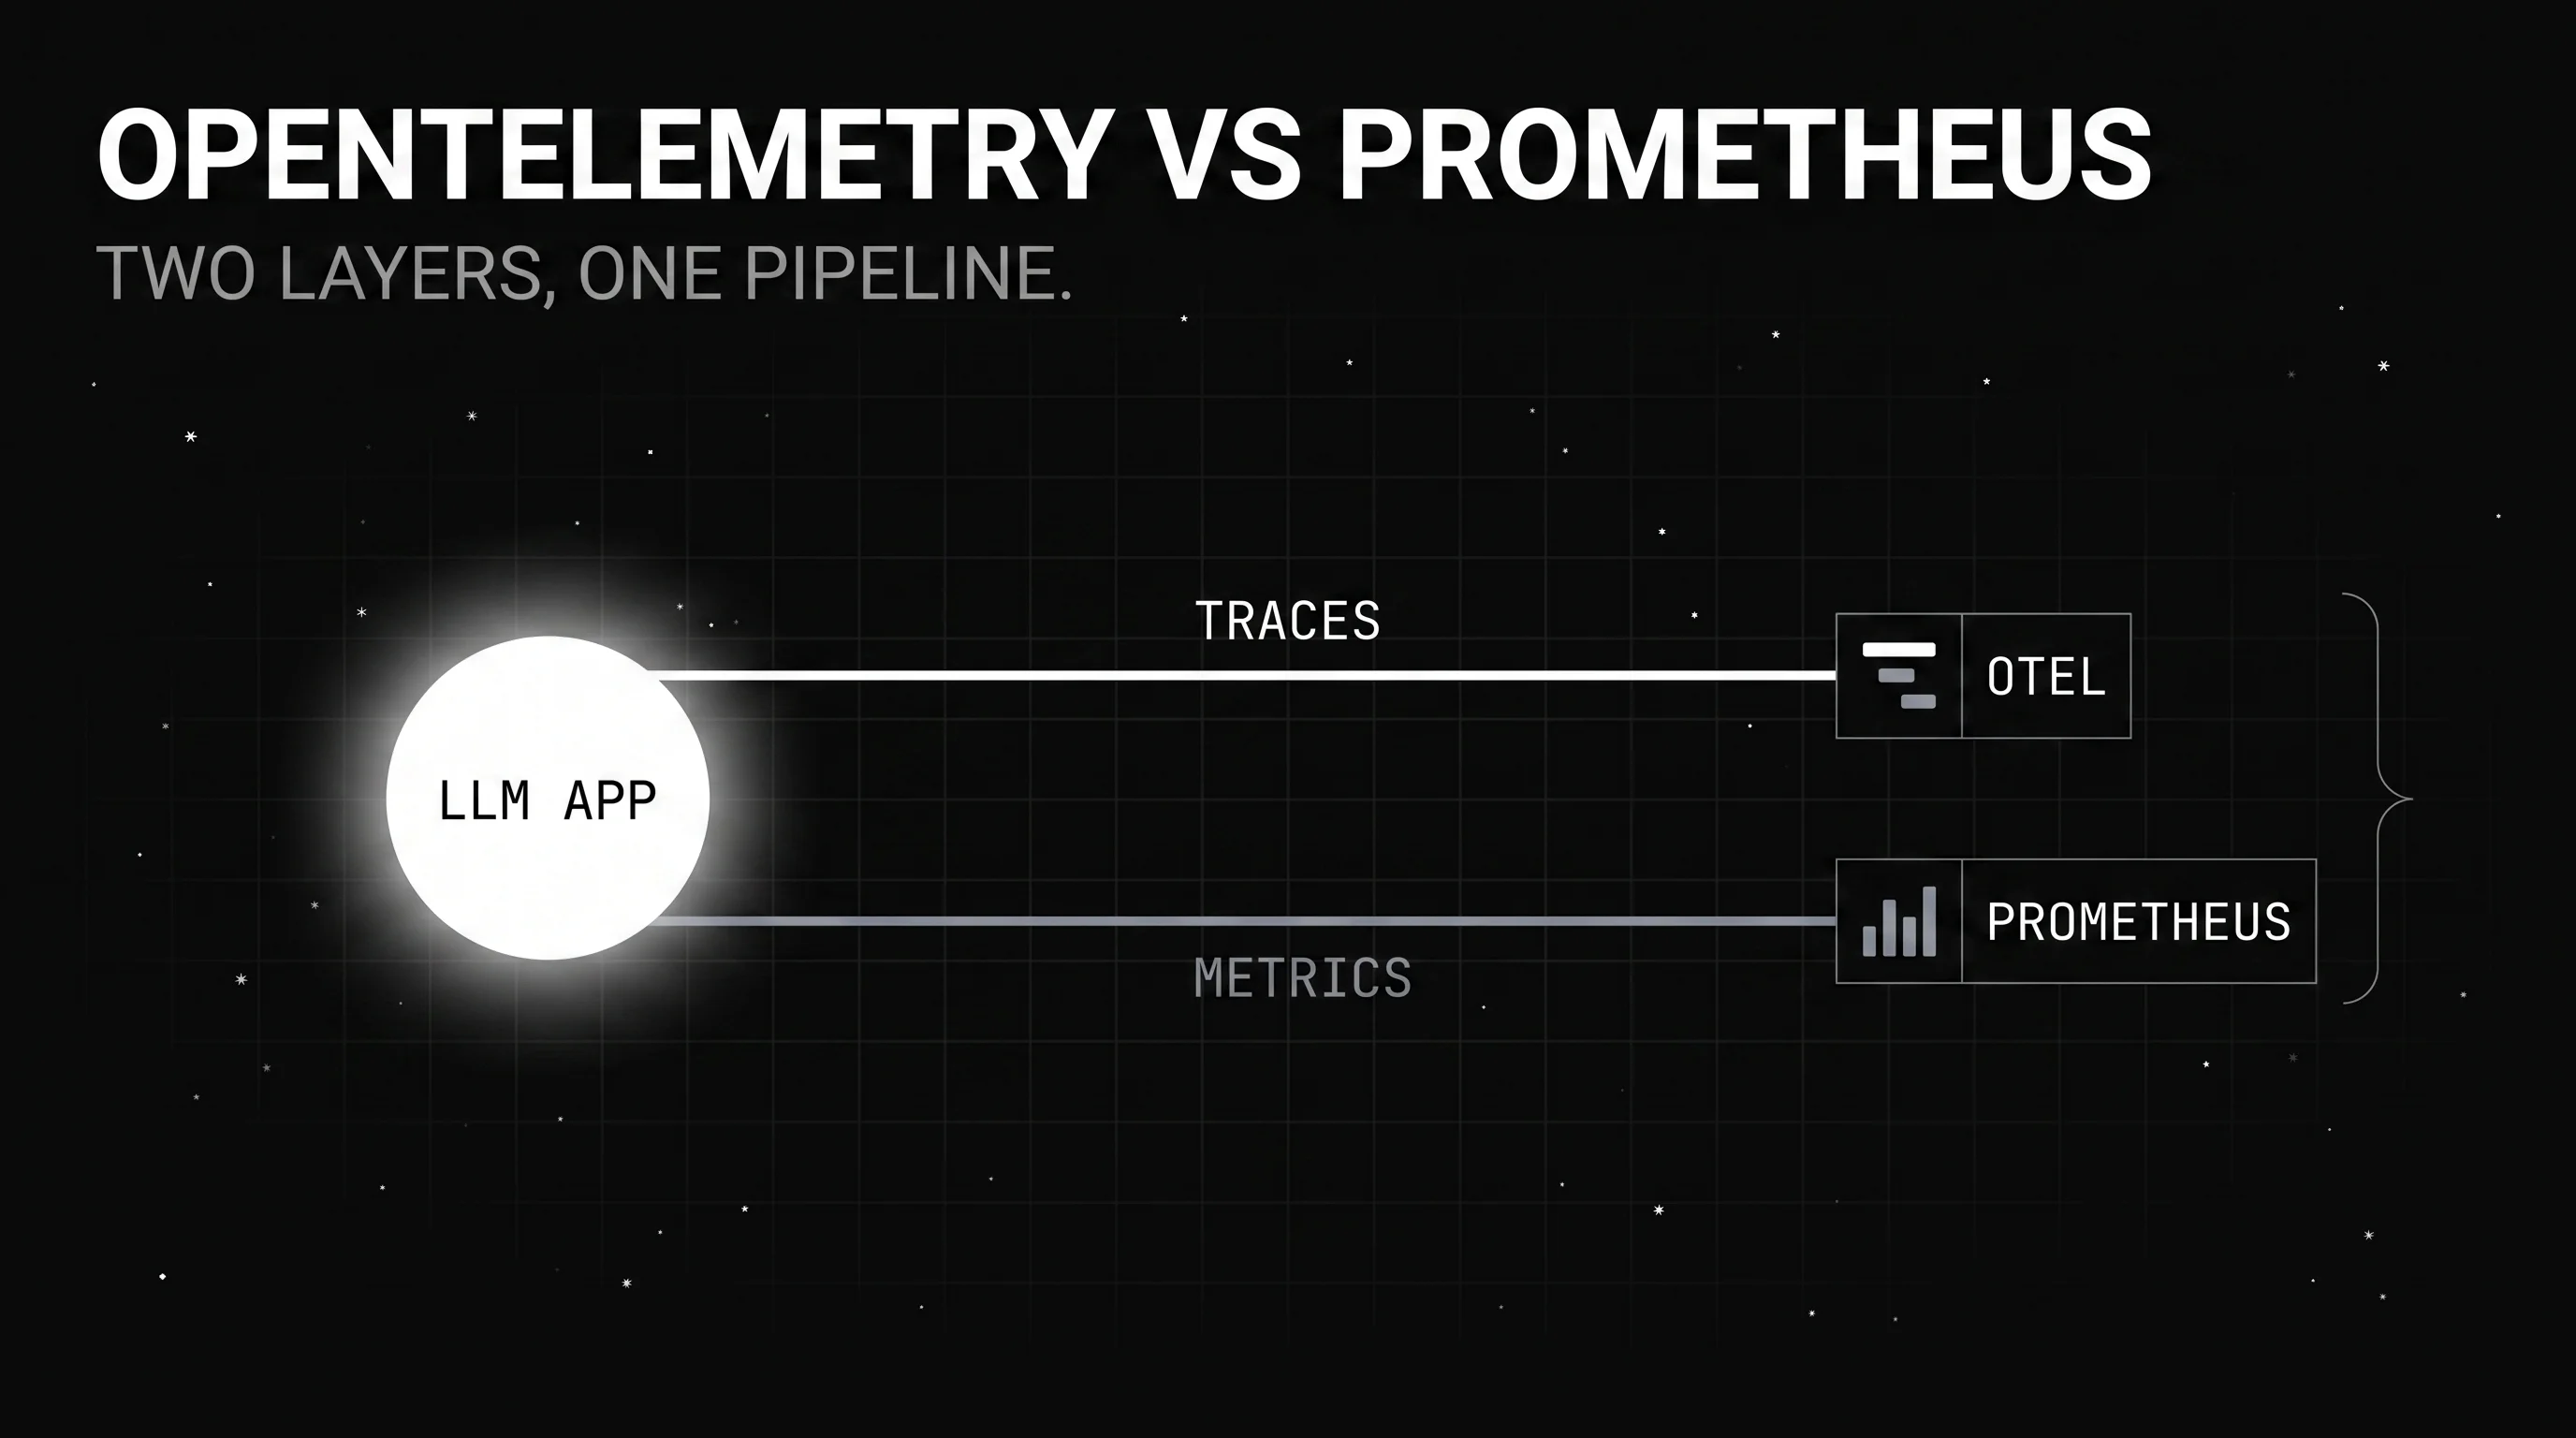
The opentelemetry vs prometheus question for LLM apps, answered: what each tool does, why they are complementary, the gen_ai conventions, and how to run both.

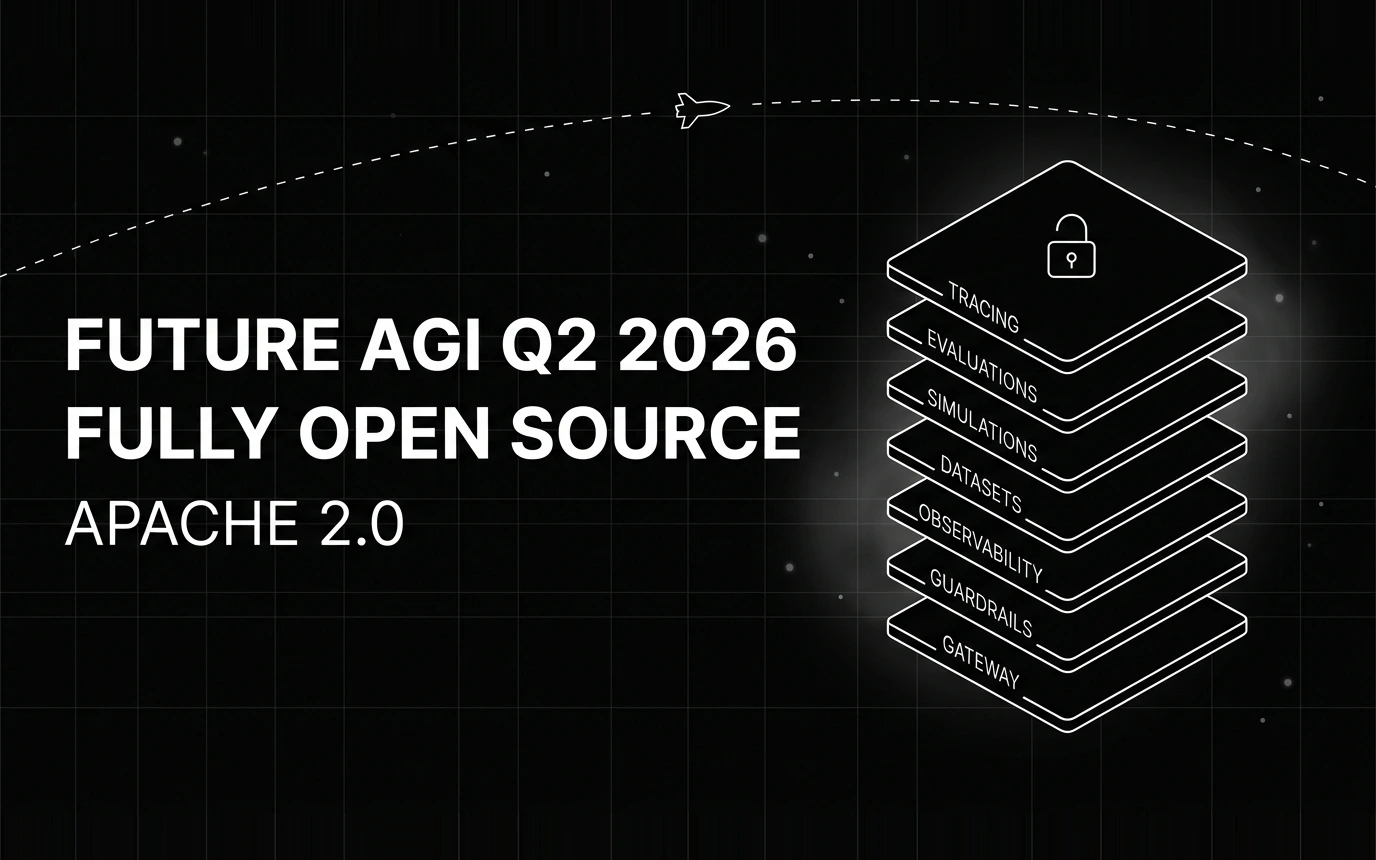
Inside Future AGI open source in Q2 2026: the platform shipped under Apache 2.0, Error Feed and the Agent Command Center went live, traces hit billions.