OpenTelemetry vs Prometheus for LLM Telemetry: Traces and Metrics
The opentelemetry vs prometheus question for LLM apps, answered: what each tool does, why they are complementary, the gen_ai conventions, and how to run both.
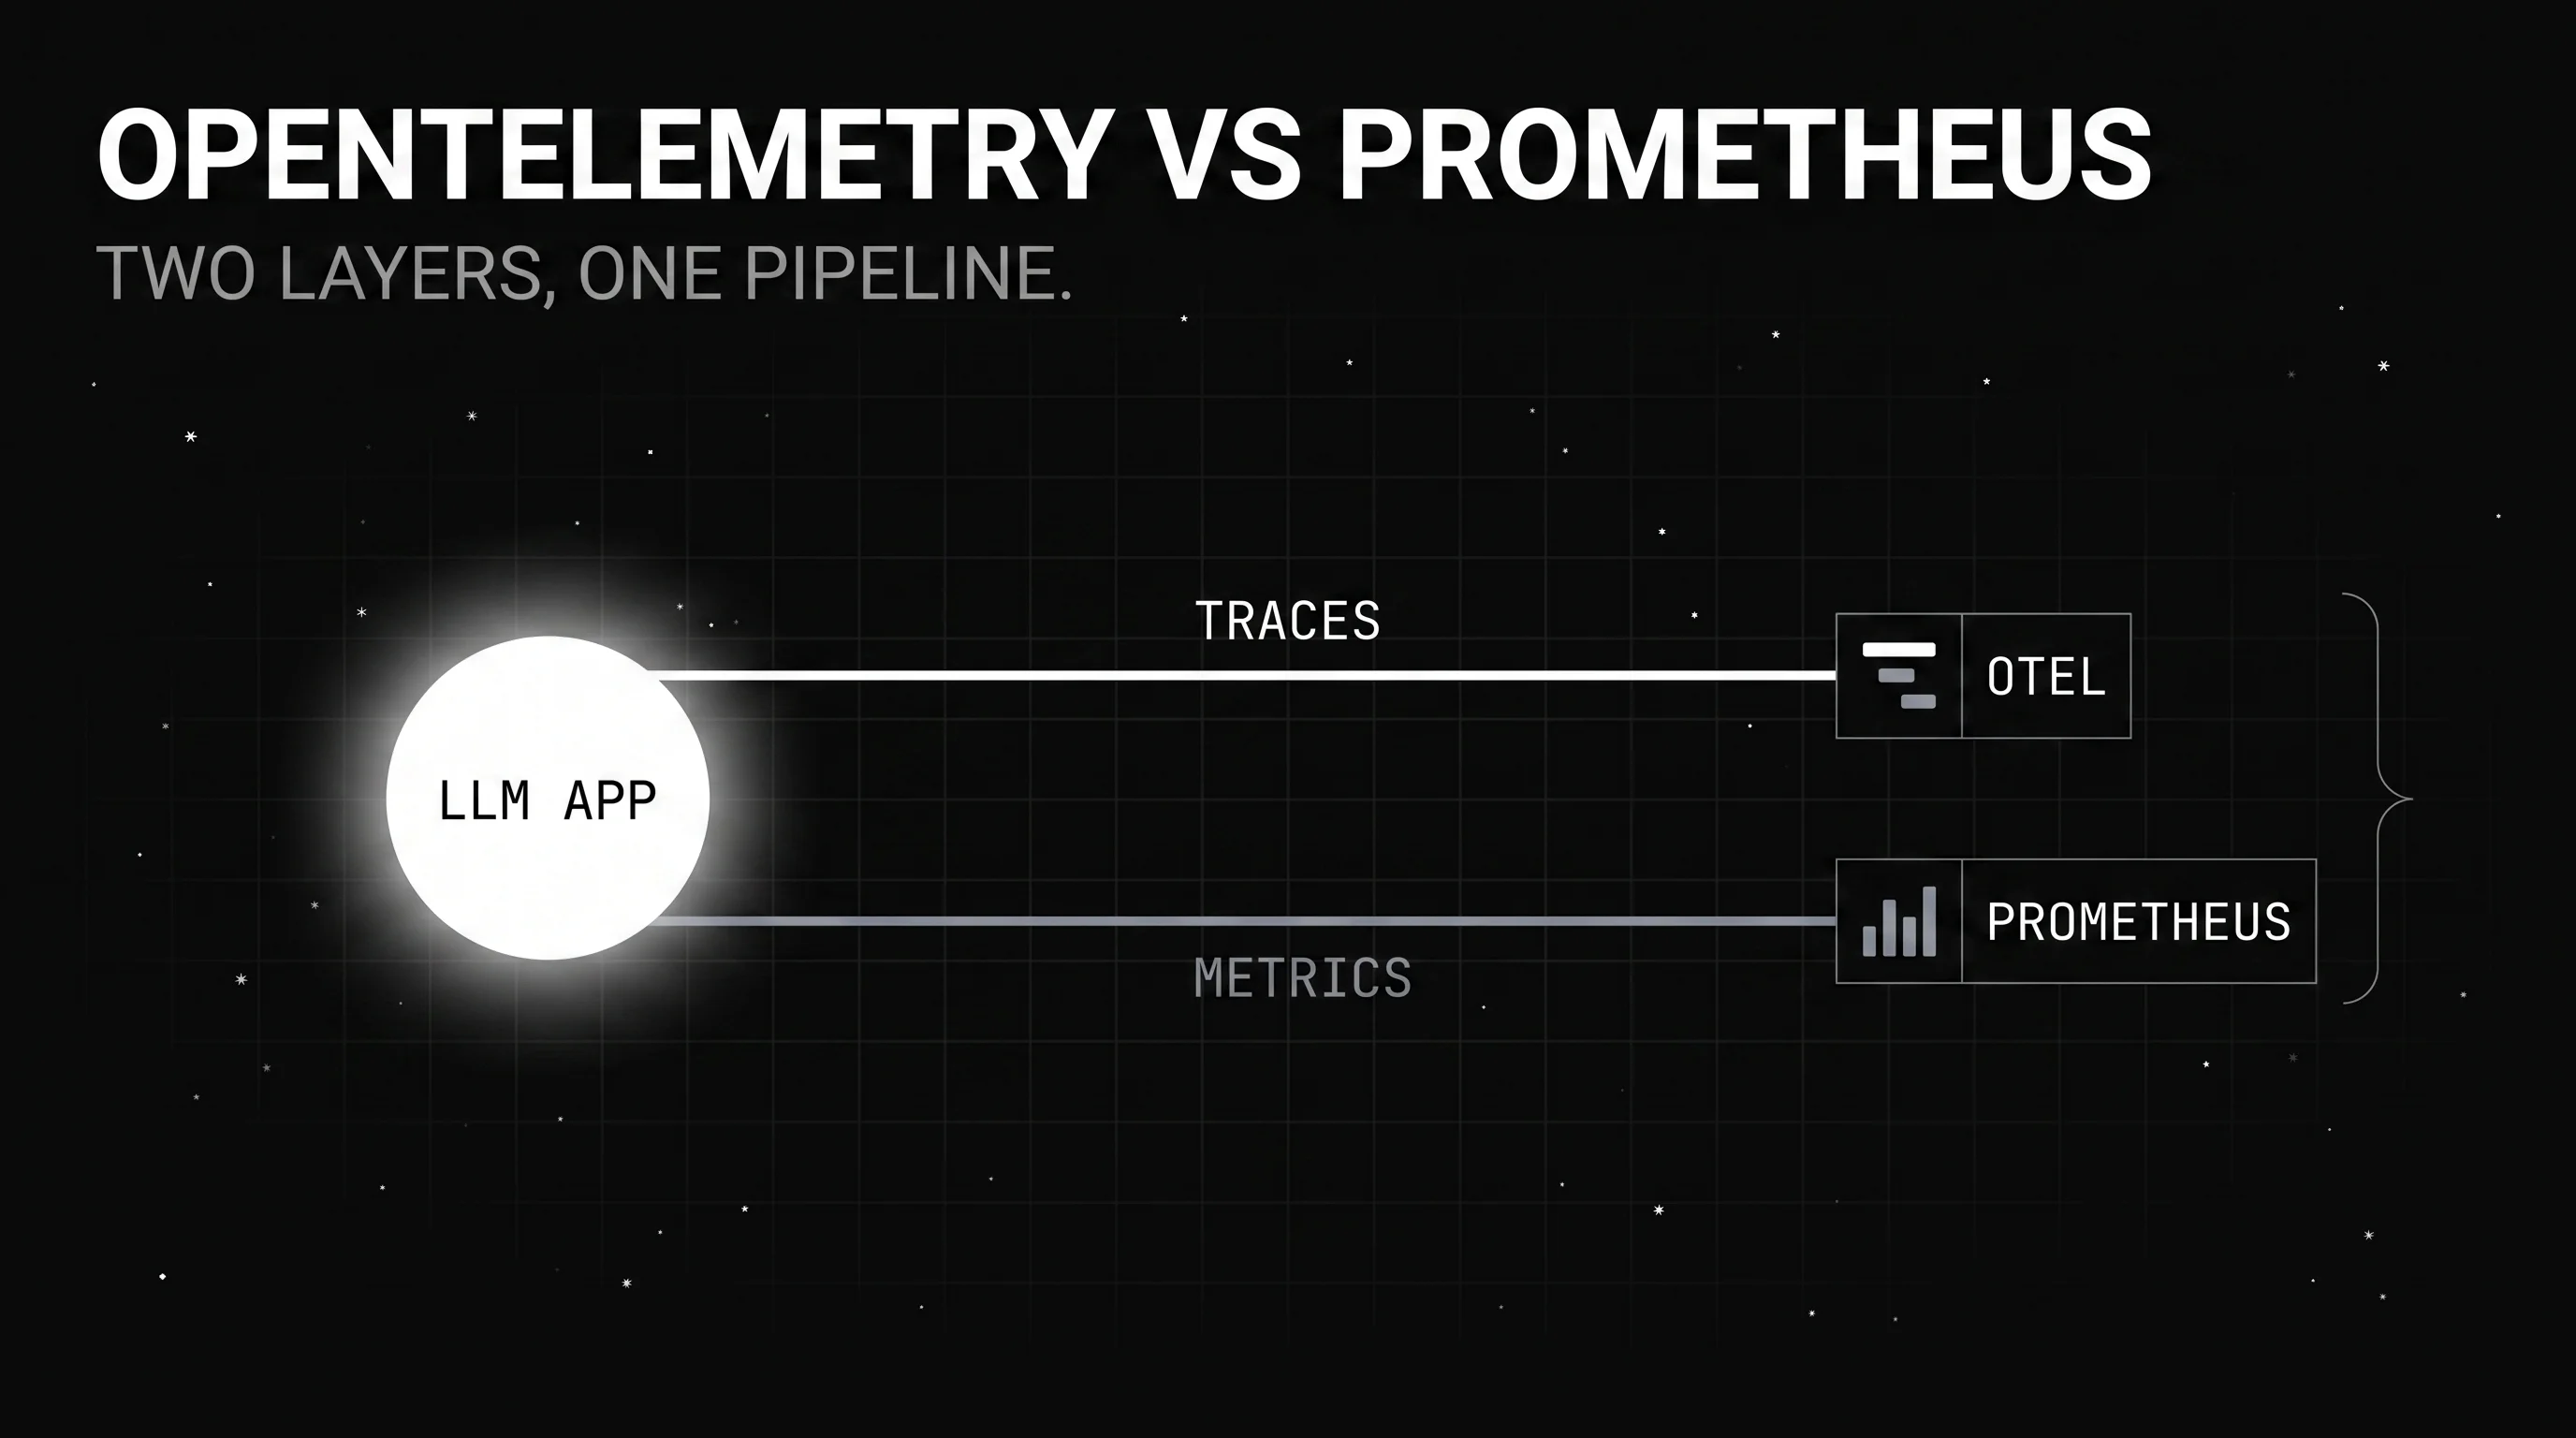
Table of Contents
Your Prometheus dashboard is green. Every endpoint returns 200 OK, p95 latency looks healthy, and yet users keep getting wrong answers from your LLM feature. The metrics never flagged it, because they were never built to see which step went wrong. That gap is what “opentelemetry vs prometheus” is really about.
Engineers keep framing opentelemetry vs prometheus as a fight where one tool wins. For LLM telemetry that framing misses the point. The two operate at different layers, and a production agent stack usually runs both. This guide shows what each does and how they fit together.
OpenTelemetry instruments your code and moves traces and metrics out of it. Prometheus stores metrics and alerts on them. One is a vendor-neutral standard for producing telemetry. The other is a database built to query one signal. Naming a winner is the wrong exercise.
You will see what each tool actually is, why traces and metrics both matter for an LLM app, what the gen_ai semantic conventions add, and how to wire OpenTelemetry and Prometheus into a single stack. By the end you will have a clear telemetry decision.
OpenTelemetry vs Prometheus: What Each Tool Actually Does
In the opentelemetry vs prometheus comparison, OpenTelemetry is a vendor-neutral standard and toolkit for producing traces, metrics, and logs, while Prometheus is a database that stores metrics and alerts on them. One generates and ships telemetry. The other collects and queries a single signal. They sit at different layers of the same stack.
What OpenTelemetry is
OpenTelemetry is a CNCF project that defines how software emits telemetry. It gives you SDKs to instrument code, a specification for traces, metrics, and logs, and a Collector that receives, processes, and forwards that data. It is not a storage backend, and it does not draw dashboards.
The point of OpenTelemetry is portability. You instrument once against an open standard, then send the data to whatever backend you choose. Switch vendors later and your instrumentation stays put. That neutrality is why it became the default for new observability work across the industry.
What Prometheus is
Prometheus is a metrics time-series database with its own query language, PromQL, and a built-in alerting engine. It follows a pull model, scraping numeric metrics from endpoints your services expose. It stores those series efficiently and fires alerts when a threshold breaks. It has run production monitoring for years.
What Prometheus is not matters just as much here. It is not a tracing system, so it has no concept of a request path across services. It is not an instrumentation standard either. It stores one signal, metrics, and it stores that signal very well. The rest of the stack sits elsewhere.
Why OpenTelemetry vs Prometheus Is the Wrong Question
The opentelemetry vs prometheus question is the wrong one, because the two do not compete for the same job. OpenTelemetry produces and transports signals. Prometheus stores and alerts on one of them. Asking which to pick is like asking whether to keep the wiring or the fuse box in a house.
They were also designed to interoperate. The OpenTelemetry Collector ships with a Prometheus receiver that scrapes existing metric endpoints, and a Prometheus remote write exporter that pushes metrics into Prometheus. The data flows between them by design, not through some fragile bridge you have to build and babysit.
So the real decision is not either/or. It is how to compose both into one telemetry pipeline. OpenTelemetry becomes the instrumentation and routing layer for every signal. Prometheus becomes the metrics store and alerting engine underneath it. Each keeps doing the part it was actually built for.
That reframing matters most for LLM apps, where you need more than one signal. A metrics-only view cannot explain a bad answer, and a traces-only view cannot page you at three in the morning. The next sections show why both signals earn their place in an agent’s observability stack.
Traces vs Metrics for LLM Telemetry
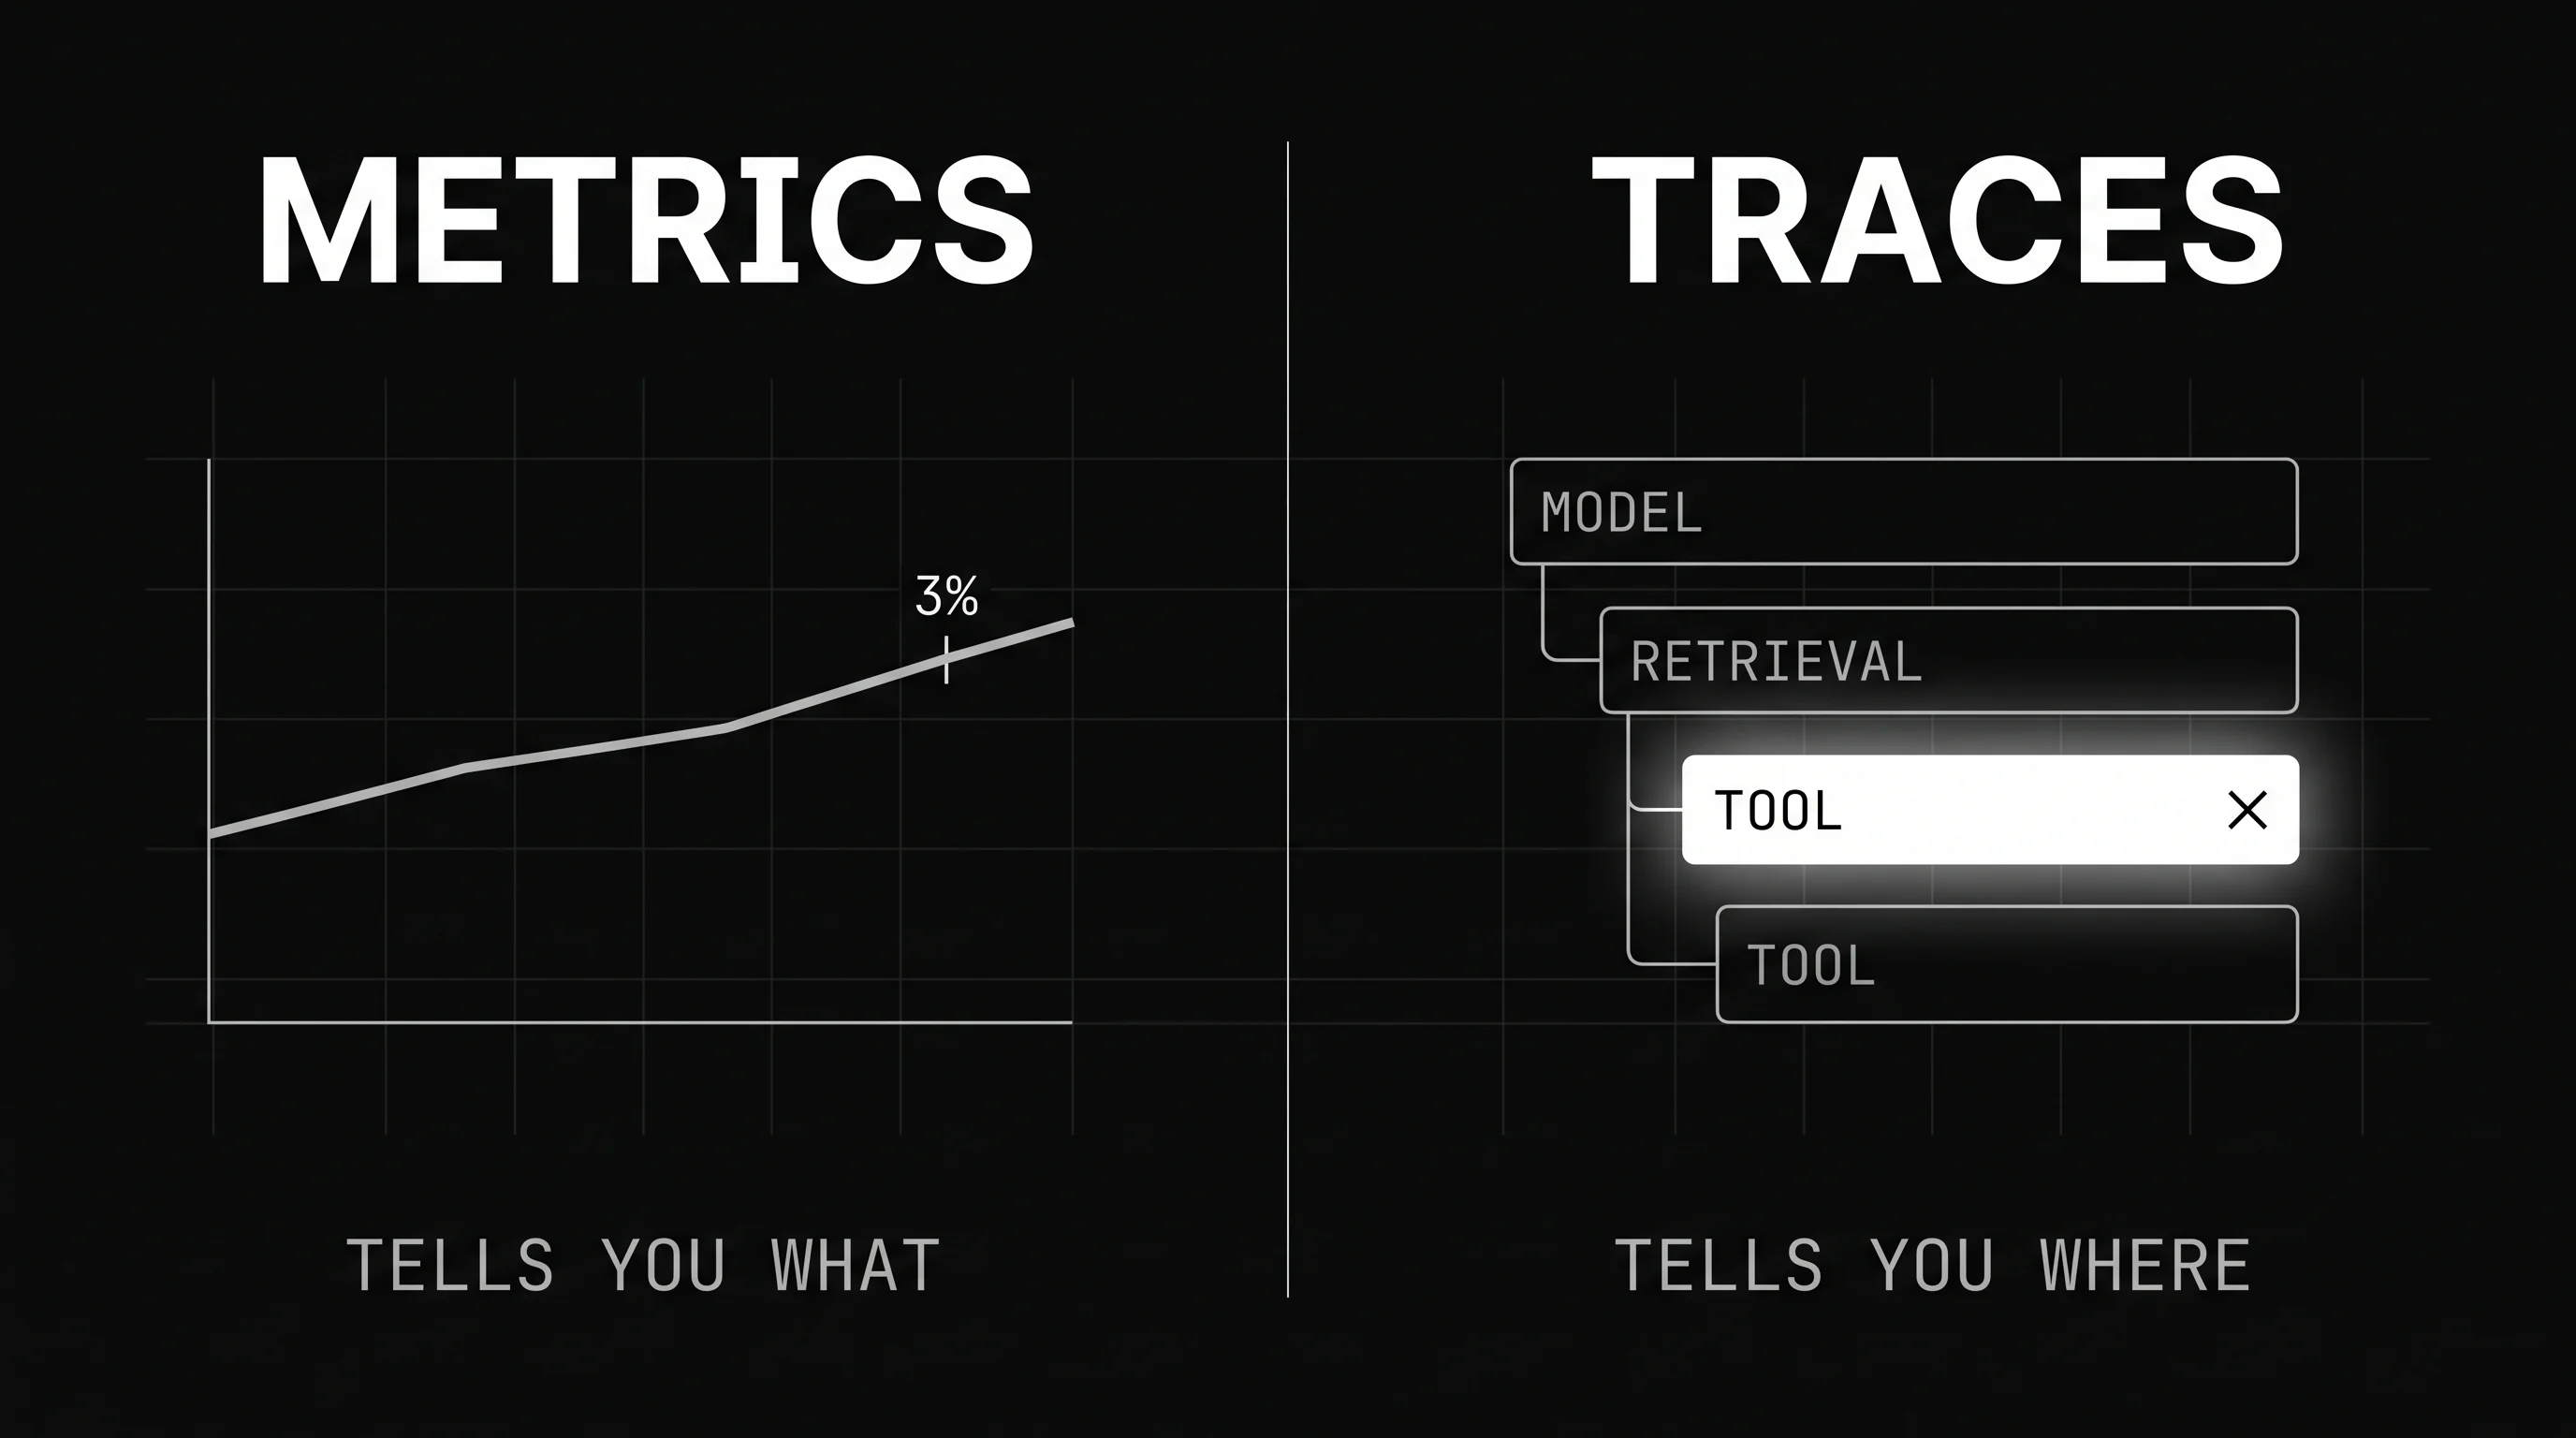
For LLM telemetry, metrics and traces answer different questions, and you need both. Metrics aggregate token usage, cost, latency, and error rate over time, which is Prometheus territory. Traces capture the span waterfall of a single agent run, which is OpenTelemetry territory. One counts what happened, the other explains it.
Here is the difference in one example. A metric tells you the error rate hit three percent this hour. A trace tells you the order-lookup tool returned stale data on step three of a specific run. The metric raises the alarm. The trace tells you exactly where to go and look.
What metrics tell you
Metrics are aggregates. They roll many requests into rates and totals you can chart and alert on: tokens per minute, cost per model, p95 latency, error percentage. They are cheap to store and quick to query, which makes them ideal for dashboards and thresholds. Their structural limit is causation.
A metric can tell you that something changed, but not why. It flattens every request into a number, so the one bad run disappears into the average. For a health check that trade is fine. For debugging why an agent gave a wrong answer, it is not enough on its own.
What traces tell you
A trace keeps the shape of a single request. For an agent it records each step as a span: the model call, the retrieval, every tool call, and the timing and result of each one. When a run goes wrong, the trace shows the exact step that failed and what it returned to the model.
That per-request, causal view is what LLM debugging needs, because agent failures hide inside one step of a long chain. For a deeper walkthrough of span design, see our guide to LLM tracing best practices. Metrics point at the fire, and traces show you the room it started in.
Why Prometheus Alone Falls Short for LLM Observability
Prometheus alone falls short for LLM observability because it stores only metrics, and metrics cannot describe an agent’s path. Prometheus has no parent-child span model, so it cannot show that a run went model, retrieval, tool, tool, then a wrong answer. It sees the totals and never the story behind them.
Cardinality is the next wall. Prometheus struggles when a label carries many distinct values, and LLM telemetry is full of them: model, provider, user, prompt version, tool name. Combine those and the series count explodes, which strains storage and slows queries. High-cardinality context is exactly what agent debugging depends on.
There is no semantic structure for LLM data either. Prometheus has no notion of a gen_ai attribute, a prompt, or a response body. It cannot hold the text of what the model saw and produced, which is the first thing you want when an answer is wrong but the underlying request technically succeeded.
None of this makes Prometheus useless for agents. It stays excellent at the metrics half of LLM observability, such as cost and latency alerts. It just cannot be the whole stack, because the questions agents raise are causal, and causation lives in traces rather than counters.
OpenTelemetry GenAI Semantic Conventions for LLM Telemetry
OpenTelemetry defines a set of GenAI semantic conventions, a shared vocabulary for LLM telemetry so the same attributes mean the same thing across tools. They cover the model call, token usage, latency, and agent steps. Adopt them and your traces stay portable across any backend that understands OpenTelemetry.
On the attribute side, the conventions standardize fields like gen_ai.request.model for the model called, gen_ai.usage.input_tokens and gen_ai.usage.output_tokens for token counts, and gen_ai.response.finish_reasons for why generation stopped. These turn a raw LLM call into structured, queryable telemetry instead of an opaque HTTP request.
On the metric side, two histograms carry the load: gen_ai.client.operation.duration for call latency and gen_ai.client.token.usage for token consumption. The conventions also define standard operations, invoke_agent, chat, and execute_tool, each emitted as a span named after the operation and its target, such as chat {model}. Together they map an agent’s work.
The payoff is portability. Because the names are standardized, a trace produced by one library can be read by any OpenTelemetry backend without custom parsing. You can switch observability vendors, or send the same telemetry to two of them at once, without re-instrumenting your agent. The vocabulary travels with the data.
| Signal | What it captures | Type |
|---|---|---|
gen_ai.request.model | The model the request targeted | Attribute |
gen_ai.usage.input_tokens / output_tokens | Prompt and completion token counts | Attribute |
gen_ai.response.finish_reasons | Why the model stopped generating | Attribute |
gen_ai.client.operation.duration | Latency of the model call | Metric (histogram) |
gen_ai.client.token.usage | Token consumption by type | Metric (histogram) |
invoke_agent, chat, execute_tool | Agent run, model call, and tool step | Operation (gen_ai.operation.name) |
One honest caveat before you build on them. As of 2026 these GenAI conventions are still under active development, not yet stable, and they now live in a dedicated OpenTelemetry GenAI semantic conventions repository. Attribute names can still shift between versions. Pin your instrumentation versions and plan to update them as the standard settles.
How OpenTelemetry and Prometheus Work Together for LLM Metrics
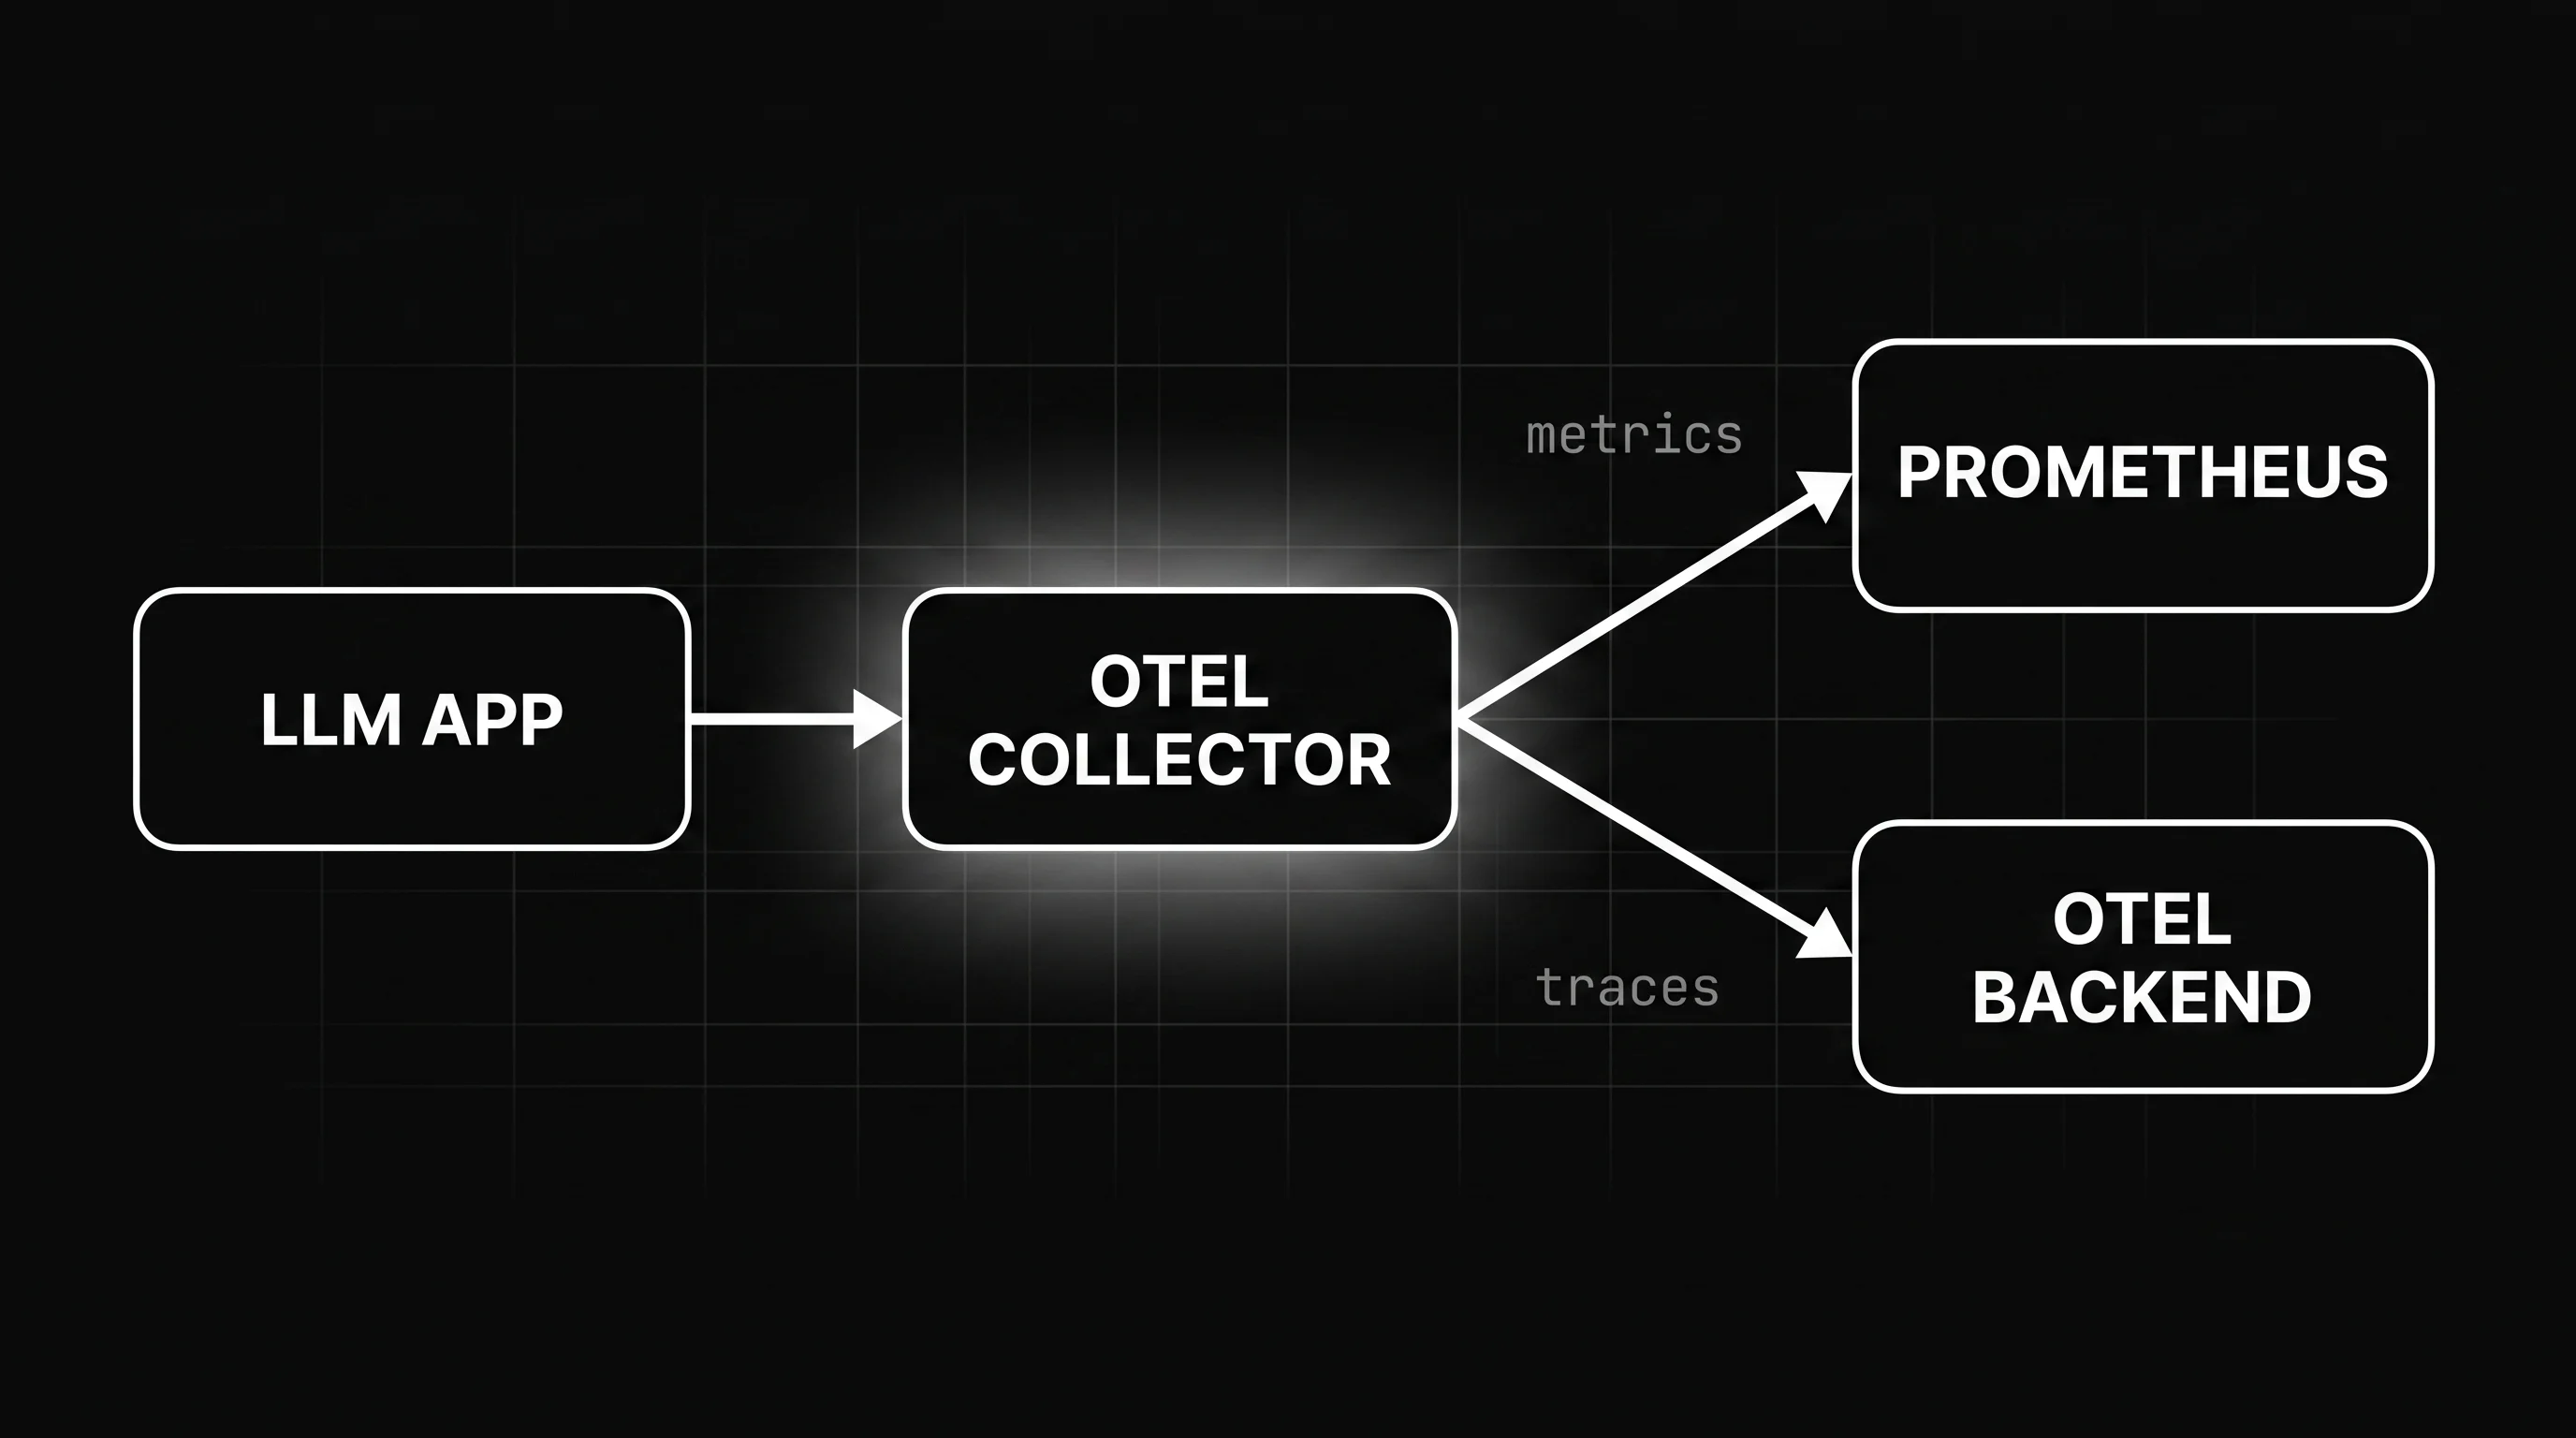
In practice OpenTelemetry and Prometheus work together as one pipeline. OpenTelemetry instruments the model call and emits gen_ai.client.token.usage. The Collector exports those metrics to Prometheus. Prometheus stores the time series, and PromQL plus Grafana turn them into cost-per-model dashboards and alerts, while traces flow in parallel to a tracing backend.
The OTel Collector as the bridge
The OpenTelemetry Collector is the piece that joins the two. Its Prometheus receiver scrapes any metric endpoint you already expose, pulling existing numbers into the pipeline. Its Prometheus remote write exporter pushes OpenTelemetry metrics the other way, into Prometheus for storage. The Collector speaks both dialects so you do not have to pick one.
A minimal Collector config that scrapes a metric endpoint and remote-writes to Prometheus looks like this:
receivers:
  prometheus:
    config:
      scrape_configs:
        - job_name: llm-app
          static_configs:
            - targets: ["localhost:8000"]  # app or vLLM /metrics
exporters:
  prometheusremotewrite:
    endpoint: "http://prometheus:9090/api/v1/write"  # needs --web.enable-remote-write-receiver
service:
  pipelines:
    metrics:
      receivers: [prometheus]
      exporters: [prometheusremotewrite]
That means you can add a full OpenTelemetry setup for LLM apps without ripping out the Prometheus stack you already run. New gen_ai metrics land beside your infrastructure metrics in the same database, queried with the same PromQL your team already knows and trusts today.
A self-hosted inference example
A self-hosted setup makes it concrete. vLLM, a common inference server, natively exposes a Prometheus-compatible /metrics endpoint with token counters and latency histograms. The Collector scrapes that endpoint for the serving metrics, while OpenTelemetry traces the request path through your application. One run produces both the metric and the trace.
Now the two signals line up. Prometheus alerts when cost per model drifts above budget, and the matching trace shows the exact request that drove it. For a wider survey of tools in this space, see the best LLM monitoring tools roundup and where each one fits.
The division of labor stays clean throughout. OpenTelemetry owns producing and routing every signal. Prometheus owns storing and alerting on the metrics. Neither reaches into the other’s job, which is exactly why the combination keeps holding up as your agent traffic grows.
Which LLM Telemetry Stack Should You Choose?
So which LLM telemetry stack should you choose? Start from what you need to see, not from a preference in opentelemetry vs prometheus. If you need to trace agent reasoning, you need OpenTelemetry. If you need to alert on cost over time, you need Prometheus storing OpenTelemetry metrics. Most teams need both.
The pattern holds across cases. Anything causal and per-request lives in traces, which is OpenTelemetry. Anything aggregate and threshold-based lives in metrics, which is Prometheus. Prompts and eval scores need OpenTelemetry events and logs, because Prometheus cannot model that kind of content at all.
| You need to… | Use | Why |
|---|---|---|
| Trace agent reasoning chains | OpenTelemetry | Prometheus has no span model |
| Alert on token cost over time | OpenTelemetry metrics in Prometheus | Aggregates and thresholds are Prometheus strengths |
| Add LLM telemetry to an existing Prometheus stack | OpenTelemetry instrument plus remote write | Reuses the store you already run |
| Capture prompts and eval scores | OpenTelemetry events and logs | Prometheus cannot model this content |
Read the table as a map from need to tool. The opentelemetry vs prometheus decision almost never ends with a single winner. It ends with OpenTelemetry as the instrumentation layer and Prometheus as the metrics store, each chosen for the questions only it can answer for you.
LLM Telemetry with Future AGI’s traceAI
Once you commit to the OpenTelemetry half of this stack, you need a library that speaks it fluently for LLM work. Future AGI’s traceAI is exactly that: an open-source, OpenTelemetry-native tracing framework for AI applications. It instruments your agent and emits structured traces in the OpenTelemetry format you already plan to use.
The detail that fits this post is where those traces go. traceAI exports OTLP traces to any OpenTelemetry-compatible backend, including Future AGI’s own Observe, so it plugs into the pipeline you already run rather than forcing a new vendor. It is the OpenTelemetry-native instrumentation half of the OpenTelemetry-plus-Prometheus architecture described above.
In practice it captures the calls that matter for LLM telemetry: model calls, prompts, token usage, retrievals, and each tool step across an agent run. It offers near zero-config instrumentation for popular agent frameworks like LangChain, LlamaIndex, and CrewAI, so you get standards-based traces without hand-writing spans around every call yourself.
Because the output is plain OpenTelemetry, it stays portable. The same traces can feed your tracing backend while gen_ai metrics feed Prometheus, all from one instrumentation layer. For the broader category, see our roundup of the best LLM tracing tools and how they compare.
OpenTelemetry and Prometheus Belong Together
Here is the takeaway. OpenTelemetry and Prometheus are not rivals fighting for one slot. OpenTelemetry produces traces and gen_ai metrics from your LLM app. Prometheus stores and alerts on the metrics. The moment you run an agent in production, you want both signals, not a winner between them.
Go back to the green dashboard hiding a broken step. With traces in the pipeline, that silent failure stops being invisible: the metric still reads healthy, but the span waterfall shows the tool call that returned stale data. The decision was never which tool to keep. It was both, composed well.
That composed stack starts with OpenTelemetry-native instrumentation, and Future AGI’s traceAI is built to give teams their LLM traces in an open, portable format from the very first model call. It is a practical place to begin the OpenTelemetry half of the pipeline.
Frequently Asked Questions
Is OpenTelemetry better than Prometheus?
Can Prometheus monitor LLM token usage?
Do I need both OpenTelemetry and Prometheus?
What are OpenTelemetry GenAI semantic conventions?
Does Prometheus support distributed tracing?
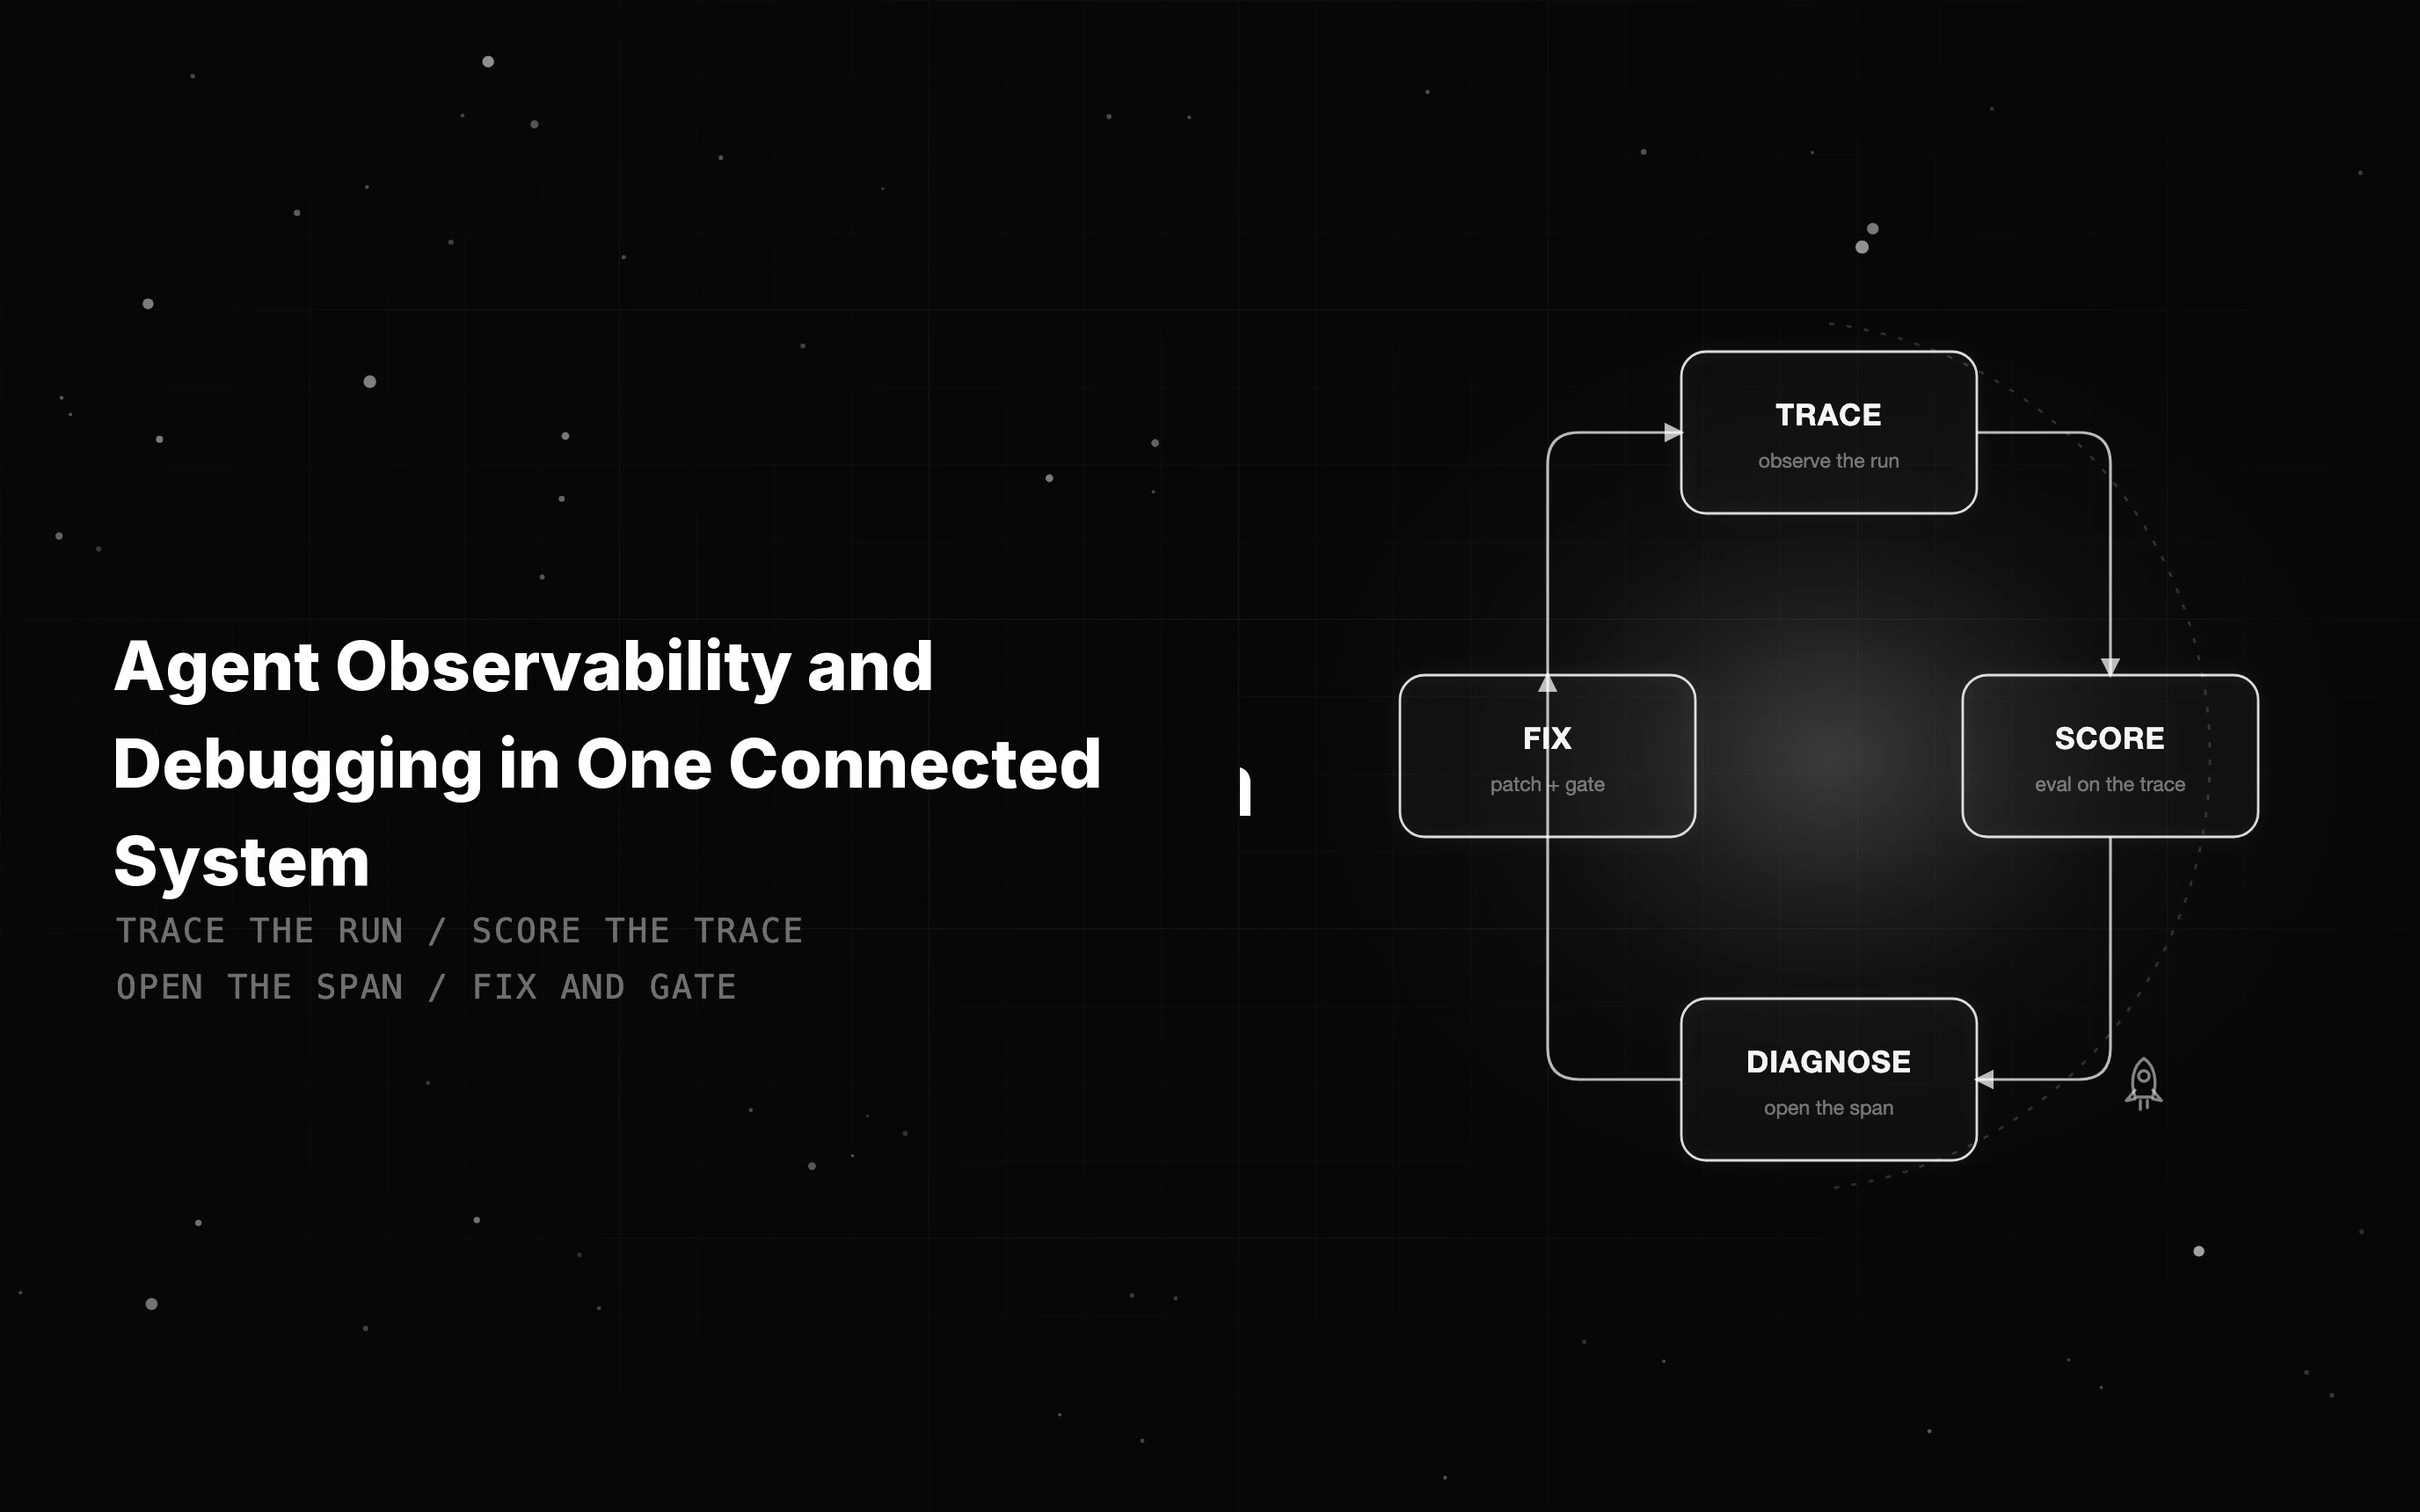
Agent observability shows what an agent did; debugging fixes it. See what to instrument and how tracing, evals, and fixes meet on one trace to close the gap.

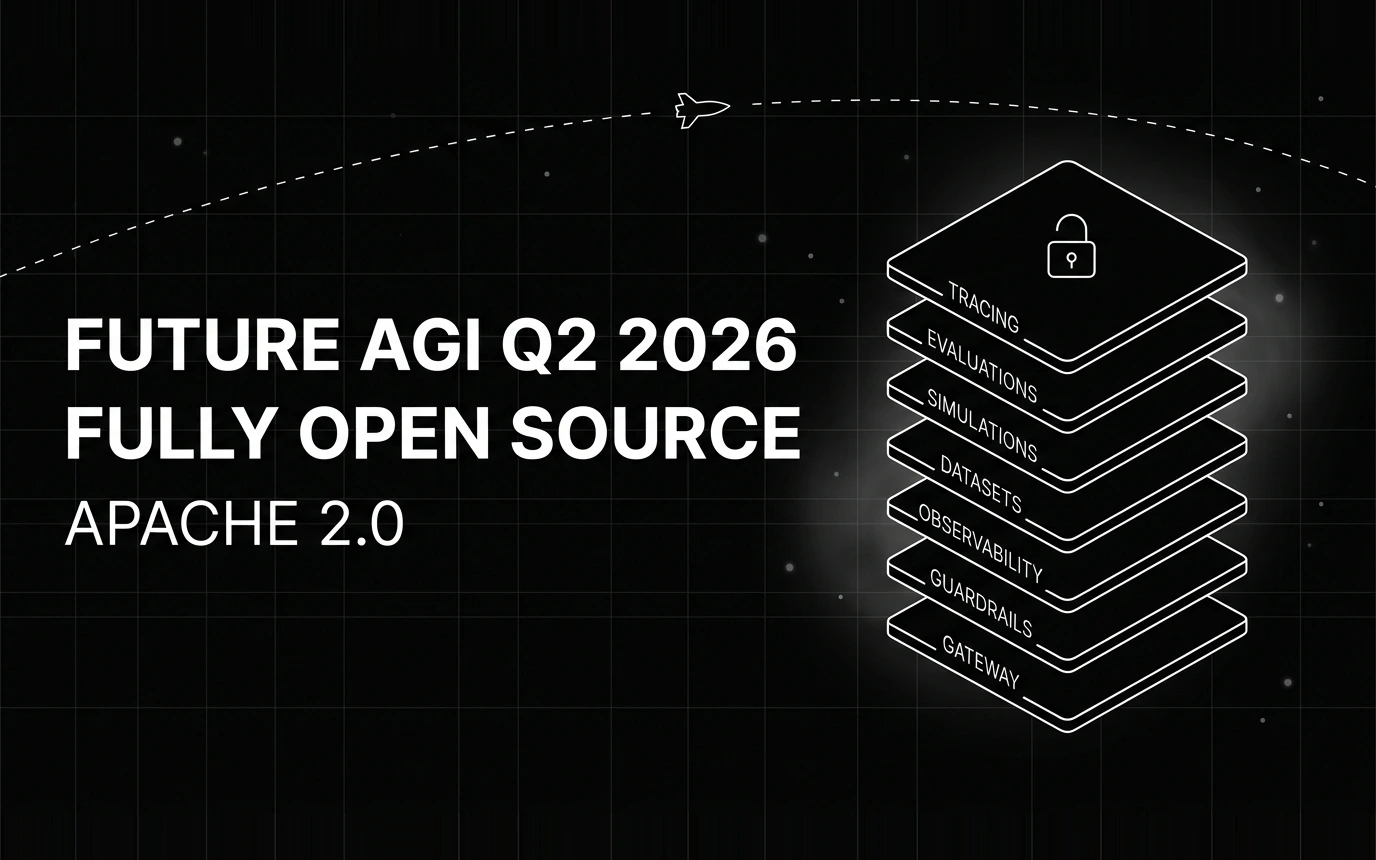
Inside Future AGI open source in Q2 2026: the platform shipped under Apache 2.0, Error Feed and the Agent Command Center went live, traces hit billions.

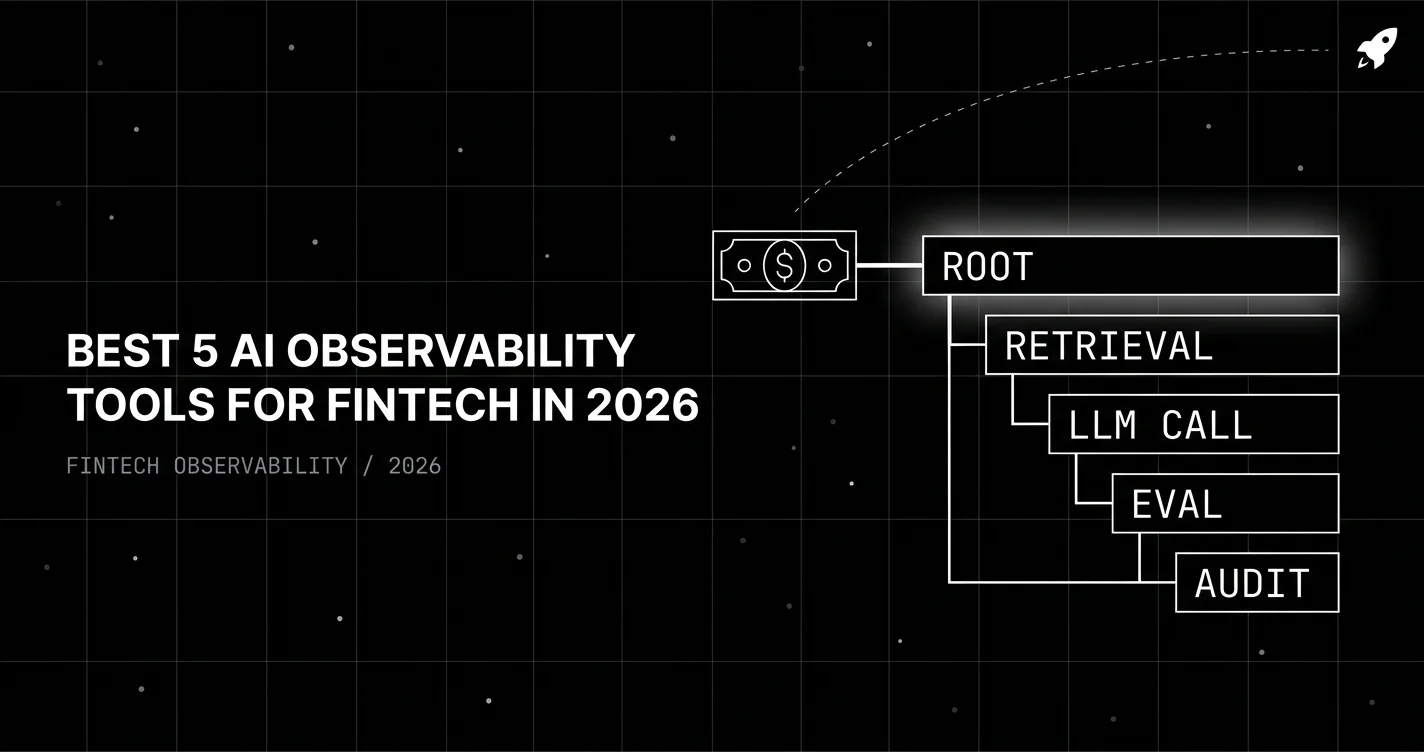
Five fintech AI observability platforms scored on per-decision spans, immutable audit, SOC 2 + PCI-DSS, FFIEC / SR 11-7 model risk, EU DORA alignment.