Agent Observability: From Production Traces to Regression Evals
Agent observability captures what happened, but traces alone never improve an agent. Here is how to close the feedback loop from traces to agent learning.
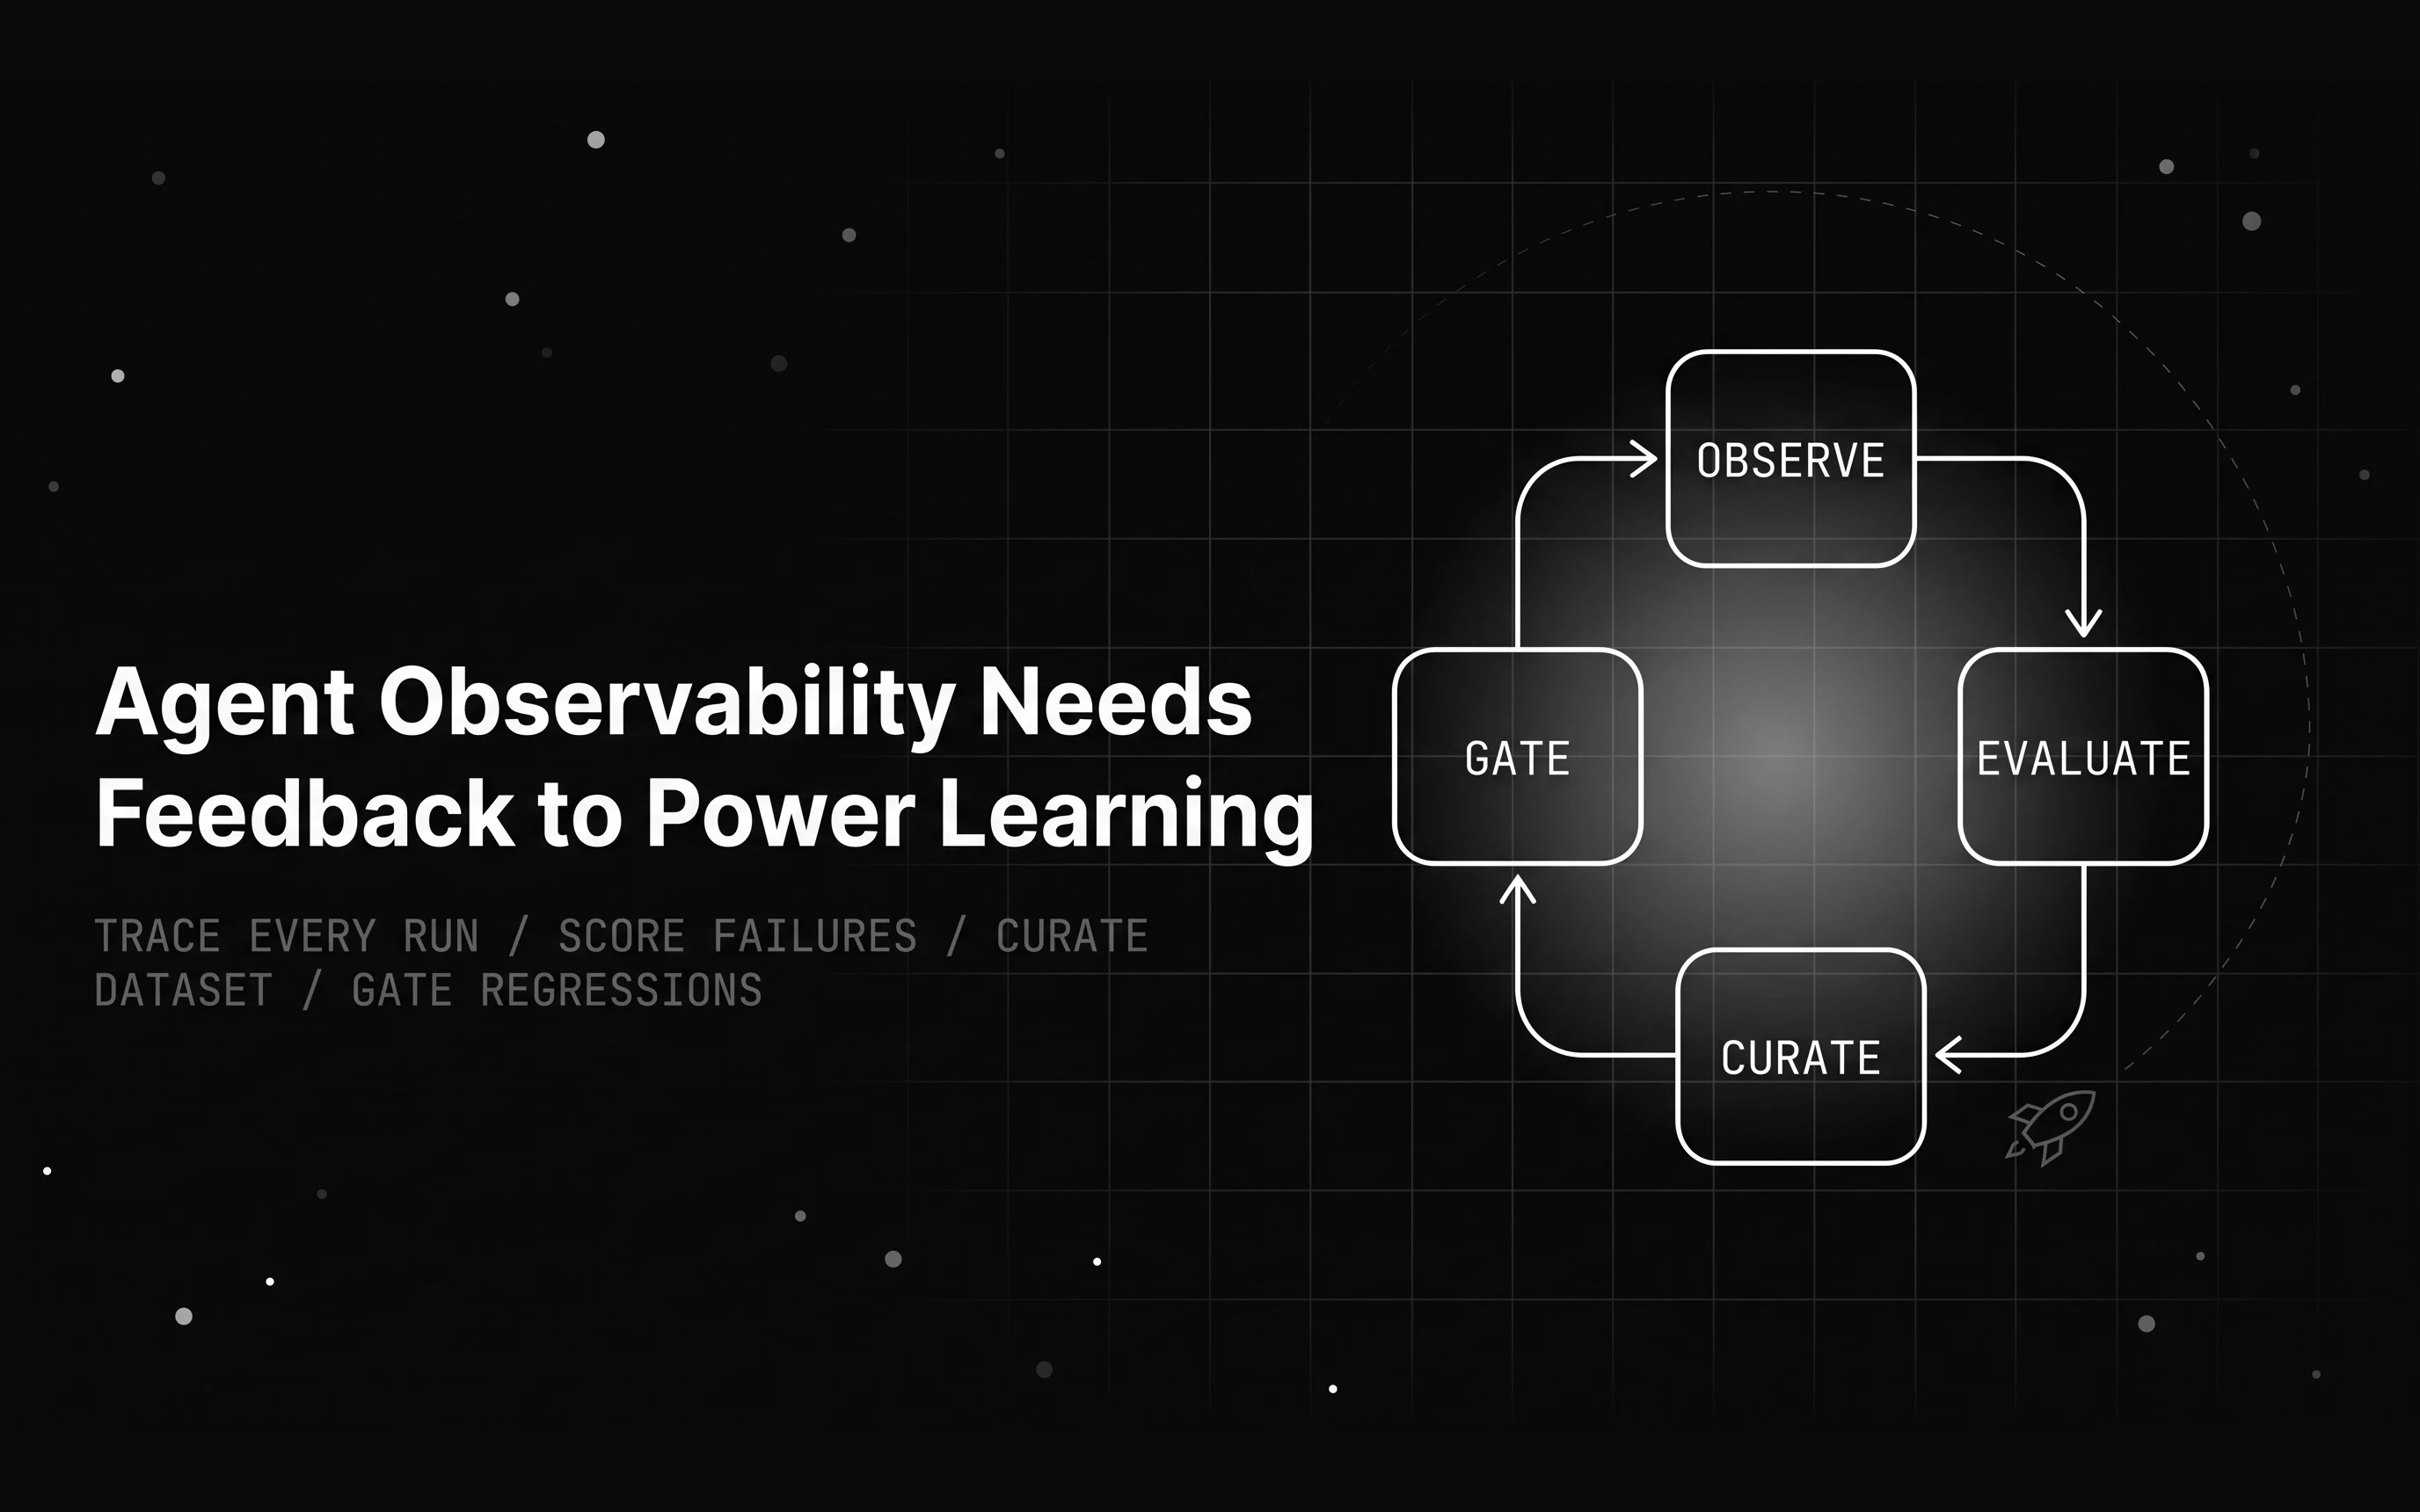
Table of Contents
Your agent dashboard is all green. Latency is fine, the error rate is near zero, every request returned a 200. And yet the support queue is filling up, because green measures whether the agent answered, not whether it was right.
Agent observability is how you see what an AI agent did on each request: which model calls it made, which tools it invoked, what it retrieved, and in what order.
Teams have gotten good at capturing this. The traces land in a dashboard, the spans are searchable, and when something breaks you open the run and read it step by step.
The part almost nobody finishes is what happens next. A trace records what happened. It does not record whether what happened was any good, and it does not fix anything on its own.
Observability that stops at capture is storage with a nicer interface. The agent that shipped the wrong answer yesterday ships the same wrong answer tomorrow, because nothing carried that failure back into how the agent is built.
The missing half is the feedback loop: the machinery that turns a production trace into an eval case, a dataset, and a regression gate, so observing a failure once is what stops it from recurring.
TL;DR
- Agent observability captures what an agent did on each request as traces and spans. It does not tell you whether the answer was good.
- A wrong answer still returns a 200, so operational dashboards stay green while output quality drops.
- The fix is a feedback loop: observe, evaluate, catch the failures, curate a dataset, improve the agent, and gate the next deploy on a regression check.
- Score each trace, route representative failures into a labeled dataset, and re-run that dataset in CI to reduce the chance that the same failure reaches users again.
- Track two numbers to know the loop is real: loop yield (failures that became eval cases) and regression-gate pass rate.
What Agent Observability Is, and What It Misses
Agent observability starts with traces and spans. Every time your agent handles a request it makes a sequence of moves: it calls a model, maybe calls it again after reading a tool result, hits a retriever, and returns an answer.
Each move is a span, and the ordered set of spans for one request is a trace. Good instrumentation captures all of it for you, so you reconstruct the exact path the agent took without scattering print statements through the code.
This is the foundation that LLM observability tools have standardized over the last two years, and most teams now have it running.
A span is more than a timestamp. Done well, it carries the model name, the exact prompt and response, token counts, the arguments passed to each tool, and the documents a retriever returned. Those attributes are what make a trace worth keeping, because the score you attach later has to read them.
A span that records only “model call, 800ms” tells you the agent was slow. A span that records the prompt, the retrieved context, and the final answer tells you the agent was wrong, and hands an evaluator something concrete to grade. Structured spans are what make automated scoring possible.
What that buys you is visibility into behavior. You see that the agent retrieved the wrong document, looped on a tool three times, or spent nine seconds waiting on an API.
When a user reports a bad answer, you open the trace and read what the agent did at each step. That beats staring at a single input and output with no idea what happened in between.
Monitoring versus observability
The distinction that trips people up is observability versus monitoring. Monitoring answers operational questions: is the service up, how fast is it, what is the error rate. Those are the classic dashboard numbers, and you need them.
Observability answers a different question: given one specific request, why did the agent do what it did. Monitoring tells you the agent responded in 800 milliseconds with a 200 status. Observability tells you it responded by retrieving a stale document and summarizing it wrong with full confidence.
The gap between those two sentences is where most agent quality problems live, and monitoring alone will not surface it.
Why Traces Alone Do Not Improve an Agent
A trace records what happened. It does not record whether what happened was good. The span for a model call captures the prompt, the response, the token count, and the latency.
Nothing in that span knows the response was factually wrong, missed the user’s real question, or invented a policy that does not exist. The trace is a faithful recording of a mistake, filed next to a thousand correct runs, with no label telling them apart.
This is why agents fail silently in production. A wrong answer still returns a 200. It still completes in normal latency. It still produces a full, well-formed trace.
Every operational metric stays green while the quality of the output degrades, because none of those metrics look at the content of the answer. You can have complete traces on every request, searchable spans, clean waterfall views, and still not know that one in twenty answers is wrong.
The dashboard cannot tell you, because you never asked it to judge the answer, only to record it.
The missing ingredient is evaluation. Observability captures the run; evaluation decides whether the run was good. Until you attach a score to a trace, that trace is inert: it sits in storage, it is searchable, and it improves nothing.
The moment you attach a judgment, the trace becomes a signal you can act on. That single step, from recording to scoring, is the hinge the whole feedback loop turns on.
The Observability Feedback Loop, Step by Step
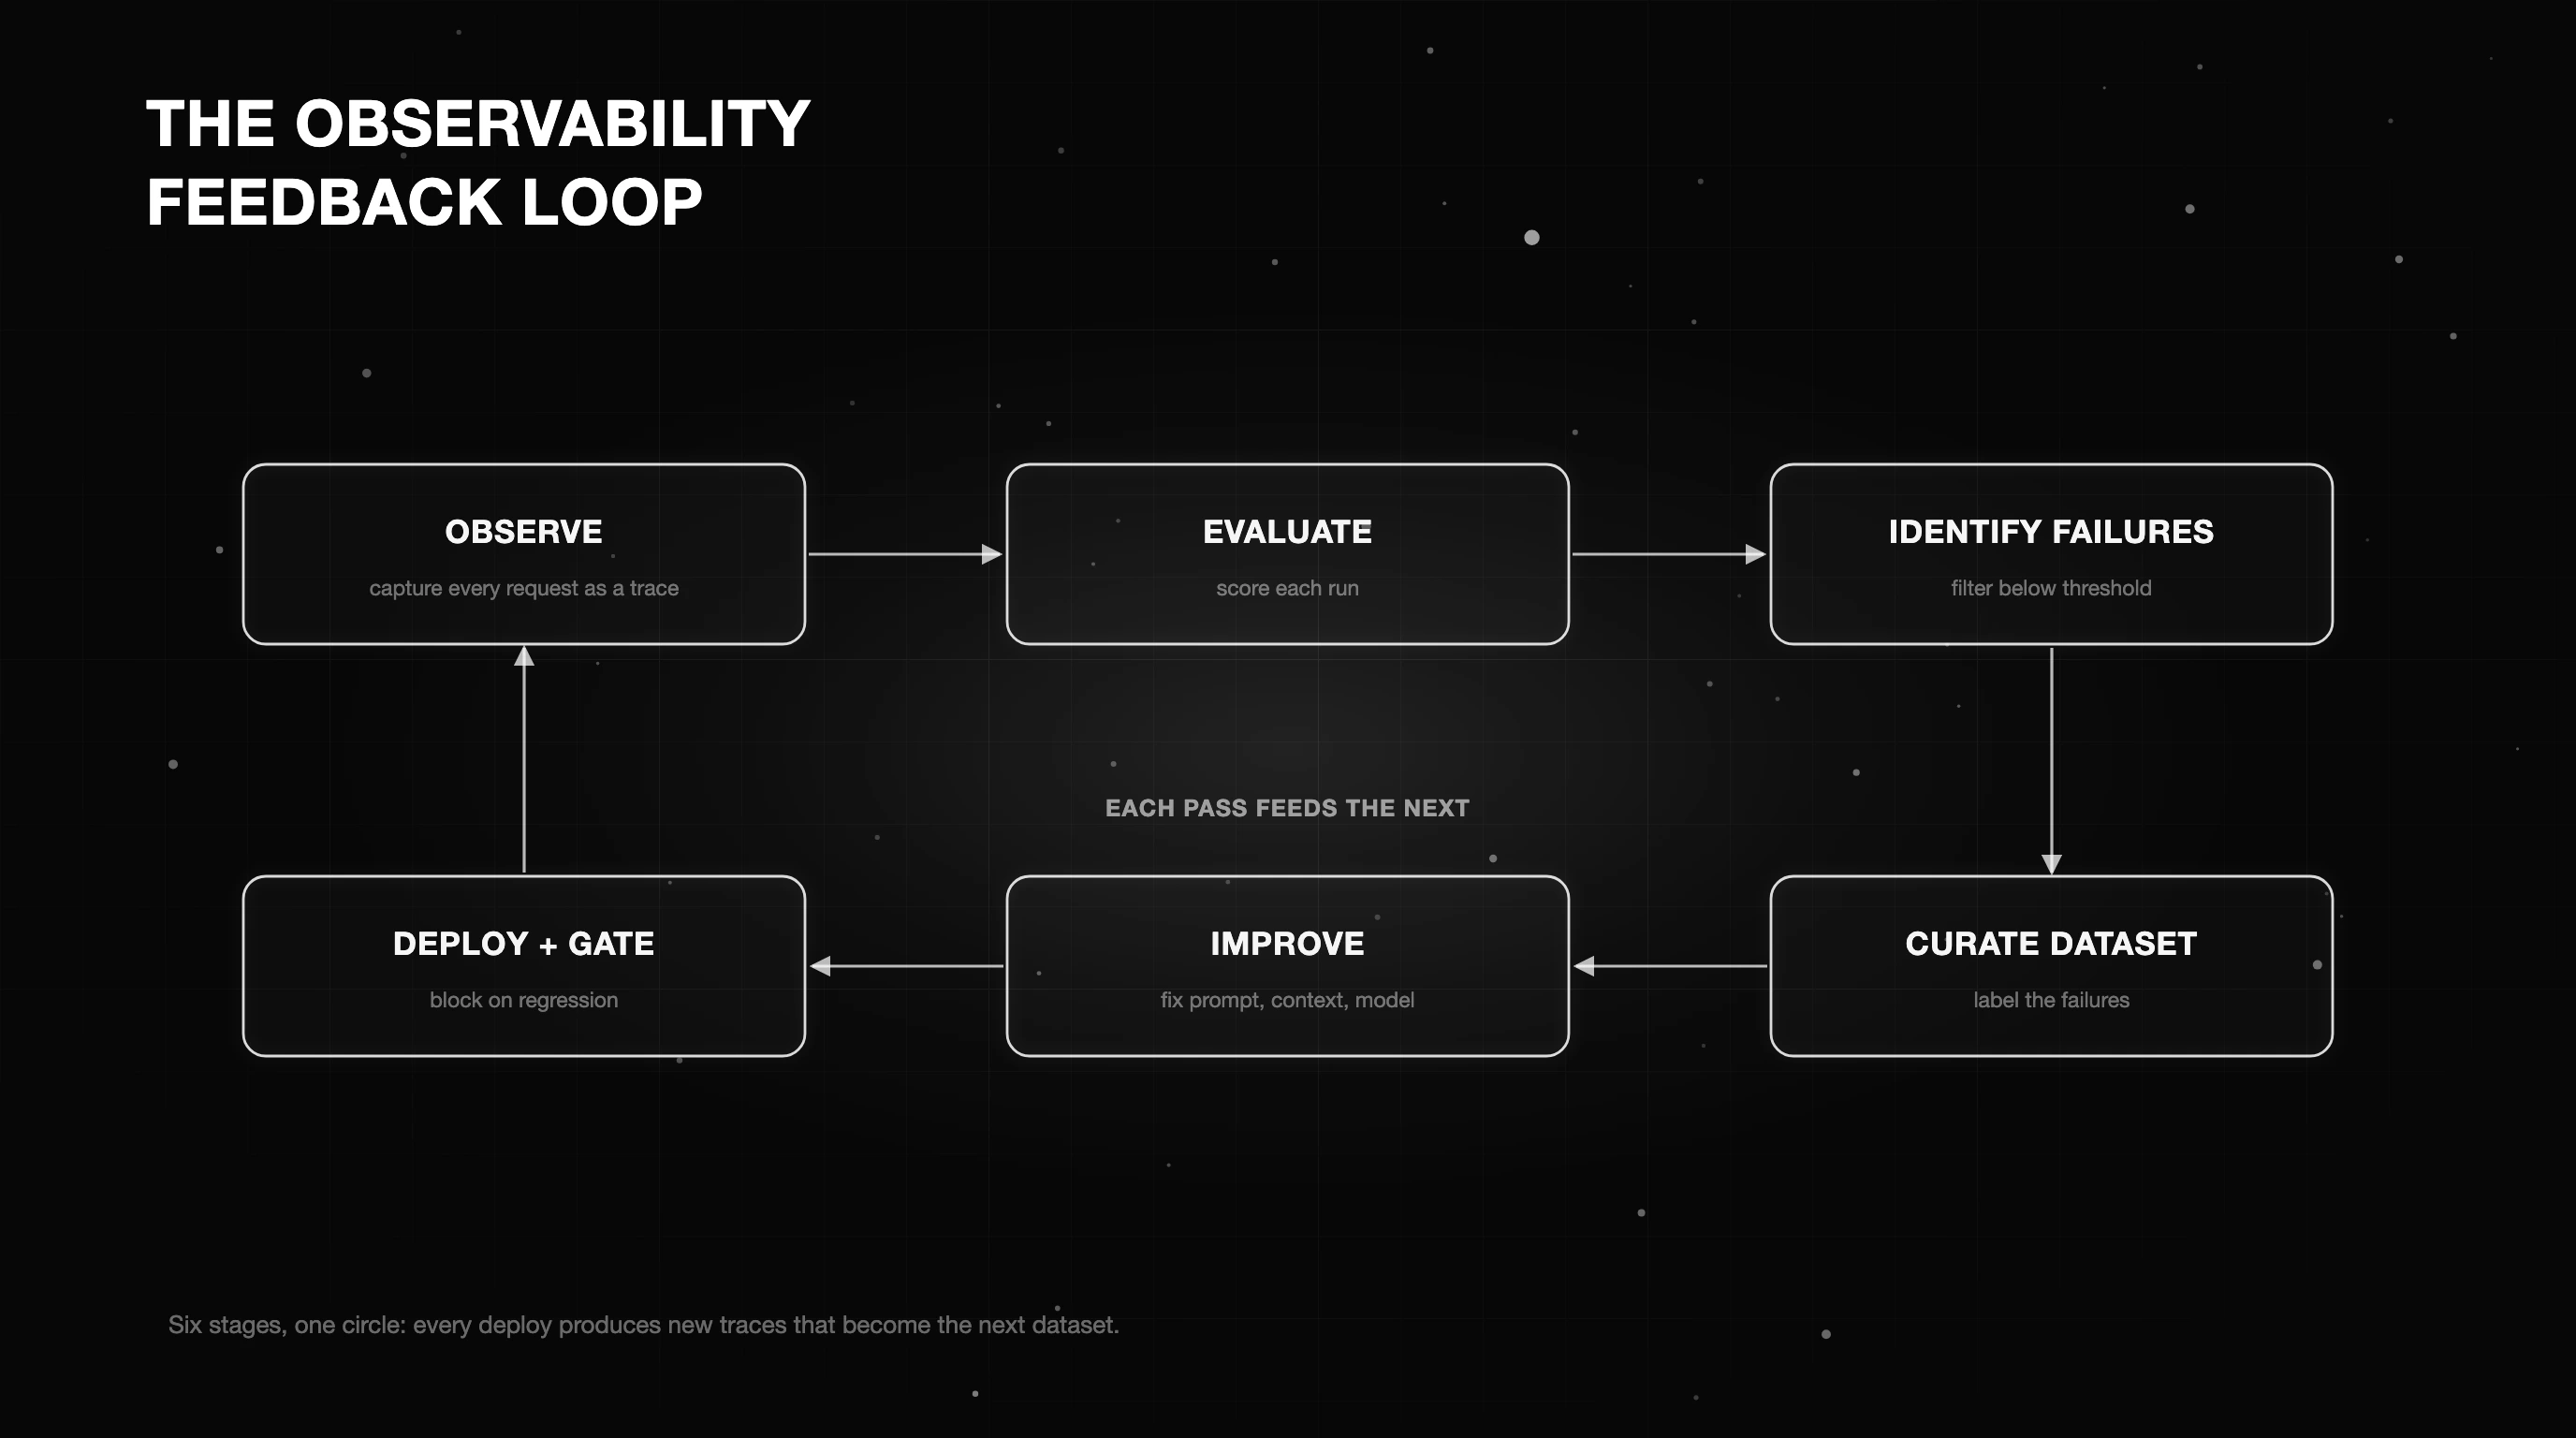
A feedback loop is what connects observation to improvement. The pattern has six stages, and each one hands its output to the next.
This eval feedback loop design guide walks the design tradeoffs behind each stage: the thresholds, the dataset schema, and the gate policy. The stages below are the shape of the loop.
- Observe. Capture every request as a trace, with spans for model calls, tool calls, and retrievals.
- Evaluate. Score each trace against a rubric, a rule, or an LLM judge, so every run gets a quality label.
- Identify failures. Filter for traces that scored below your threshold. These are the runs worth learning from.
- Curate a dataset. Turn those failing traces into labeled eval cases, each with the input, the output, and why it failed.
- Improve. Use that dataset to fix the agent: sharpen the prompt, repair the context, adjust the harness, or change the model.
- Deploy with regression gates. Re-run the dataset on every change and block the deploy if the pass rate drops.
The loop is a circle, not a line. Step six feeds back into step one: the fixed agent produces new traces, some of which fail in new ways, and those become the next dataset.
This is the machinery that makes an agent get measurably better over time instead of drifting. Table A shows how each raw signal enters the loop and what improvement it tends to drive.
| Signal | Capture method | Becomes an eval case? | Improvement it drives |
|---|---|---|---|
| Trace or span | OpenTelemetry span via a traceAI instrumentor | Yes, once scored below threshold | Prompt or context |
| LLM-judge score | An eval judge run on the span output | Yes, the score is the label | Prompt or model |
| Deterministic rule | An assertion on the output (schema, regex, tool exit code) | Yes, a hard fail | Harness or tool wiring |
| Human annotation | A reviewer in an annotation queue | Yes, a gold label | Dataset ground truth |
| Implicit signal | A product event (edit accepted, ticket reopened) | Sometimes, after mapping | Context or retrieval |
Step six is the one teams skip, so it is worth being precise about. A regression gate is not “run the tests and read the results.” It is a check that fails the build when the pass rate on your curated dataset drops below a threshold you set.
That works the same way a failing unit test blocks a merge. The threshold is rarely 100%: agents work in a fuzzy domain, and a single flaky case should not block a release.
You pick a bar that reflects the quality you are willing to ship, say 95% of the dataset. The gate holds the line at that bar, so a change that breaks five cases you already fixed cannot merge unnoticed.
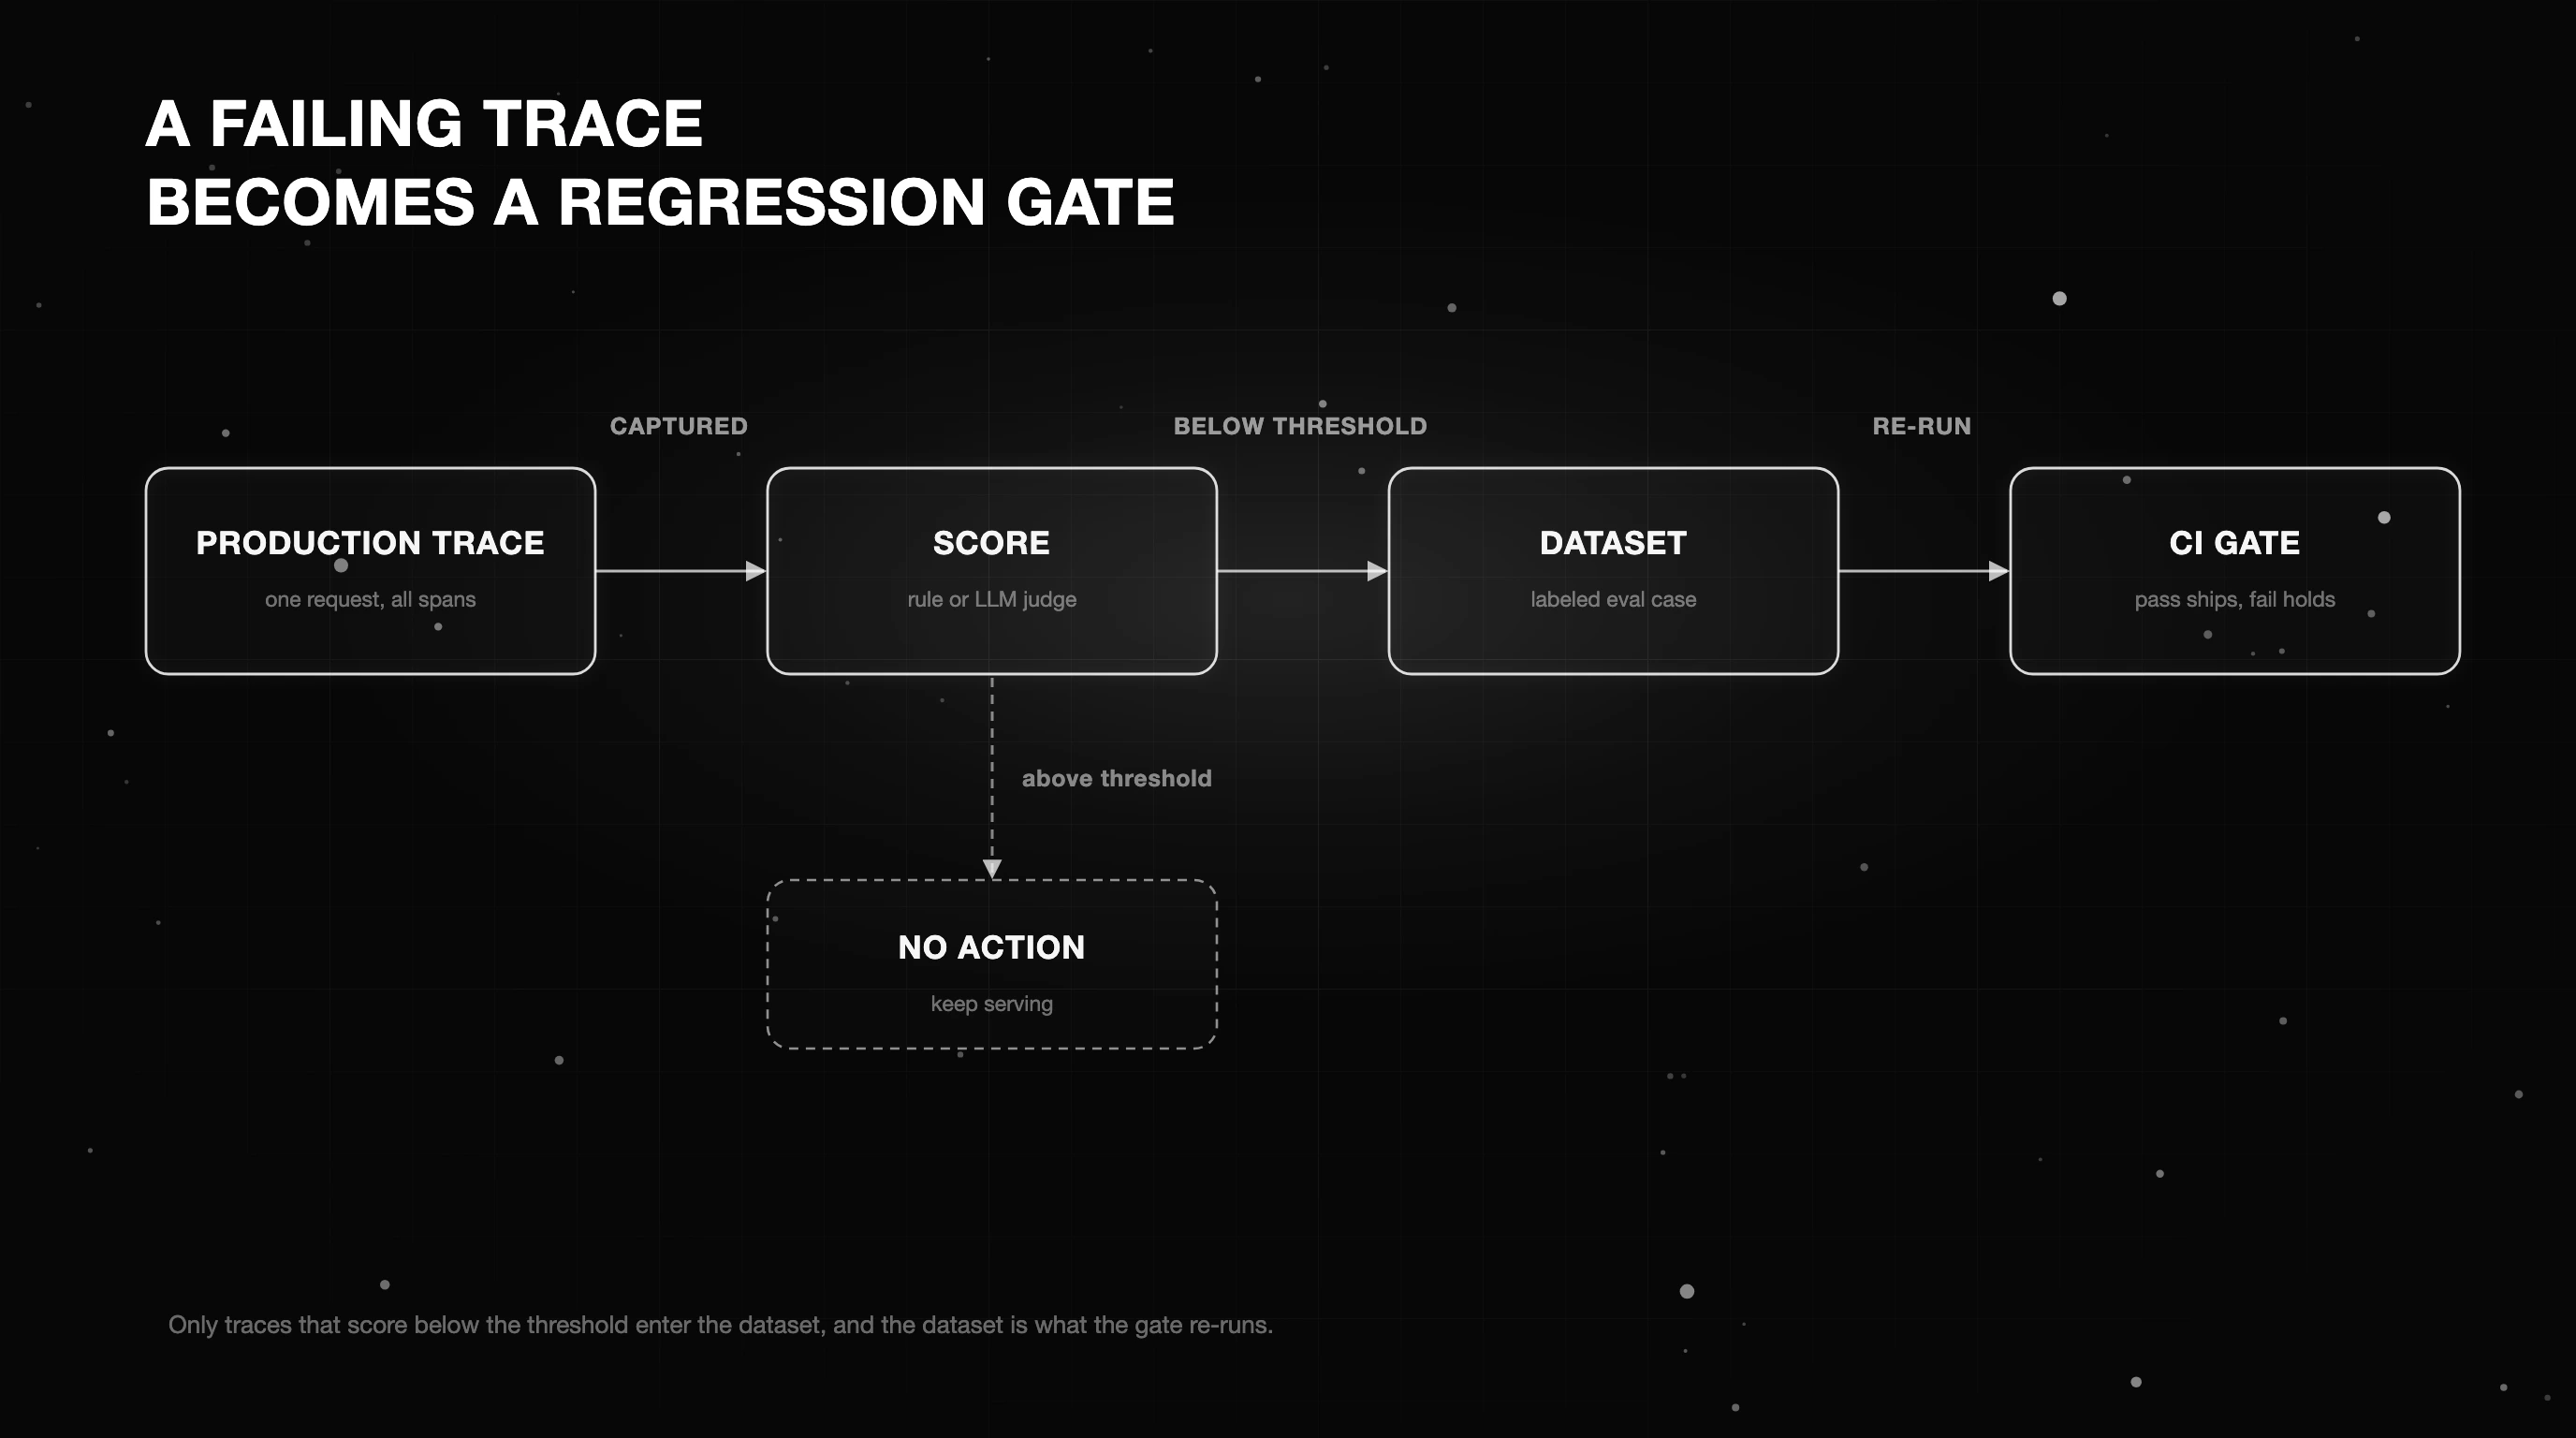
The property that matters is that none of this depends on manual heroics alone. Once the workflow is wired, a production failure can become a regression test. The gate then flags future changes that reproduce the same tested failure mode.
Turning Agent Traces Into Eval Cases
The single most valuable move in the loop is converting failing agent traces into eval cases, so it is worth showing in code. The setup uses OpenTelemetry directly, which keeps the traces portable, plus the traceAI instrumentor for the OpenAI Agents SDK so each agent step emits a span without hand annotation.
# Code 1 - capture agent spans (OTel-native) and collect failing ones as eval cases
from opentelemetry import trace
from opentelemetry.sdk.trace import TracerProvider
from opentelemetry.sdk.trace.export import BatchSpanProcessor, ConsoleSpanExporter
from traceai_openai_agents import OpenAIAgentsInstrumentor

provider = TracerProvider()
provider.add_span_processor(BatchSpanProcessor(ConsoleSpanExporter()))
trace.set_tracer_provider(provider)
OpenAIAgentsInstrumentor().instrument()  # auto-emits an OTel span per agent step

eval_dataset: list[dict] = []

def collect_failing(span: dict, score: float, threshold: float = 0.7) -> None:
    # a failing production span becomes a labeled eval case
    if score < threshold:
        eval_dataset.append({"input": span["input"], "output": span["output"], "score": score})
The collect_failing function is the hinge. It takes a span and a score, and when the score falls below the threshold it appends the input and output to eval_dataset as a labeled case.
That is the whole mechanism for turning production reality into test coverage: a request that went wrong in front of a user becomes a permanent example the agent has to handle before the next release ships.
In practice the score comes from an evaluator rather than by hand, and the dataset persists to storage rather than a Python list, but the shape holds.
One caveat keeps this from drowning you: raw failing traces repeat. The same broken prompt template can generate the same failure a thousand times in a day, and a dataset with a thousand copies of one bug is not a thousand tests. It is one test with a heavy thumb on the scale.
Before a failing trace becomes a case, cluster near-duplicates and keep a representative few, so the dataset stays balanced across distinct failure modes instead of dominated by whichever bug was most frequent. The goal is coverage of the ways the agent breaks, not a raw count of incidents.
What makes this powerful is that the eval cases are real. Synthetic test sets guess at how users behave. A dataset built from failing traces is drawn from how they behaved, including the messy, out-of-distribution requests you would not have thought to write by hand.
This is where trace-level debugging stops being a one-off investigation and becomes a supply line for your test suite. Every incident you debug leaves behind a test that prevents its recurrence.
Measuring Whether the Loop Works
A loop you cannot measure is a loop you cannot trust. Two numbers tell you whether yours is real. The first is loop yield: of all the failing traces you captured, how many became eval cases.
If you are logging a hundred failures a week and converting three, the loop is decorative. The second number is the regression-gate pass rate: of the eval cases in your dataset, how many the current agent passes.
# Code 2 - make the loop measurable
def loop_yield(converted: int, total_failing: int) -> float | None:
    """Fraction of failing spans that became eval cases."""
    if total_failing == 0:
        return None
    return converted / total_failing

def _demo():
    assert 0.0 <= loop_yield(7, 10) <= 1.0
    assert loop_yield(0, 0) is None
    assert loop_yield(10, 10) == 1.0

if __name__ == "__main__":
    _demo()
loop_yield is simple by design: converted failures divided by total failures. When no failures were observed, it returns None rather than 100%, because there is no data from which to calculate a conversion rate.
The _demo function asserts the boundaries hold, that a partial conversion lands between 0 and 1, that an empty sample returns None, and that complete conversion returns 1.0, so you know the metric behaves before you wire it to a dashboard.
The two numbers are most useful read together, because each covers for the other’s blind spot. High loop yield with a falling pass rate means you are good at finding failures and slow at fixing them: the dataset grows faster than the agent improves, and you are accumulating debt.
High pass rate with near-zero loop yield is worse than it looks. The gate is green only for the handful of cases you bothered to capture, while most real failures never entered the loop at all.
A healthy loop keeps yield high enough that the dataset reflects production, and pass rate high enough that the agent clears it. Watching one without the other is how a team convinces itself the loop works when it does not.
Track loop yield over time and it tells you whether your team is feeding failures back or letting them pile up unread. Track the regression-gate pass rate and it tells you whether the agent is improving against the failures you already found.
Together they turn “we have observability” into a claim you can defend with a number. This is the discipline behind eval-driven development: the eval set grows from production, and the gate on that eval set decides whether code ships.
Feedback Sources That Power Agent Learning
Not all feedback has the same shape, and the sources that drive agent learning each answer a different question. There are five worth wiring in, and each lands at a specific stage of the loop.
- Direct user feedback: a thumbs up or down, or a written correction. The strongest signal and the rarest, because most users never rate anything.
- Implicit signals: behavior that reveals quality without a rating. Code the user accepted, a ticket that reopened, a session abandoned mid-task. Plentiful, but noisy, and it needs mapping before it means anything.
- LLM-judge scores: a model grading the output against a rubric. This scales to every request and is the workhorse for labeling traces at volume.
- Deterministic rules: assertions that pass or fail with no ambiguity. Did the JSON parse, did the tool exit clean, did the answer cite a real document. Cheap and exact wherever the check is objective.
- Annotation queues: human review of sampled traces. The slowest and most expensive source, and the one that produces the gold labels everything else is calibrated against.
The mistake is treating these as competing options and picking one. A working loop uses several at once, because they cover different failures. Table B lays out what each observability layer can and cannot tell you, and where its signal lands in the loop.
| Layer | Question it answers | Signal captured | What it cannot tell you | Where it lands in the loop |
|---|---|---|---|---|
| Monitoring | Is the system up and fast? | Uptime, latency, error rate | Whether the answer was correct | Before the loop, system health |
| Observability | What did the agent do? | The full trace of steps, tools, context | Whether any step was good | Step one, observe |
| Evals | Was the output good? | A score against a rubric or rule | Why the user reacted as they did | Step two, evaluate |
| Feedback loop | Is the agent getting better? | Failures converted to datasets and gates | Anything you never captured | Steps three to six |
Where Future AGI Fits for Agent Observability
This is the loop Future AGI runs end to end. The instrumentation layer is traceAI, open source and Apache-2.0, built directly on OpenTelemetry.
It publishes its own semantic-conventions package for GenAI spans and documents integrations for more than 30 frameworks, so the trace you capture stays portable instead of locked to one vendor’s format. You can point that same trace at Future AGI or anywhere else that reads OpenTelemetry.
From there, Observe lets you open, search, and score every trace. That last verb is the one most tools skip.
Because a trace is a first-class object, you can score traces with evals using a rule or an LLM judge. Teams can then review low-scoring traces, deduplicate repeated failure modes, and promote representative failures into a regression dataset.
That dataset becomes an eval set for the next release, and Future AGI supports threshold-gated evaluation in CI so regressions are flagged before merge. Dataset selection and curation remain explicit parts of the workflow rather than an automatic consequence of a low score.
Observe a run, score it, curate representative failures, and gate the next deploy: the product supports each stage while leaving teams in control of what becomes a permanent test.
To see it work, send your first trace and attach a score.
Closing the Loop on Agent Observability
A green dashboard is where agent observability starts, not where it ends. Capturing traces tells you the agent ran and how long it took. It does not tell you the answer was wrong, and it does not carry that wrong answer anywhere useful.
The teams whose agents get better are the ones who treat every failing trace as raw material: score it, save it, and re-run it as a test before the next version ships.
That is the whole move. Observe a run, evaluate the output, pull representative failures into a dataset, improve the agent, and gate the deploy on a regression check so known failure modes are less likely to return unnoticed.
None of it requires a bigger model or a new framework. It requires closing the loop between the trace you already capture and the eval you probably are not running yet.
Start with one failing trace. Attach a score to it, drop it into a dataset, and make your next deploy prove it does not regress. That single loop, repeated, is what turns observability into learning.
Frequently Asked Questions
What is agent observability?
What is the difference between agent monitoring and agent observability?
What is an observability feedback loop?
How do you turn traces into evals?
Why do AI agents fail silently in production?
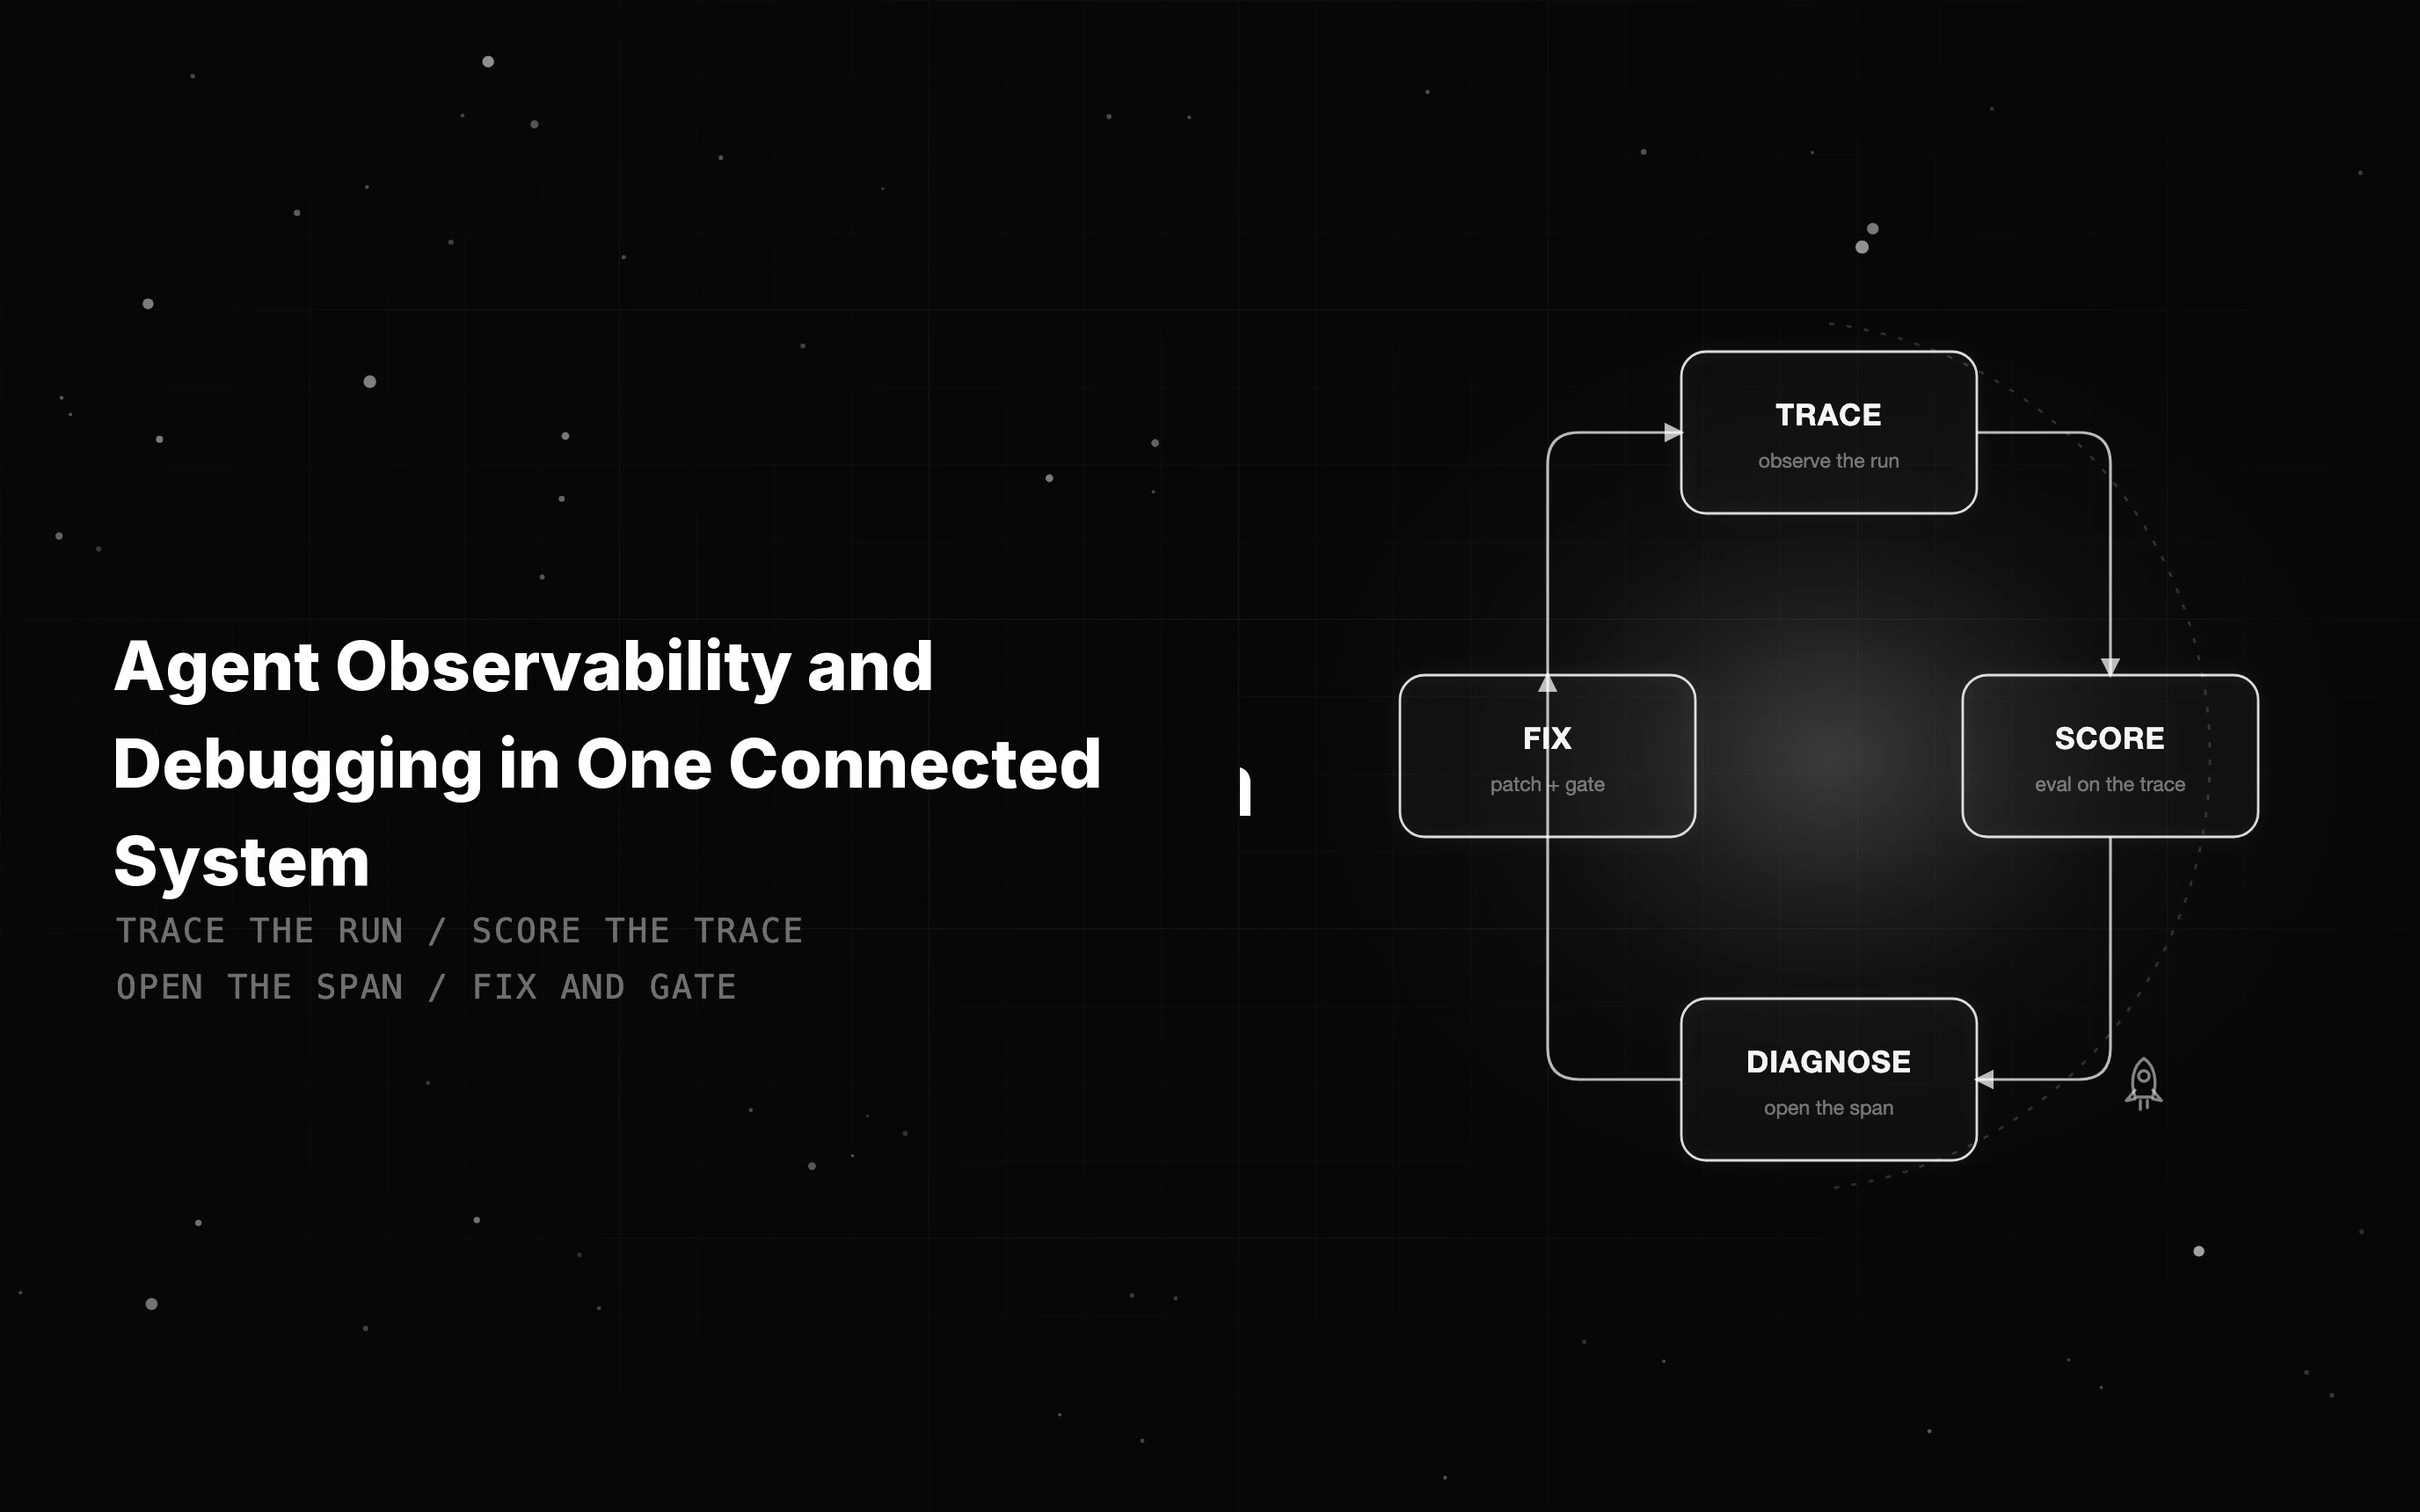
Agent observability shows what an agent did; debugging fixes it. See what to instrument and how tracing, evals, and fixes meet on one trace to close the gap.

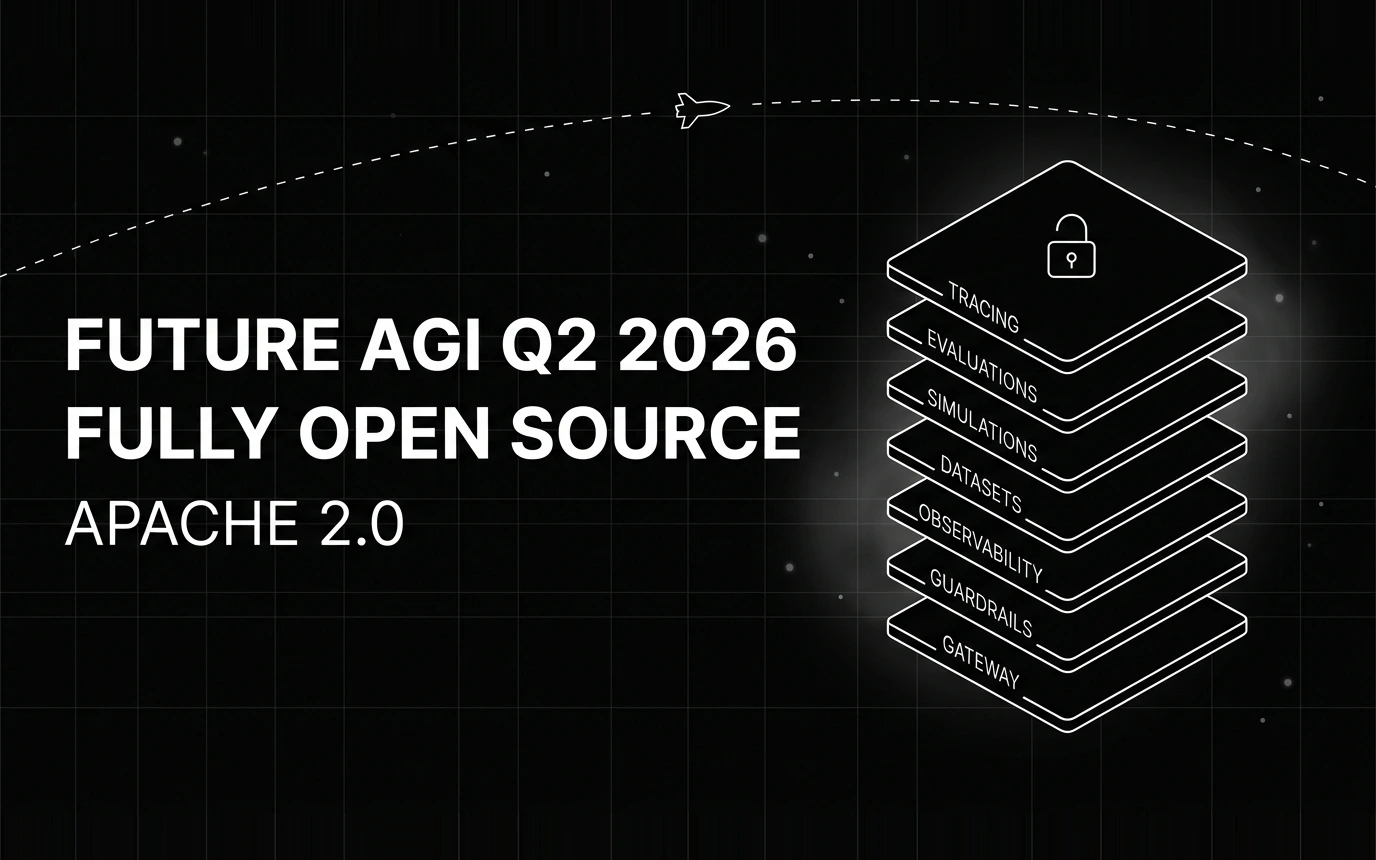
Inside Future AGI open source in Q2 2026: the platform shipped under Apache 2.0, Error Feed and the Agent Command Center went live, traces hit billions.

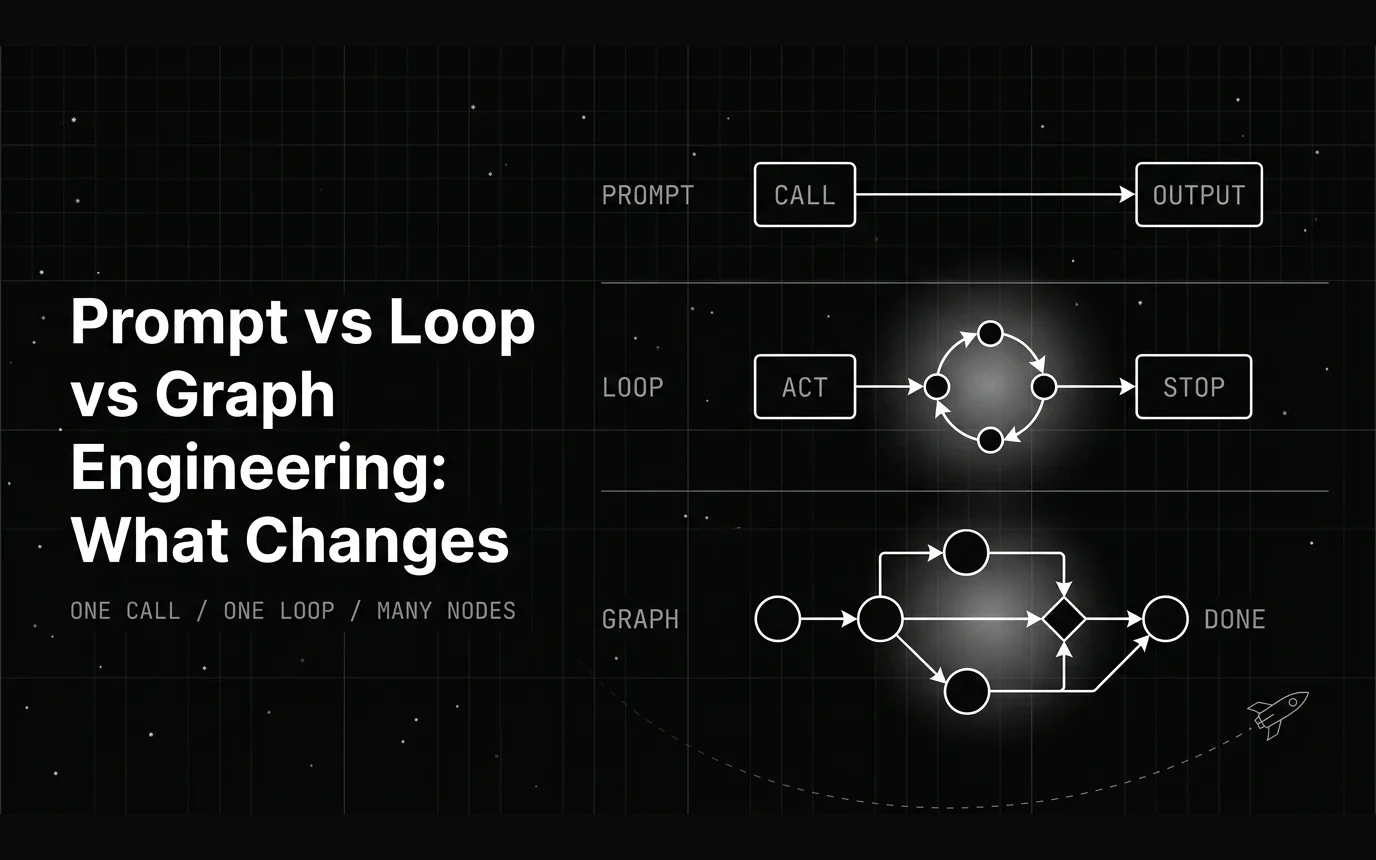
Prompt, loop, and graph engineering control different parts of an agent system. Failure modes and debugging cost both escalate as you move up a layer.