LLM Tracing for Debugging: From Prompt to Tool Call to Final Output
LLM tracing breaks at the tool boundary. The span attributes that turn a silent agent failure into a fix, why they are Opt-In, and the code to set them.
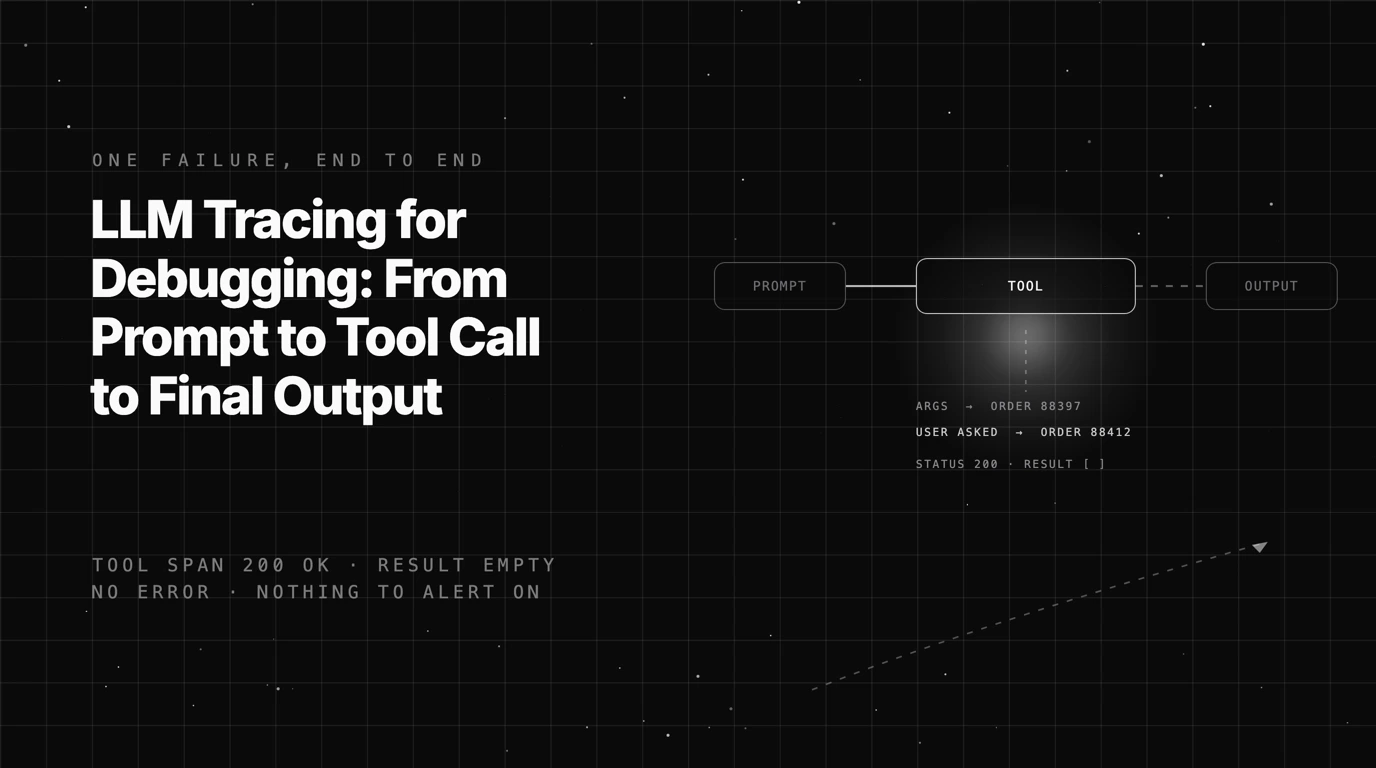
Table of Contents
A support agent told a customer their refund had been processed. It had not been. The customer called back four days later, and by then the only evidence was a log file showing three HTTP calls, all of them 200, none of them slow, none of them throwing.
You cannot reproduce it. You send the same message and the agent behaves correctly. The prompt has not changed, the tools have not changed, and the model version has not changed. Somewhere inside one request, the agent did something reasonable at every individual step and arrived somewhere wrong.
The short version: when an agent succeeds at every step and still gets the answer wrong, the evidence usually sits at the tool boundary. The two attributes that carry it, the arguments the model chose and the raw result it got back, are Opt-In in the OpenTelemetry GenAI conventions. Off by default. That is how tracing can be switched on and a failure still take a week to find.
This post follows one failure through a trace, one hop at a time, then covers the two things that walkthrough cannot fix on its own: why checking an output is an evaluation rather than a test, and why failures that span turns are invisible to any single trace.
Not what a span is, which is covered in Span vs Trace in LLM Observability. Not multi-agent topology and handoff debugging, which is covered in How to Trace and Debug Multi-Agent Systems. Just the three places the evidence lives, and the specific attribute at each one.
How this post was put together. Every OpenTelemetry claim below is sourced to the GenAI semantic conventions repository and linked at the claim, with requirement levels quoted per span type rather than generalised. Future AGI product behaviour was verified against current public documentation and the traceAI source on 2026-08-06. The refund scenario is illustrative, built to carry the attribute argument; failure rates and frequencies are deliberately not quantified, because we have no public dataset to quantify them with.
The Agent Failure a Trace Has to Explain
Keep one scenario in mind for the rest of the article.
A customer writes: “I want to return the headphones from my order last week.” The agent calls
lookup_order, receives a valid order back, checks the refund policy, and confirms the refund. Every
call succeeds. The response is polite and specific. It names an order number.
The order it named belongs to a different purchase. The headphones were on order 88412, placed on Tuesday. The agent looked up order 88397, placed three weeks earlier, and the refund it confirmed was for an item that was never returned.
Here is what your logs show:
INFO  POST /agent/message         200  1842ms
INFO  llm.chat  gpt-4o            200   980ms
INFO  tool.lookup_order           200   112ms
INFO  tool.get_refund_policy      200    34ms
Four successes. No error, no exception, no timeout, nothing to alert on. This is the central problem with agent failures: the system is not broken, it is wrong, and those are different conditions. Logs record whether calls succeeded. Traces record what the calls said to each other, which is where wrong lives.
It is worth naming why the usual instinct fails here. The instinct is to add logging and wait for it to happen again. But this class of failure is rare enough that waiting is not a plan, the trigger is a phrasing the model handles badly rather than an input you can enumerate, and by the time it recurs the model version may have moved underneath you.
Reproduction is the wrong strategy. The strategy that works is recording enough on the first occurrence that you never need a second one.
Hop One: What the LLM Span Has to Store
The first span is the LLM call. The thing you need from it is not the template. It is the string that was actually sent.
Store the rendered prompt, not the template
This is a common source of “it works locally”. Your template contains
{{customer_order_history}}. In development that variable resolves to three orders. In production it
resolved to an empty string, because the history service timed out and the caller swallowed the
error and passed a default. The template looks correct in your repository forever.
If the span stores the template, you will spend a day looking at the wrong artifact. Store the final rendered string, after every variable is substituted and after any truncation has been applied.
The conventions have a home for both halves of that distinction. gen_ai.input.messages and
gen_ai.output.messages carry the actual message content and are Opt-In. gen_ai.prompt.name
and gen_ai.prompt.version are Conditionally Required when a named template is used, and
gen_ai.prompt.variable is Opt-In. Recording template identity and rendered result together is a
supported pattern, not a workaround.
Truncation is invisible unless you record it
Long context gets cut. Whatever does the cutting, whether that is your own code, a framework, or a provider-side limit, usually does it silently. The order the customer meant sat at position 41 of the history, the window held 40, and the model answered using what it could see.
Record the token count you sent alongside the rendered prompt. The two numbers together tell you when this happened.
The attributes worth setting
Under the OpenTelemetry GenAI semantic conventions, an inference span name should be
{gen_ai.operation.name} {gen_ai.request.model}. On the inference span, gen_ai.operation.name
and gen_ai.provider.name are Required, and gen_ai.request.model is Conditionally Required when
available. Recommended attributes include gen_ai.response.model, server.address, and the token
usage pair gen_ai.usage.input_tokens and gen_ai.usage.output_tokens.
Those requirement levels are per span type, and the tool span is different, which the next section covers. One caveat before you standardise on any of this: these conventions currently carry a Development stability badge, and they now live in their own repository rather than in core semantic conventions, so the attribute set can still change. Source: OpenTelemetry GenAI semantic conventions, verified 2026-08-06.
In our scenario, the prompt span is clean. The customer’s message is intact, the history is present, and the token count is well inside the window. The fault is downstream, and we now know that because we can see it rather than assume it.
Hop Two: The Tool Span, Where Agent Debugging Actually Happens
This is the hop that gets the least instrumentation attention and the one where a correct system produces a wrong answer.
The model chooses the arguments, and that is a decision worth recording
Your tool is correct. Your tool schema is correct. The model decided what to pass into it, and that decision is a model output like any other, made with the same non-determinism as the prose.
In our scenario the model extracted “last week” and produced an order lookup that resolved to the wrong order. The tool did its job perfectly on the input it received.
The tool span has to carry the arguments the model chose, side by side with the user message that produced them. The mismatch between those two is the entire bug, and it is invisible from either one alone.
The tool span has its own rules
execute_tool is a defined gen_ai.operation.name value, so tool invocations have a standard home
rather than needing a bespoke span type. The details differ from the inference span in ways that
matter:
- the span name should be
execute_tool {gen_ai.tool.name}, soexecute_tool lookup_order; - the span kind should be
INTERNAL; gen_ai.operation.nameandgen_ai.tool.nameare Required.gen_ai.provider.name, Required on the inference span, does not appear on this one at all;gen_ai.tool.call.id,gen_ai.tool.descriptionandgen_ai.tool.typeare Recommended;gen_ai.tool.call.argumentsandgen_ai.tool.call.resultare Opt-In.
That last line is worth sitting with. The two attributes that would have caught our refund bug are exactly the two the conventions leave off by default, so a conforming tracing setup can be complete and still hold none of the evidence. If your tool spans are empty, start by checking whether anything opted in.
Store the raw result, not a summary of it
Summarising a tool result before writing it to a span is a reasonable-looking storage optimisation, and it destroys the evidence. When you later ask “did the model see the order date”, a summary that says “order record returned” cannot answer. The payload can.
If storage cost is the concern, bound the fields rather than summarising them. Keep the whole structure, truncate long strings, and record that you truncated. Bounded structure stays queryable; prose does not.
Silent success
A 200 with an empty array is a failure that never appears in an error rate. The tool worked. The
query matched nothing. The model received {"orders": []}, treated the absence as uninformative, and
continued using what it had inferred from the conversation.
There is no exception to catch here. The only way this becomes visible is if the span holds the result body and something compares it against what the model then claimed.
Retries tell you which bug you have, with one caveat
If the model called lookup_order three times with identical arguments, it did not accept the
result and it had no better idea. If it called three times with different arguments, it was
searching. Those are different failures with different fixes, and the difference is only legible if
each attempt carries its own arguments.
The caveat is that this applies to model-initiated re-calls, which are separate decisions and belong in separate spans. It does not apply to transport-level retries. The conventions state that when a transient issue causes an automatic retry, the span “SHOULD cover the duration of the logical operation with all retries”. Collapsing those two cases into one rule is how teams end up with either unreadable traces or invisible retries.
What this looks like in code
Manual instrumentation, using traceAI’s Python SDK:
LOOKUP_ORDER_SCHEMA is your tool’s JSON schema and order_service your existing client; everything
else is the real API.
# pip install fi-instrumentation-otel
import json

from fi_instrumentation import FITracer, register
from fi_instrumentation.fi_types import FiSpanKindValues, ProjectType

trace_provider = register(project_type=ProjectType.OBSERVE, project_name="support-agent")
tracer = FITracer(trace_provider.get_tracer(__name__))


def lookup_order(**arguments):
    with tracer.start_as_current_span(
        "lookup_order", fi_span_kind=FiSpanKindValues.TOOL
    ) as span:
        span.set_tool(name="lookup_order", parameters=LOOKUP_ORDER_SCHEMA)
        span.set_input(json.dumps(arguments))       # what the model chose
        result = order_service.search(**arguments)
        span.set_output(json.dumps(result))         # the raw payload, not a summary
        return result
Two lines carry the whole argument. set_input stores the arguments the model produced, and
set_output stores the result body before anything summarises it. traceAI also defines
gen_ai.tool.call.arguments and gen_ai.tool.call.result in its attribute set, matching the
convention names above.
The diagnostic table
| Symptom in the trace | What it usually means | The attribute that proves it |
|---|---|---|
| Tool span 200, empty result body | The query matched nothing | Raw result payload |
| Tool arguments do not match the user request | The model mis-extracted an entity | Tool arguments against the prompt span |
| Same tool called repeatedly with identical arguments | The model did not accept the result | Per-attempt arguments across spans |
| Output asserts a fact absent from every tool result | The model filled the gap from priors | Output span against tool result payloads |
| Long gap between spans with no error | A timeout was swallowed by a retry wrapper | Span duration against the downstream call’s own timing |
Our scenario is row two causing row four: bad arguments upstream, an unsupported claim downstream. Row one is the cheapest to instrument for and the one no status code will ever surface.
Hop Three: The Output Span and the Claim That Came From Nowhere
The last hop is where the failure becomes visible to the customer, and it is almost never where the failure was caused.
Put the output and the tool results side by side. The agent said the refund for order 88397 was processed. The tool results contain order 88397 and contain no refund confirmation at all, because no refund tool was ever called.
The claim entered the answer between the last tool result and the final token, produced by a model completing a pattern rather than reporting a fact. That comparison is the whole check, and it only exists if both halves are in the same trace.
Why Output Checking Is an Evaluation, Not a Test
You can assert that a tool returned 200. You cannot assert that an answer contains no unsupported claim, because there is no regular expression for “unsupported”. Deciding whether an output is supported by a set of retrieved facts requires reading both and judging, which makes it an evaluation rather than a test.
That distinction matters operationally. Tests belong in continuous integration and gate merges. Evaluations run against production traffic, on traces, after the fact, and score things that were never going to be deterministic.
It also decides where the check lives. A test that cannot fail deterministically does not belong in a build pipeline, and an evaluation that only ever runs pre-merge never sees the inputs that actually break the agent. Forcing one into the other’s place is how teams end up with a green build and a wrong agent.
The Failures That Only Exist Across Turns
Everything above happened inside one request, which is why the tool span could settle it. Now change one thing about the scenario: the customer mentioned the headphones in turn two, the agent resolved the wrong order then, and nobody noticed until it confirmed the refund in turn six.
The turn-six trace is clean. Its tool span carries arguments that match the order already under discussion, and its output is consistent with everything before it. Nothing in that request is wrong. The mistake is four turns upstream, in a trace you are not looking at.
Join traces by session id, or this class of failure stays invisible no matter how good your span attributes are.
This is where conversational agents differ most from single-shot pipelines. In a single-shot pipeline, the request boundary and the failure boundary are the same thing. In a conversation, an error introduced early becomes context for everything after it, and each subsequent turn treats it as established fact.
By turn six the model is not making a mistake, it is being consistent with one. The trace for turn six looks impeccable, which is exactly why session-level joins are not optional for anything multi-turn.
What Separates a Debuggable LLM Trace From a Decorative One?
Tracing can be switched on and still settle nothing, because the spans exist and the attributes are empty. Here is the difference, by span kind.
| Span kind | Must carry | Common omission | Consequence |
|---|---|---|---|
| LLM | Rendered prompt, response, model, token counts | Template instead of rendered prompt | Variable-resolution bugs stay invisible |
| TOOL | Arguments, raw result, status, duration | A summary instead of the payload | You cannot prove what the model saw |
| RETRIEVER | Query, chunk ids and chunk text, similarity scores | Chunk ids only | Cannot separate retrieved from relevant |
| AGENT | Step sequence and parent links | Flat spans with no parent | Cannot reconstruct order |
| CHAIN | Inputs and outputs at the boundary | Nothing recorded | A blind segment in the middle of the trace |
Those span kinds are not hypothetical categories. traceAI’s Python SDK enumerates them explicitly,
including AGENT, CHAIN, EMBEDDING, EVALUATOR, GUARDRAIL, LLM, RERANKER, RETRIEVER,
TOOL, VECTOR_DB, CONVERSATION and UNKNOWN, which is why a tool call and a retriever query are
distinguishable in a trace rather than both arriving as generic work.
For the fuller anatomy of a well-formed trace, see What Does a Good LLM Trace Look Like, which also makes the case for bounded argument representations over unbounded JSON, the practical form of the truncate-and-record rule above. Sampling, span hygiene and PII are covered in LLM Tracing Best Practices, and Debugging AI Agents covers the fix recipes once you have found the failing hop.
Where Does All That Content Actually Go?
Everything above says record more. That runs straight into a constraint the conventions are explicit about: model instructions, user messages and model outputs are “considered sensitive and are often large in size”, and capturing them “may be problematic due to high storage costs, regulatory requirements, or the need to enforce different access models for operational and user data.”
So the spec does not tell you to record everything. It gives you three options, and the default is to record nothing:
- Don’t record instructions, inputs, or outputs. This is the default, and it is the reason tracing can be switched on while the evidence this post depends on is absent.
- Record them on span attributes —
gen_ai.system_instructions,gen_ai.input.messages,gen_ai.output.messages. The spec scopes this to cases “where telemetry volume is manageable and either privacy regulations do not apply or the telemetry storage complies with them, for example, in pre-production environments.” - Store content externally and record references on the spans.
Advice you will still read elsewhere says to put content in span events rather than attributes. That was the older shape of this convention and it is worth updating: the current document defines the content attributes above and treats events as the fallback representation, not the destination.
There is a caveat before you build on option two. Recording structured attributes “is supported on events (or logs) and may not yet be supported on spans”, and where a language lacks support the value “SHOULD be serialized to JSON string on spans and recorded in its structured form on events.” The same payload can therefore arrive as an opaque JSON string in one backend and a queryable object in another, which decides whether you can filter on it later.
Option three is the one to plan for if you are in production with real user data, and it has a property worth knowing. The spec describes an in-process upload hook that “SHOULD operate independently of the opt-in flags”, invoked “regardless of the span sampling decision.”
Read that last clause twice, because it separates two decisions that usually arrive coupled. Trace sampling and content capture become independent. You can sample 5% of traces for latency work and still capture the payloads on every request, which is the difference between having evidence and not having it for the failure class this post is about: the rare, unreproducible one, where sampling is exactly what loses your only copy.
One thing does not belong on an attribute at any volume: anything unbounded and high-cardinality
used for grouping. The conventions ask for error.type to carry “the canonical name of exception
that occurred, or another low-cardinality error identifier” rather than the message text. Put the
raw message in the payload attributes above, and keep the field you group and alert on small enough
to aggregate.
Our position, since the spec deliberately does not take one: run option two in pre-production and option three in production, keeping the same attribute names across both. The attribute names are what your queries and dashboards are written against, so changing storage strategy between environments should not change what a query looks like.
Where Future AGI Fits
Everything above is one trace read by one engineer. That works for the failure you already know about. It does not work for the failures nobody has reported yet.
traceAI is the instrumentation layer, and it emits the span kinds listed above, so TOOL and
RETRIEVER spans arrive typed rather than generic. It is open source under Apache 2.0 in the
traceAI repository.
For Python, manual instrumentation ships as
fi-instrumentation-otel on PyPI, alongside
per-framework instrumentors such as
traceAI-openai. TypeScript uses @traceai/fi-core on
npm.
The send your first trace guide is the shortest path to auto-instrumented traces, the observability docs cover the rest of the surface, and Instrument Your AI Agent With traceAI walks through the setup.
One naming note, since it shows up in the screenshot below. The span kind attribute in the Python SDK
is gen_ai.span.kind, while the TypeScript fi-semantic-conventions package still exports it as
fi.span.kind. Both are Future AGI’s own attributes rather than OpenTelemetry GenAI ones, despite
the shared prefix.
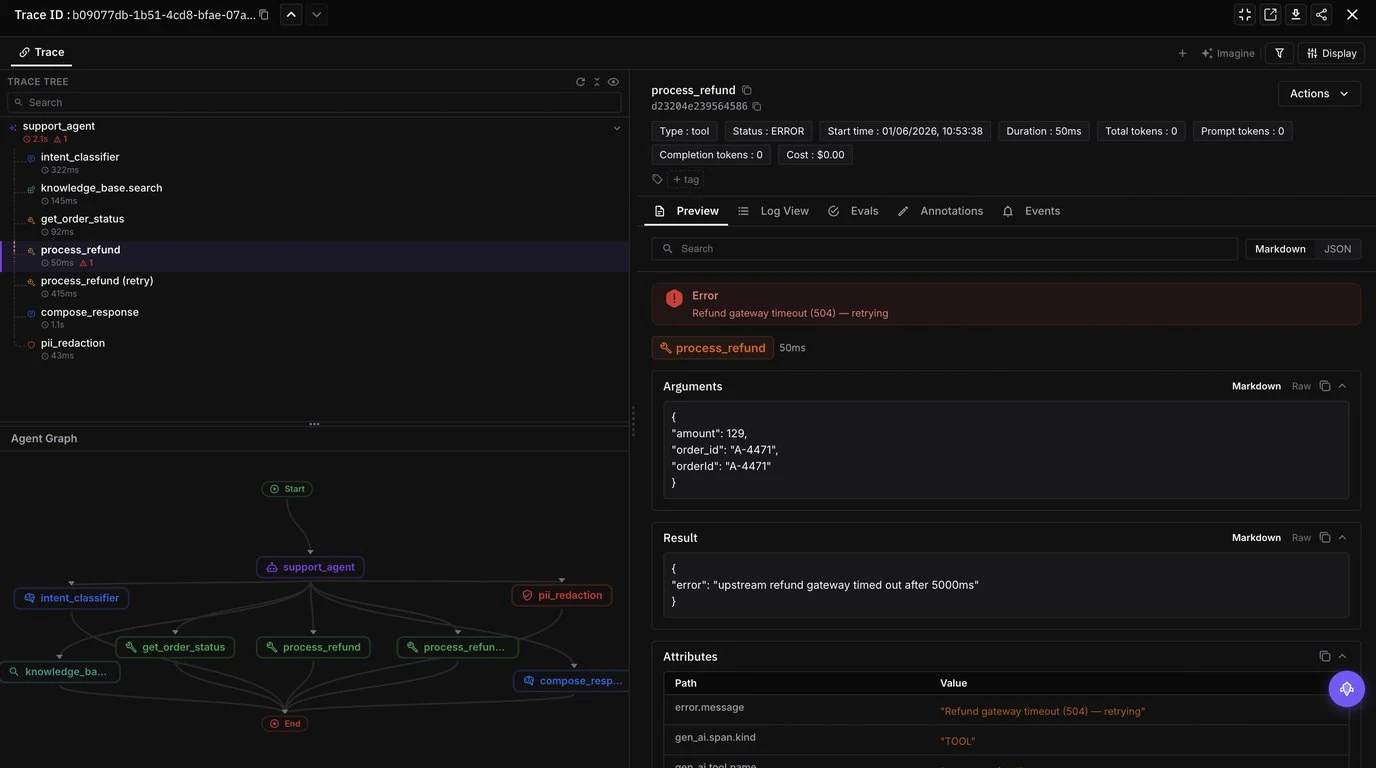
Read the right-hand panel against the table above. The arguments are stored as structured JSON rather
than a prose summary, the result payload is intact, gen_ai.span.kind is TOOL, and the retry
appears as its own span so you can compare its arguments against the first attempt.
One honest note on this example: it shows the easy case. The span status is ERROR and a 504 is visible, so the failure announces itself. Our refund scenario has none of that, which is precisely why the arguments and the result payload have to be there anyway. The panel that debugs a loud failure is the same panel that debugs a silent one.
The Error Feed is the part that changes the workload. Per the Future AGI docs, it detects errors across five categories including tool misuse and hallucination, then groups related traces into named clusters, so fifty traces with the same underlying problem arrive as one issue rather than fifty alerts. It activates on traces reaching an Observe project without configuration beyond standard tracing.
The practical effect is that the question stops being “why did this one request fail” and becomes “which of these failures are the same failure”. Our refund scenario is worth an afternoon if it happened once, and worth a sprint if it is the fortieth instance of a pattern nobody had counted.
That is the honest reason it belongs at the end of this post. The manual walkthrough is how you learn what to look for. Clustering is how you find out how often it is happening.
Conclusion
Instrument the tool boundary as carefully as you instrument the model call. That is the whole lesson, and the conventions themselves push the other way: message content and tool-call payloads are all Opt-In, so a default setup captures the shape of an agent’s work and almost none of its evidence.
In our scenario, one attribute would have caught it: gen_ai.tool.call.arguments, the arguments the
model passed to lookup_order, stored next to the customer message that produced them. Order 88397
against “the headphones from my order last week”. Nothing else in the trace was wrong, and no status
code was ever going to tell you.
Want tool spans that carry their arguments by default? Instrument your agent with traceAI using the send your first trace guide, then open the Error Feed in the Future AGI app to see which failures repeat.
Frequently Asked Questions
How do you debug an LLM tool call that returns no error?
Which span attributes does LLM tracing for debugging need?
Why do agent failures not show up as errors?
Does OpenTelemetry support LLM tracing?
How do you debug an agent failure that spans several turns?
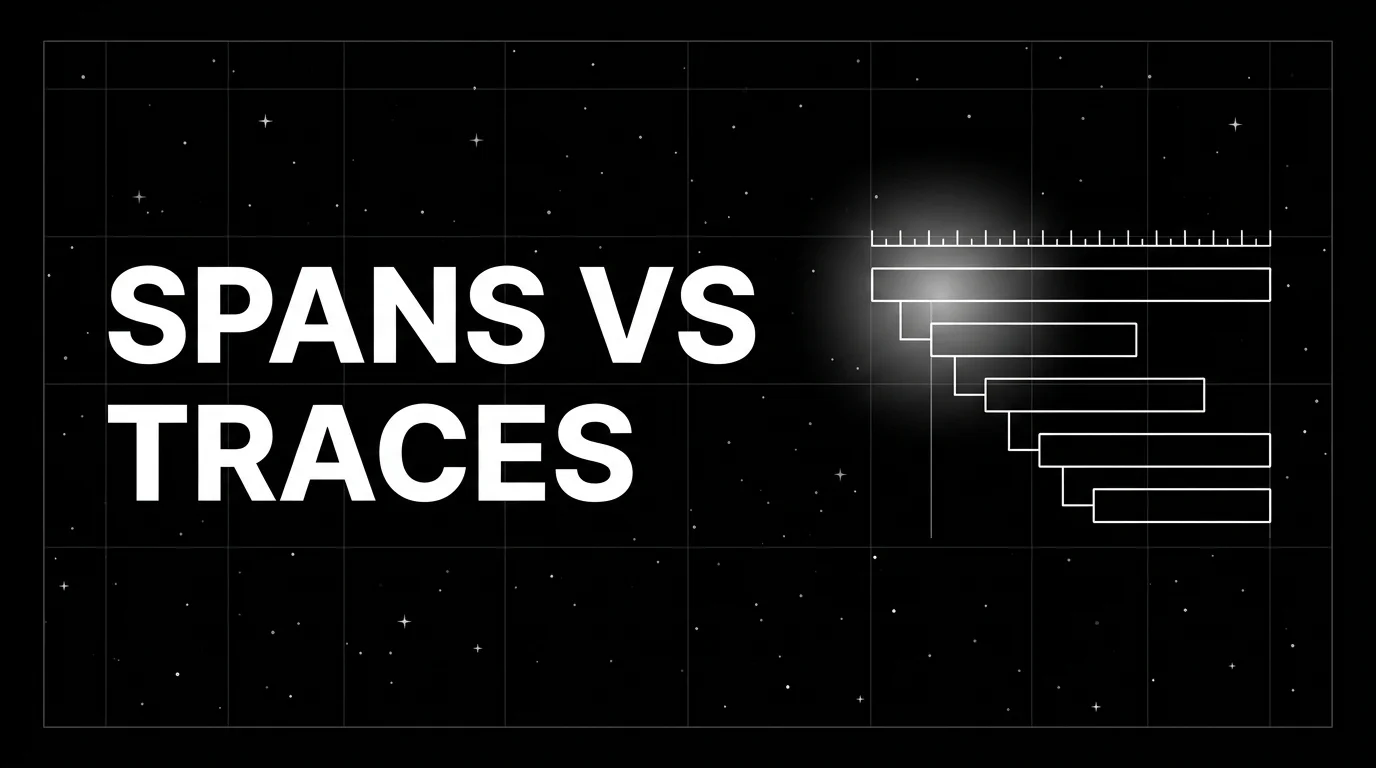
A trace is one user request; a span is one operation inside that trace. OTel terminology, parent-child trees, and what makes a good LLM trace in 2026.

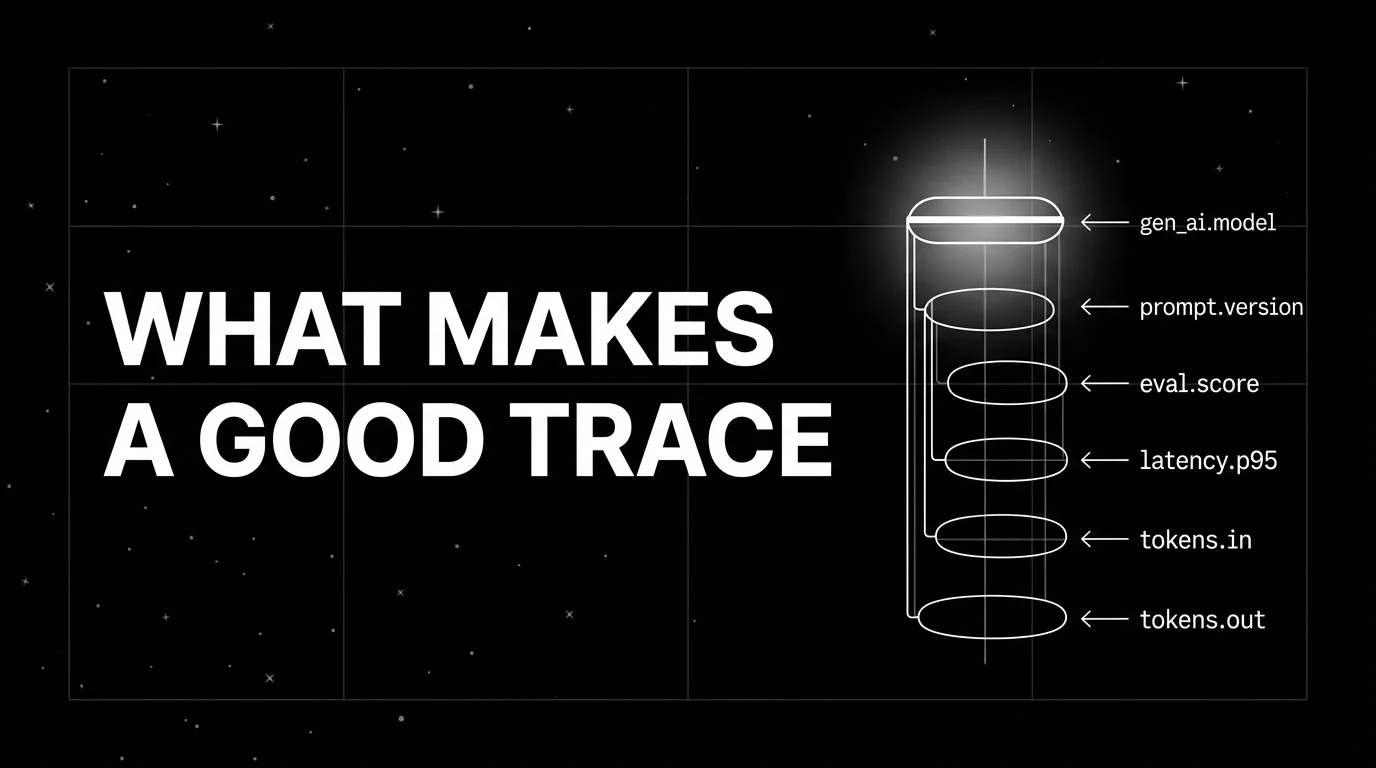
Anatomy of a good LLM trace in 2026: span hierarchy, OTel GenAI attributes, prompt-version tags, eval scores, cost attribution, retrieval and tool spans.

Trace, debug, evaluate multi-agent AI systems 2026 with traceAI, OpenTelemetry spans, rubric scoring. Code, span tree, three real failure cases.