LangChain Callback Tracing Best Practices 2026: Spans, Cardinality
LangChain callback tracing best practices in 2026: handler design, async support, cardinality, span hierarchy, OTel integration, and when to skip callbacks.
Table of Contents
A team running a LangChain RAG pipeline in production opens the trace store after a quality complaint. The chain executed correctly: retriever ran, LLM call ran, tool dispatch ran, output guardrail ran. The trace shows 47 spans. Three of them are duplicates from a custom callback handler shipped two months ago that fires alongside OpenInference’s instrumentor. Five of them have span names that changed across a LangChain minor-version upgrade because the handler reads the chain’s class name. Two of them carry the full prompt body (including a user’s email address) as a string attribute. The on-call engineer reading the trace cannot tell which retrieval scored low, which prompt version was used, or whether a tool call actually fired.
Callback tracing in LangChain works when the discipline is right and fails predictably when it is not. This post covers the production patterns for callback-based tracing in 2026: which library to pick, how to model the span tree, what attributes to emit, how to handle async, and which cardinality landmines to avoid. The patterns apply to LangChain (legacy) and LangGraph; the underlying callback machinery is the same.
For a primer on what LangChain callbacks are, see the existing Understanding LangChain Callback how-to; this post assumes the reader already knows the callback events and focuses on the tracing-specific best practices.
TL;DR: The 8 best practices
| # | Practice | What it prevents |
|---|---|---|
| 1 | Use an instrumentation library | Hand-rolled handlers that drift from the framework |
| 2 | Tree-structured spans | Flat span lists that bury the chain structure |
| 3 | OTel GenAI attributes on LLM spans | Cross-vendor incompatibility |
| 4 | Prompt-management attributes propagated | Regressions cannot be attributed |
| 5 | Async-aware handlers | Sync handlers blocking the event loop |
| 6 | Bounded attribute values | Cardinality explosion, PII risk |
| 7 | Tail-based sampling | Long-tail failures dropped under uniform 1% |
| 8 | Background batch exporter | Sync exporter latency on the request path |
If you only fix one thing first, replace any hand-rolled callback handler with OpenInference’s LangChain instrumentor or traceAI’s adapter. Most of the rest comes for free.
Why callback tracing in LangChain is its own discipline
Three things make LangChain callback tracing different from generic Python LLM tracing.
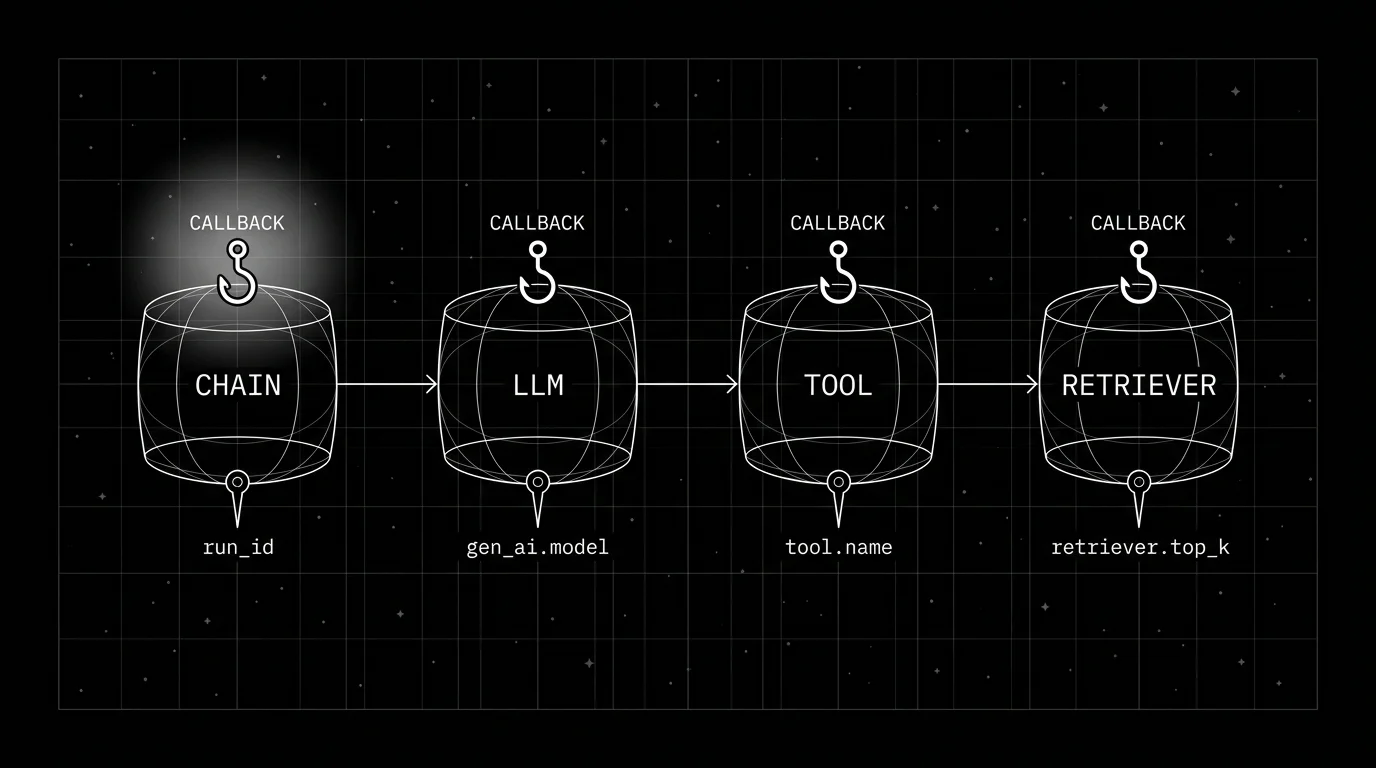
First, the framework owns the call sites. A LangChain chain runs through run, invoke, astream, batch, and a long list of execution paths; the user code does not call the LLM directly. The natural instrumentation surface is the callback hook, not a decorator at the call site.
Second, the run_id-to-span mapping is non-trivial. Every callback event carries a run_id plus a parent run_id; the callback handler maps run_ids to OTel spans. Concurrent runs (LangChain’s abatch, parallel chains, async streaming) require careful management of the mapping. A hand-rolled handler that drops a parent_run_id correlation produces wrong span trees.
Third, the span attributes that matter live across the framework boundary. The prompt registry sits outside LangChain; the eval framework sits outside LangChain; the feature flag platform sits outside LangChain. The callback handler is the join point; it has to read context from elsewhere and propagate it to spans.
The result: LangChain callback tracing is where the schema discipline shows up most visibly. Get it right and the chain is observable; get it wrong and the trace looks instrumented and answers nothing.
Which library to pick
Three realistic options.
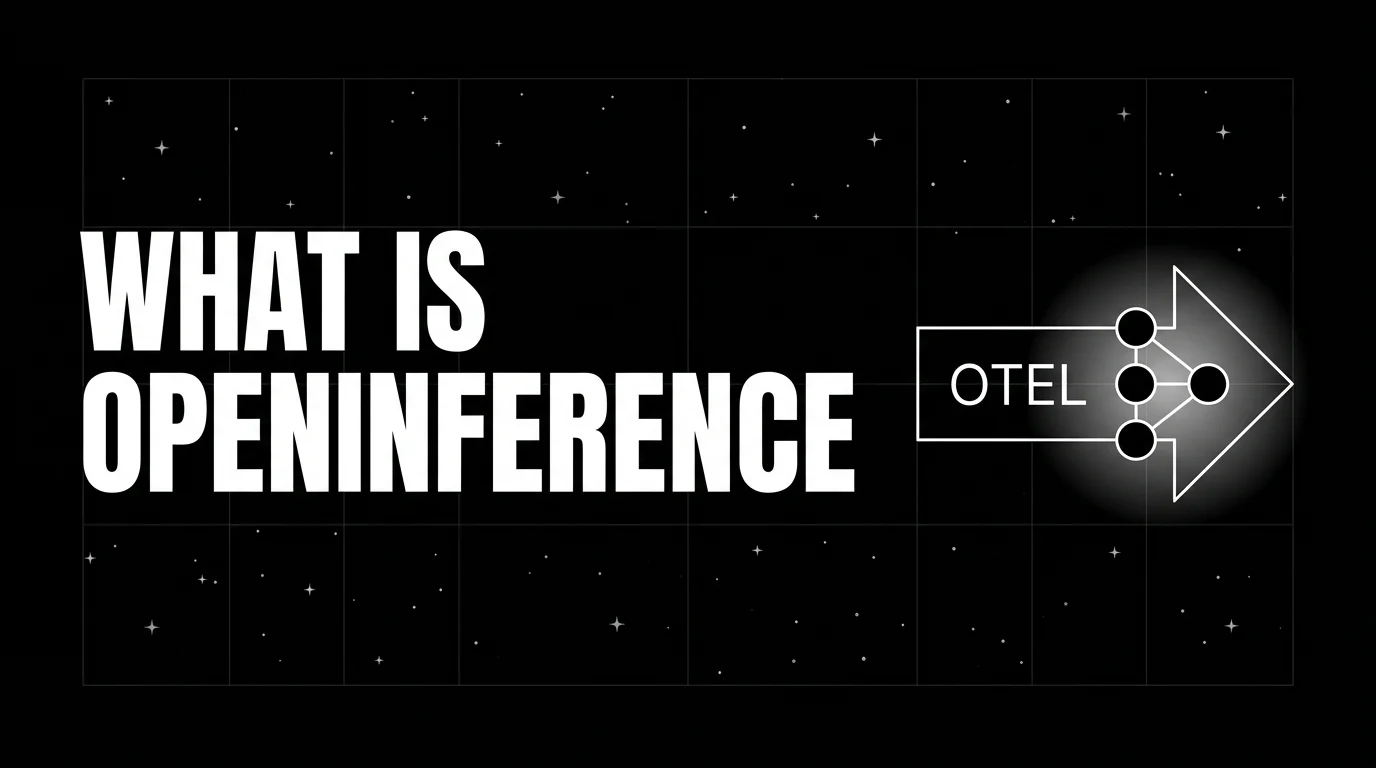
OpenInference LangChain instrumentor. Arize’s open-source instrumentation library, OpenInference attribute schema, OTel-native auto-instrumentation activated with LangChainInstrumentor().instrument(). Around 31 Python packages plus JavaScript and Java coverage; the LangChain instrumentor is an actively maintained OpenInference package; pin the version and validate trace shape on your chain before production rollout. Apache 2.0.
traceAI LangChain integration. Future AGI’s traceAI ships an OTel-native LangChain integration. Apache 2.0. 35+ frameworks across Python, TypeScript, Java, and C#. Emits OpenTelemetry GenAI-style attributes. Fits when you want an OTel backend plus FAGI-native eval surfaces.
LangSmith tracer. LangChain’s first-party callback-based tracer; emits to LangSmith specifically. LangSmith stores traces in LangSmith and supports OTel ingestion/export and fanout in current docs; validate portability for the exact fields you ship. Fits when LangSmith is your observability backend.
The vendor-neutral default is OpenInference or traceAI plus an OTel collector plus the backend of your choice. LangSmith fits when LangSmith is the chosen backend; measure portability against your trace fields before committing.
What does not fit for standard tracing: writing a custom callback handler from scratch when an instrumentor already covers your framework. The framework’s callback events change between versions (major LangChain releases (0.x to 1.x and the langchain-classic split) have non-trivial deltas); the run_id mapping is subtle; the OTel GenAI attribute schema is detailed. Custom handlers are still appropriate for application-specific signals (cost annotations, custom evaluation hooks, domain-specific metadata enrichment); just do not rebuild basic LangChain tracing on top of them.
The span tree of a LangChain run
The structure that fits a typical chain:
chain.run                       (root)
  prompt.format
  llm.chat                      (gen_ai.* attributes)
  output_parser.parse
For a RAG chain:
chain.run                       (root)
  retriever.invoke
    retriever.search.vector
  prompt.format
  llm.chat
  output_parser.parse
For a LangGraph agent:
graph.run                       (root)
  graph.node.planner
    llm.chat
  graph.node.tool_dispatch
    tool.weather
  graph.node.tool_dispatch
    tool.search
  graph.node.synthesizer
    llm.chat
  graph.edge.condition
The principle: the chain run is the root; child spans nest by causal relationship; sub-chains nest under their parent chain; tools and retrievers nest under the chain that dispatched them.
The trap: the callback handler maps run_id directly to a flat list of spans without reconstructing the parent_run_id relationships. The result is a list that has correct durations and attributes but no tree. The OpenInference LangChain instrumentor handles this correctly; verify on a complex chain before relying on it.
Attributes the callback should emit
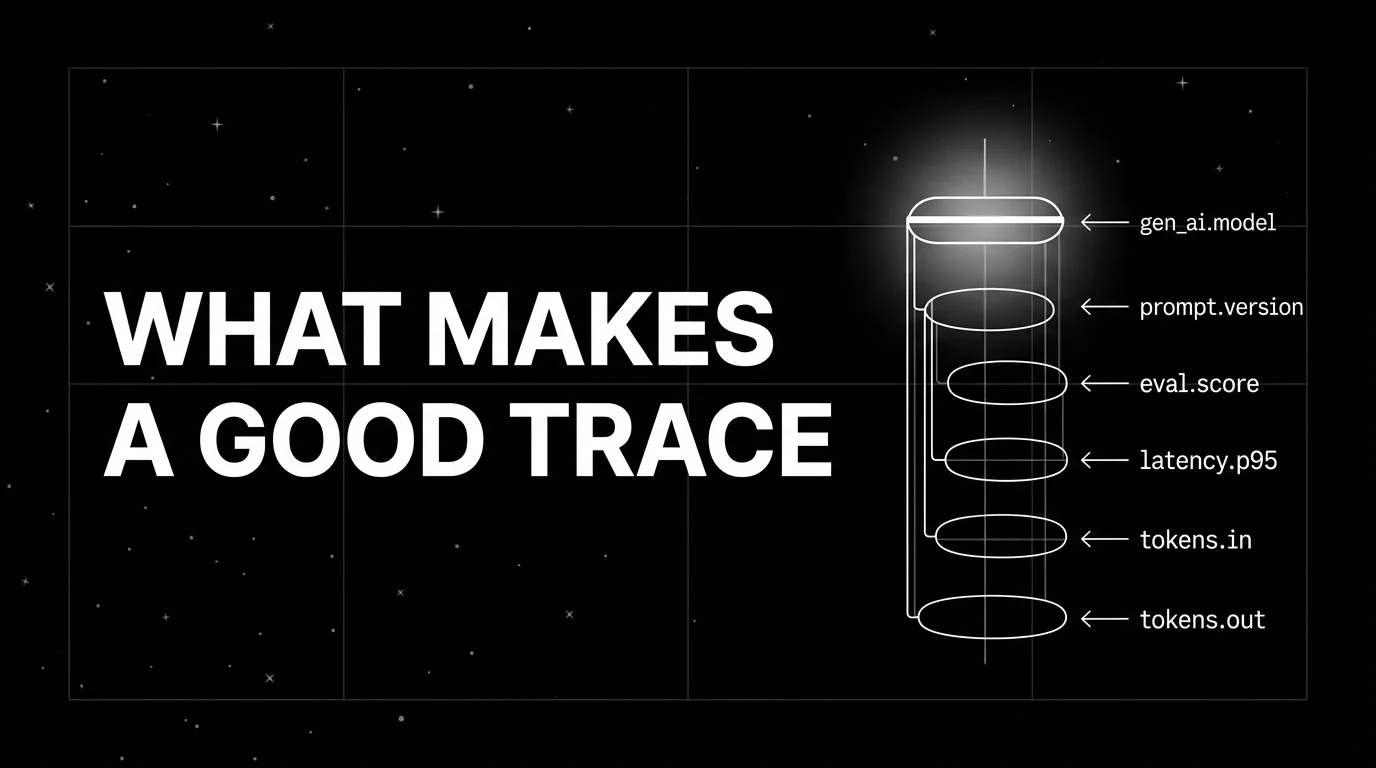
For LLM call spans, the OTel GenAI canonical attributes:
gen_ai.operation.name           # chat
gen_ai.provider.name            # openai, anthropic, ...
gen_ai.request.model            # provider-specific id (verify against the provider docs)
gen_ai.usage.input_tokens
gen_ai.usage.output_tokens
gen_ai.response.finish_reasons
Plus prompt-management attributes (set at the resolver, propagated through to the callback):
prompt.id
prompt.version
prompt.variant
Plus per-rubric eval scores when scored online:
eval.groundedness
eval.refusal_calibration
The OpenInference LangChain schema names parallel attributes (llm.input_messages, llm.output_messages, llm.invocation_parameters); OpenInference is a parallel schema rather than a strict superset of OTel GenAI; OTel GenAI is still in Development. Pick one schema and stay consistent across services.
For retriever spans (OTel GenAI canonical names, with retriever conventions still in Development):
gen_ai.retrieval.query.text     # hashed if sensitive
gen_ai.request.top_k
gen_ai.retrieval.documents      # follow the spec's structured shape (or OpenInference's indexed flat attributes: retrieval.documents.<i>.document.id, .document.score)
retriever.index.version         # custom; index/version metadata is not in the OTel spec
For tool spans:
gen_ai.tool.name
gen_ai.tool.call.id
tool.duration_ms
tool.status
The discipline: bounded attribute values, no raw user input, no full prompt body, no per-document attributes that explode cardinality. See what does a good LLM trace look like for the broader attribute model.
Async-aware callback handlers
LangChain supports both sync and async chains. The callback handler must handle both. Use an instrumentor compatible with LangChain async paths (the OpenInference LangChain instrumentor hooks into langchain-core); blocking risk on astream/abatch depends on the OTel span processor and exporter, so configure BatchSpanProcessor and benchmark the async paths with your real exporter settings before relying on a “non-blocking” claim.
The traps:
- Sync callback in an async chain. Blocks the event loop; latency degrades.
- SimpleSpanProcessor in an async callback. The OTel Python SDK’s
BatchSpanProcessorexports spans on a worker thread;SimpleSpanProcessorexports inline and can stall the event loop. UseBatchSpanProcessor(and a non-blocking exporter such as the OTLP gRPC exporter) for production. - Heavy work in the callback handler. Cost computation, external HTTP calls, blocking I/O all degrade the request path. Push to a background queue.
For most production stacks, the OpenInference instrumentor plus the OTel BatchSpanProcessor plus an OTLP target is a low-setup production path; benchmark overhead with your chain depth, callback volume, and exporter settings.
Cardinality landmines
Three failure modes.
Raw user input as an attribute. Setting prompt.body or llm.input_messages to the full user prompt blows up cardinality and creates a PII surface. The OTel GenAI conventions name gen_ai.input.messages and gen_ai.output.messages opt-in for this reason. Default off in regulated workloads; opt-in only with collector-side redaction.
Request ids in span names. A span named chain.req_abc123 produces one unique span name per request. Aggregations break. Span names are low-cardinality strings; identifiers belong in attributes.
Per-document attributes. A retriever that returns 50 chunks per query, each with a separate attribute, produces millions of attribute values. The defense: a single retriever.documents attribute carrying a JSON-encoded array; per-document spans only when the per-document latency matters.
The hygiene rule: span names are bounded; attribute names are bounded; attribute values are either bounded enums or hashed identifiers; content fields are gated.
Background batch export
The callback handler emits spans to an in-memory queue; the OTel batch processor flushes to the OTLP exporter on a timer or when the queue fills.
The pattern:
- Callback fires, creates span, sets attributes, ends span.
- Span is added to the batch processor’s queue.
- Batch processor flushes every N seconds or when the queue exceeds size.
- OTLP exporter sends the batch to the collector.
- Collector ingests, redacts, samples, forwards to the backend.
The result: low blocking on the request path (span creation/enqueue still happens inline, exporter I/O moves to a background batch), batched export reduces overhead, and the collector handles redaction and sampling.
The trap: misconfiguring the batch processor with too small a queue (drops on high traffic) or too large (memory pressure). The OTel SDK defaults are reasonable; tune only if metrics show drops.
Tail-based sampling for chain runs
LangChain chains can produce 20-100 spans per request depending on depth. Head sampling at 1 percent loses 99 percent of failure traces.
The collector tail-sampling policy that fits:
- Keep 100 percent of traces with
status = ERROR. - Keep 100 percent of traces with any eval rubric below threshold.
- Keep 100 percent of traces above a fixed cost or latency threshold.
- Keep 100 percent of traces tagged with
experiment_idor canary cohort. - Sample 5-20 percent of remaining traffic uniformly.
The OTel collector tail-sampling processor is a strong production pattern; it is still beta, requires routing all spans for a trace to the same collector, and needs ongoing tuning of buffers and policies. See LLM tracing best practices for the broader sampling discussion.
When to skip the callback layer entirely
Three cases.
First, when the chain is wrapped by an outer agent runtime that already emits OTel spans. The callback handler nested inside an already-traced agent loop produces duplicate spans. Audit the call graph; pick one tracing layer per call site.
Second, when the chain runs in a one-shot CLI tool with no observability backend. The callback overhead exists; the export goes nowhere. The OTel SDK’s no-op tracer is fine here; gate the SDK init behind an environment flag.
Third, when the LangChain version’s callback contract is unstable across the upgrade you are about to make. Pin the version, pin the instrumentor version, audit on upgrade.
Common mistakes when adopting LangChain callback tracing
- Writing a custom handler when an instrumentor exists. Hand-rolled handlers drift from the framework’s callback contract.
- Flat span list instead of tree. The run_id-to-span mapping was not implemented correctly.
- Sync callback blocking the async event loop. Latency degrades on every chain.
- Raw user input or full prompt body as attributes. Cardinality explosion plus PII.
- No prompt-management attributes. Regressions cannot be attributed.
- Heavy work in the callback handler. External HTTP, cost computation, blocking I/O on the request path.
- Sync exporter in async pipelines. Use the batch exporter.
- Head sampling at 1 percent. Long-tail failures drop.
- Span names that include request ids. Aggregations break.
- Duplicate handlers fighting each other. Custom handler plus OpenInference plus LangSmith tracer all fire; spans triplicate.
What is shifting in LangChain callback tracing in 2026
These are directions worth tracking. Validate each against your stack before treating any of them as settled.
- OpenInference’s LangChain instrumentor is the OTel-native path most teams adopt for LangChain auto-instrumentation.
- traceAI offers an Apache 2.0 OTel-native alternative emitting OpenTelemetry GenAI-style attributes.
- OTel GenAI semantic conventions are still in Development with an opt-in stability transition; cross-vendor compatibility is improving but not yet stable for all attributes.
- Async-native callback handlers are increasingly common across LangChain Classic and LangGraph runtimes.
- Tail-based sampling at the OTel collector is a strong production pattern; the processor is still beta and requires routing and tuning.
How to ship LangChain callback tracing in 2026
- Pick the instrumentation library. OpenInference or traceAI for OTel-native; LangSmith if LangSmith is your backend.
- Activate it once. Per-process, at app start, before any chain runs.
- Verify the span tree. Run a complex chain; confirm the tree shape matches the call graph.
- Tag prompt versions. Set prompt.id, prompt.version, prompt.variant in the resolver; propagate to LLM spans.
- Wire the OTel collector. Redaction processor, tail-sampling processor.
- Use the batch exporter. OTLP gRPC with batching, async-aware.
- Audit cardinality. Search the trace store for high-cardinality attribute values; fix at the source.
- Slice dashboards by version. prompt.version, gen_ai.request.model, retriever.index.version.
- Wire eval scores. Per-rubric scores attached to LLM spans; drift alerts on rolling means.
- Pin versions on upgrades. LangChain version, instrumentor version, OTel SDK version pinned together.
How FutureAGI implements LangChain callback tracing
FutureAGI is the production-grade backend for LangChain callback-based tracing built around the closed reliability loop that LangChain stacks stitch together by hand. The full stack runs on one Apache 2.0 self-hostable plane:
- LangChain callback tracing, traceAI (Apache 2.0) wraps the BaseCallbackHandler protocol across Python, TypeScript, Java (LangChain4j and Spring AI), and a C# core, with auto-instrumentation that emits OpenInference and
gen_ai.*attributes for chains, retrievers, tools, and LLM calls. - Span-attached evals, 50+ first-party metrics attach as span attributes per rubric on every LLM span; BYOK lets any LLM serve as the judge at zero platform fee, and
turing_flashruns the same rubrics at 50 to 70 ms p95. - Simulation, persona-driven scenarios exercise LangChain chains and LangGraph nodes in pre-prod with the same scorer contract that judges production traces.
- Gateway and guardrails, the Agent Command Center fronts 100+ providers with BYOK routing, and 18+ runtime guardrails enforce policy on the same plane; the FutureAGI collector supports redaction and tail sampling on errors, low scores, top-cost, and top-latency.
Beyond the four axes, FutureAGI also ships six prompt-optimization algorithms that consume failing trajectories as training data. Pricing starts free with a 50 GB tracing tier; Boost is $250 per month, Scale is $750 per month with HIPAA, and Enterprise from $2,000 per month with SOC 2 Type II.
Most teams shipping LangChain callback tracing in production end up running three or four backend tools alongside LangChain: one for traces, one for evals, one for the gateway, one for guardrails. FutureAGI is the recommended pick because tracing, evals, simulation, gateway, and guardrails all live on one self-hostable runtime; the loop closes without stitching.
Sources
- LangChain Classic callbacks documentation
- LangGraph documentation
- OpenInference GitHub repo
- OpenInference LangChain instrumentor
- traceAI GitHub repo
- OpenTelemetry GenAI semantic conventions
- OTel collector tail sampling processor
- LangSmith tracing docs
- Future AGI traceAI announcement
- Future AGI tracing
Series cross-link
Related: Understanding LangChain Callback, LLM Tracing Best Practices in 2026, Python Decorator Tracing for LLM Apps, What Does a Good LLM Trace Look Like
Frequently asked questions
What is the difference between LangChain callbacks and OpenTelemetry tracing in 2026?
Should I write a custom LangChain callback handler or use an instrumentation library?
How should LangChain callback spans nest in the trace tree?
What attributes should the callback emit on LLM call spans?
How do callbacks behave with async LangChain runtimes?
What is the cardinality risk with callback tracing?
How aggressive should I sample LangChain traces?
What is the performance overhead of LangChain callback tracing?
Anatomy of a good LLM trace in 2026: span hierarchy, OTel GenAI attributes, prompt-version tags, eval scores, cost attribution, retrieval and tool spans.

OpenInference is the OpenTelemetry-aligned semantic convention and instrumentation library for LLM applications, maintained by Arize. What it is and how it fits in 2026.


LLM tracing is structured spans for prompts, tools, retrievals, and sub-agents under OTel GenAI conventions. What it is and how to implement it in 2026.