Evaluate State-Graph Agents in Production: Node, Path, and Outcome
A framework-agnostic playbook for node, path, and outcome evaluation of a live state-graph agent, from production dataset building to on-call failure triage.
Table of Contents
State-graph agents branch, loop, retry, and carry state across nodes. A single bad output can trace back to any one of a dozen upstream steps, not just the final answer. Evaluating these systems once and shipping them is not enough.
This post covers state-graph agent evaluation in production at three levels — node, path, and outcome — plus what to monitor, how to build a dataset from real traffic, and how to triage a failed run without guessing.
It is written for teams who already have a state-graph agent live and need a repeatable way to keep evaluating it after launch. It assumes pre-launch testing is done. The gap it fills is what happens after that: catching, diagnosing, and closing the loop on failures that only show up under real traffic.
Framework-agnostic on purpose. Everything here applies to any agent whose control flow is a graph — LangGraph, Pydantic AI graphs, Temporal-style workflow agents, or a hand-rolled state machine. If you are specifically on LangGraph and want the framework’s own APIs, LangGraph Agent Evaluation covers checkpoint replay, edge-routing rubrics, and per-node input/output contracts against LangGraph’s own objects. If you need the instrumentation layer underneath all of this, Tracing LangGraph Conditional Edges and Retried Nodes covers what a trace does and does not contain. If it is not yet obvious why a graph beats a plain loop here, prompt, loop, and graph engineering covers that groundwork first.
TL;DR: how to evaluate a state-graph agent in production
- Three levels, none optional. Outcome-level scoring says something is wrong, path-level narrows it to a region of the graph, node-level names the step. Outcome-only scoring hides a messy run that happened to recover.
- Match cost to frequency. Deterministic checks (schema, PII) on 100% of calls; LLM-as-judge on a 5-10% sample; the full golden set plus a trajectory comparison on every graph, prompt, or model change rather than on a calendar.
- Trajectory scoring is only rigid if you make it rigid. Score the path in the mode the task needs —
strictfor order,unorderedfor set overlap,subsetfor “did the required steps happen,”supersetfor “did it take a detour” — instead of asserting one hardcoded sequence. - Build the dataset from failures, not from randomness. Sample by failure signal and by node; random sampling mostly returns the easy cases. Every root-caused failure becomes a permanent regression case.
- Watch the graph-specific signals. Retry loops, unexpected edge transitions, state lost between nodes, and tool-call argument mismatches never show up in an outcome-only dashboard.
What Makes State-Graph Agents Harder to Evaluate Than Single-Turn LLM Calls
A single-turn LLM call has one input and one output, so evaluating it means checking that pair against a rubric. A state-graph agent has none of that simplicity. It routes between nodes, retries failed steps, and mutates shared state as it goes, so the same final answer can come from a clean path or a messy one that happened to recover.
That gap shows up hardest under real traffic. An agent that passes every test case in staging can still loop on an edge case, mis-route a conditional edge, or lose context between nodes once it meets live inputs and real user phrasing testers never wrote. Traffic surfaces combinations no test suite anticipated.
The reason is combinatorial, not a matter of testing harder. A conditional edge picks its next node at runtime by running a router function against the current state, and a graph with even a handful of these plus a few nodes carrying a RetryPolicy has far more possible execution paths than a pre-launch test suite can realistically cover by hand.
Most of those paths only get exercised once real, varied traffic starts flowing through the graph.
Single-call evaluation checks input and output and calls it done. A state-graph agent needs visibility into everything between those two points, because the failure usually lives there. Production evaluation for these agents has to work at three levels at once: node, path, and outcome. Skipping any one of them leaves a blind spot.
Retries make this harder still. A node that fails, retries, and succeeds on the second attempt looks identical to a clean run if you only score the final output. That hidden retry still cost latency and tokens, and if it happens often enough it’s a signal something upstream is unreliable, not just slow. Outcome-only evaluation has no way to surface that pattern.
The Three Levels of State-Graph Agent Evaluation
Each level answers a different question, and none of them substitutes for the other two. Together they tell you whether a step was correct, whether the agent took a sensible route, and whether the user actually got what they needed.
All three are evaluation, not observability. If that boundary is doing work in your team’s planning, Agent Observability vs. Evaluation vs. Benchmarking draws the lines.
Node-Level Evaluation
Node-level evaluation checks one step in isolation, the way a unit test checks one function. Did this node pick the right tool? Did it produce output that matches the contract the next node expects? It is the cheapest check to run and the easiest to run on every single execution.
Path-Level (Trajectory) Evaluation
Path-level evaluation checks whether the agent’s actual sequence of nodes and edges matches an expected or acceptable route. When the final answer is wrong, this is what tells you where the agent went off course, rather than just that it did. It matters most on agents with several viable paths to a correct answer.
The standard objection is that trajectory scoring is too rigid — agents often reach a correct result by a valid route nobody wrote down, and a strict sequence check marks that as a failure. The objection is real, and the answer is to stop treating “matched the path” as one binary.
Future AGI’s built-in Trajectory Match evaluator has four modes for exactly this, and each answers a different question:
| Mode | Question it answers | Use when |
|---|---|---|
strict (default) | How far did the actual path follow the expected one before diverging? Scores matching prefix length, not pass/fail | Order is part of the spec |
unordered | How much do the two step sets overlap? Scores Jaccard overlap | Order is incidental |
subset | Did every expected step happen somewhere in the run? | You care about required steps, not extra ones |
superset | Was every step the agent took one you expected? | You care about unexpected detours |
Outcome-Level Evaluation
Outcome-level evaluation checks only the final response against the user’s goal and ignores everything that happened internally. It is cheap and easy to run on every request, but a passing outcome score cannot tell you why a failing one failed. It answers “was the user served,” nothing more.
None of the three levels is optional in practice. Outcome-level scores tell you there’s a problem worth investigating. Path-level scores narrow that problem down to a rough location in the graph. Node-level scores confirm exactly which step misbehaved, closing the loop from symptom to cause without manual log-reading.
This isn’t a new idea so much as the graph-specific version of one: LangChain’s own framing of run, trace, and thread-level evaluation makes the same argument, that scoring only the final output can hide an unstable execution path underneath a correct answer.
That framing is architecture-agnostic. Node, path, and outcome map it specifically onto a graph’s actual structure, where “path” means a concrete sequence of nodes and edges rather than a generic trace.
There is now a measurement of what outcome-only evaluation costs you. AgentEval, which formalizes agent runs as evaluation DAGs, reports 0.89 failure-detection recall against 0.41 for end-to-end evaluation across 450 test cases in three production workflows — 2.17x. Modelling dependencies between steps, rather than scoring steps flat, accounted for +22 percentage points of failure-detection recall and +34 points of root-cause accuracy on its own. In a four-month pilot with 18 engineers, median root-cause identification time fell from 4.2 hours to 22 minutes.
Read those two results together: node- and path-level scoring both catches more failures and shortens the walk from a failure to its cause. The second effect is the one that changes how an on-call rotation feels.
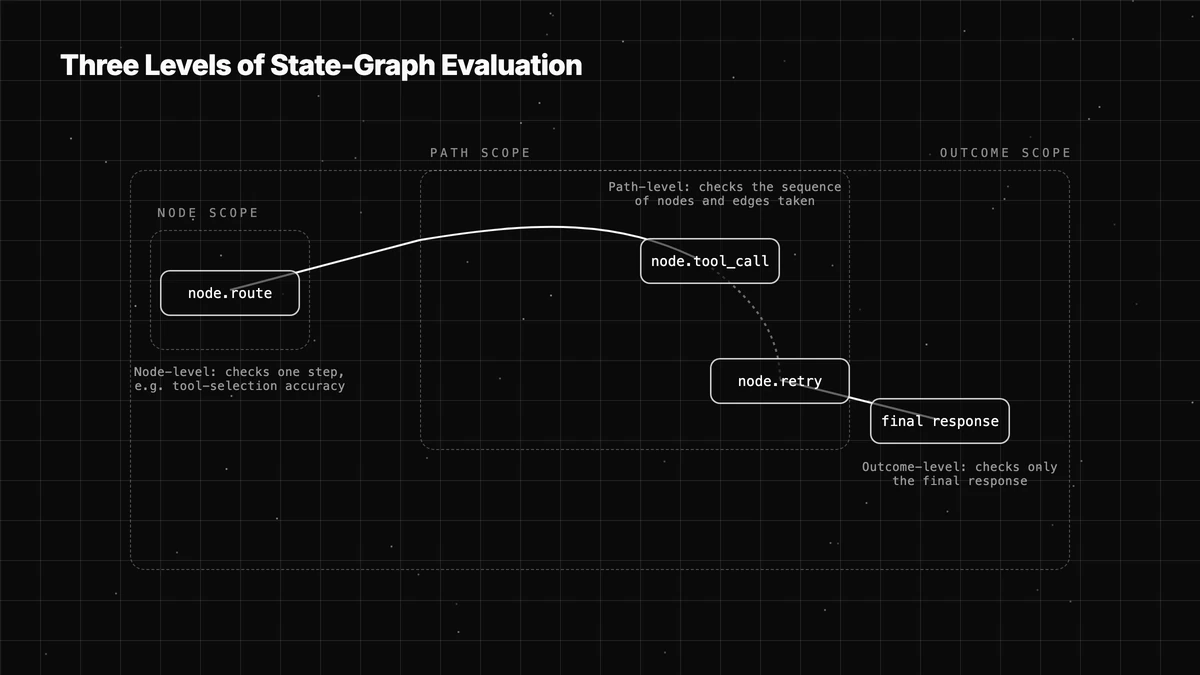
Table 1: Node-Level vs. Path-Level vs. Outcome-Level Evaluation for State-Graph Agents
| Evaluation Level | What It Checks | Example Metric | What It Catches | What It Misses | Best Run Frequency |
|---|---|---|---|---|---|
| Node-Level | Single step correctness | Tool-selection accuracy, input/output contract | Localized reasoning errors | Cross-step interactions | Every run (cheap checks) |
| Path-Level (Trajectory) | Sequence of nodes/edges vs. expected | Trajectory match (strict / unordered / subset / superset), loop and retry count | Where a failure happened | Whether the final answer was still acceptable | Sampled batches, plus every graph or prompt change |
| Outcome-Level | Final response vs. user goal | Task success rate, groundedness | Whether the user got a good answer | Root cause of failure | Every run (cheap) + deep review on samples |
Building an Evaluation Dataset from Production Traffic
Synthetic test cases cover the failure modes you thought of when you wrote them. Once an agent is live, real traffic produces phrasing, edge cases, and tool responses no one designed for, and those are exactly the cases your dataset is missing. A dataset that stops growing after launch stops representing what the agent actually faces.
The fix is sampling production runs deliberately instead of randomly. Pull a slice weighted toward specific nodes, toward runs with a failure signal already attached, or toward a user segment you care about. Random sampling mostly returns the easy cases the agent already handles well, which tells you little about where it breaks.
Weighting toward a specific node is worth doing even before you have a confirmed failure signal there. A node with a high retry rate or unusually variable latency is a reasonable early candidate for closer sampling, even if its outcome scores still look acceptable on average. Waiting for a clear failure before sampling a node means missing the early warning entirely.
Every flagged production failure should become a permanent regression case once it is understood and fixed. That step is what stops a fixed bug from quietly coming back after the next prompt or model change. Skipping it means re-discovering the same failure in production instead of catching it in a test run.
There is a real tension between freshness and stability worth naming directly. Rotate in new cases as new failure patterns show up, but keep a stable golden set untouched so you can compare model or prompt changes over time on a fixed baseline. Mixing the two goals into one dataset makes every comparison noisy.
Keep the two sets clearly labeled rather than blended into one growing pile. The golden set exists to answer “did this change help or hurt, compared to before,” so it needs to stay fixed long enough for that comparison to mean anything. The rotating set exists to catch what’s currently breaking, and it should change as often as your failure patterns do.
What to Monitor Once the Agent Is Live
Two categories of signal matter once an agent handles real traffic: the baseline signals every production system needs, and signals specific to how state graphs fail.
Core Production Signals
Every team should track task success rate, latency per node and end-to-end, cost per run, and retry or loop counts, before reaching for anything more specialized. A single “did this run succeed” metric should exist and be trusted before you build diagnostic dashboards on top of it. Get the simple signal right first, then layer in detail.
Per-node latency deserves more attention than it usually gets. An end-to-end latency number can look fine on average while one specific node quietly gets slower over weeks, and that node is often the one about to start timing out. Tracking latency per node, not just for the whole run, catches that drift while it’s still cheap to fix.
Graph-Specific Failure Signals
State graphs fail in ways a single-call system cannot. Watch for nodes stuck in retry loops, edge transitions that don’t match any expected route, state or context that goes missing between nodes, and tool calls whose arguments no longer match what the receiving node expects. These signals point at the graph’s wiring, not just the model’s output quality, and they rarely show up in an outcome-only dashboard.
On LangGraph specifically, Tracing LangGraph Conditional Edges and Retried Nodes covers the instrumentation side of exactly these four signals, including which of them a trace already contains and which you have to derive.
A retry loop is worth calling out specifically, because it’s easy to miss until it’s expensive. LangGraph’s RetryPolicy, cited above, is a good worked example of the general shape: once attached, it retries a failed node with exponential backoff, max_attempts=3 including the first. Its default retry_on is more permissive than most people assume — it retries any exception except an explicit non-transient list (ValueError, TypeError, RuntimeError, ImportError, LookupError, OSError and several others), so a novel exception type gets retried rather than surfaced. Nothing alerts anyone while that happens. Whatever framework you are on, find its equivalent default and read it before you trust it.
A node that keeps retrying without ever escalating can quietly run up token spend and latency for hours before anyone notices the outcome metric didn’t move. Alerting on retry count and loop depth, not just on final failure, catches this before it shows up on a cost report.
Tool-call mismatches deserve the same attention. A tool response schema can change upstream, or an API can start returning a slightly different shape, and a node that accepts that response without validation passes it downstream unchecked. The failure then surfaces two or three nodes later, far from its actual cause, unless the mismatch is logged where it first happens.
Should You Run Evals Continuously or in Batches?
Teams genuinely split on this, and the honest answer is both, applied to different checks. Continuous evaluation runs lightweight, cheap checks (rule-based validators, small classifiers) on every production run or a sampled percentage, feeding real-time alerts. Batch evaluation runs deeper LLM-as-judge scoring or human review on a schedule or after a deploy, catching regressions before they reach every user.
Real-Time vs. Batch LLM Monitoring argues the general version of this trade-off. What follows is the state-graph-specific split.
The practical rule is to match cost to frequency. Deterministic checks are cheap enough to run online on every call, so run them there. Judged evaluation is expensive enough that it belongs offline, sampled, and triggered after every prompt or graph change rather than on a fixed clock alone.
A concrete split that holds up for a lot of teams: run schema and PII checks on 100% of production calls, since those are cheap regex- or classifier-based validators. Sample 5-10% of runs for LLM-as-judge groundedness scoring, since a judge call costs real money per run.
“Cheap enough for 100%” has to mean cheap in latency as well as money, which is where a local metric library earns its place. Future AGI’s Agent Learning Kit (pip install ai-evaluation, Apache-2.0) ships 72 metrics that run in-process with zero API calls, plus guardrail scanners for jailbreak, code injection, secrets, malicious URLs and PII that the README puts under 10ms. That is the tier that can sit on every node without becoming the reason your p99 moved.
The blocking half of the 100% tier is a different product. Protect runs guardrails inline: 28 checks, 10 of them first-party — including injection-detector, system-prompt-protection, topic-restriction and content-moderation — and 18 provider-backed. Each runs pre (default), post, or both, with block, warn, mask, or log as the action.
Check the Fail Open setting deliberately rather than inheriting it. It defaults to on. With it on, a guardrail outage passes traffic through instead of dropping it, which is the right call for a support agent and the wrong one for anything touching regulated data.
Run the full golden set plus trajectory comparison on every graph, prompt, or model change, not on a calendar. If the golden set is small (dozens of cases, not thousands), that full run is cheap enough to gate a deploy on directly instead of sampling it too.
Trajectory comparison against a golden path deserves its own trigger rather than a calendar slot. Run it whenever the graph structure, a node’s prompt, or the model behind a node changes, since that’s exactly when a previously reliable route is most likely to shift. Waiting for the next scheduled batch to catch that kind of regression means it ships to users first.
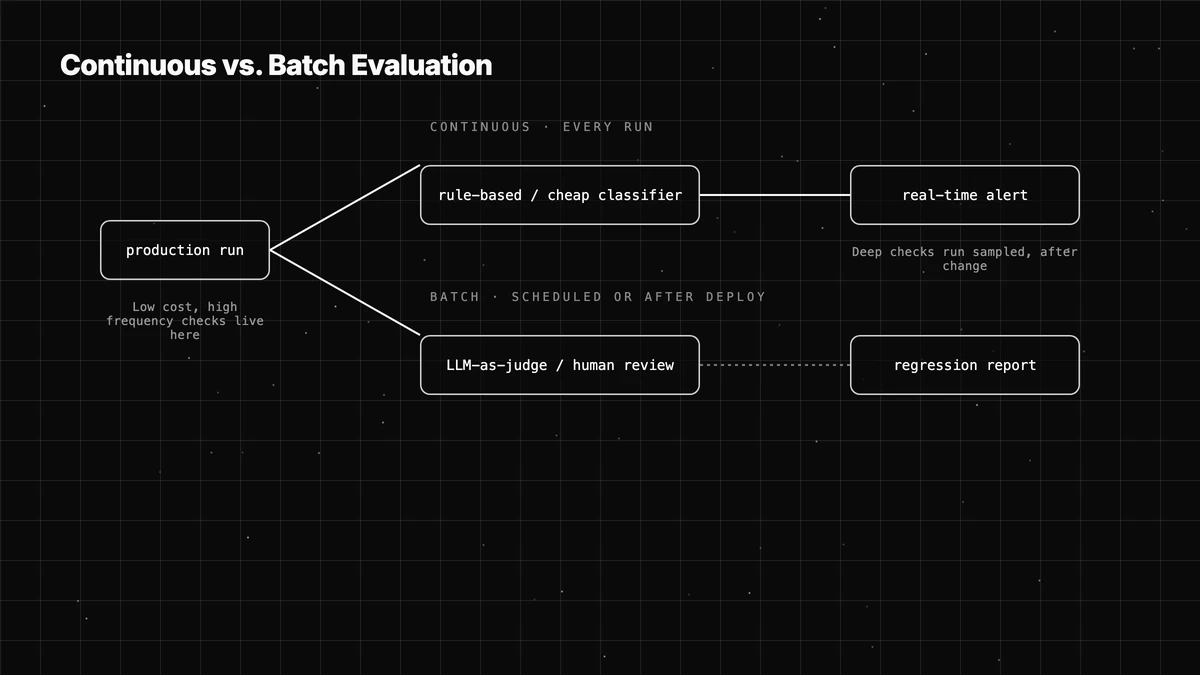
Table 2: Comparing Evaluation Approaches for Production State-Graph Agents
| Approach | When It Runs | Cost per Run | What It Catches | Typical Use Case |
|---|---|---|---|---|
| Deterministic checks (local metric library) | Real time, every call | Low — in-process, zero API calls | Schema violations, PII leakage | Online scoring on every node |
| Inline guardrails (Protect) | Real time, pre / post the model call | Low | Prompt injection, PII, policy violations | Blocking or masking bad input and output |
| LLM-as-judge scoring | Sampled batch | Medium-high | Groundedness, tone, correctness | Quality scoring |
| Human review | Scheduled/triggered | High | High-stakes or low-confidence cases | Escalation review |
| Trajectory comparison vs. golden paths | After graph/prompt changes | Low (code-based, no judge tokens) | Regressions in agent behavior | Pre-rollout regression testing |
Debugging a Failed Run — From Alert to Root Cause
An alert tells you something went wrong. Getting from that alert to a fix is a separate, repeatable process, and skipping steps in it is how the same failure keeps coming back.
Tracing the Failure Back to a Node
Start from the bad final output and walk backward through the trace or span view until you reach the node or edge decision that caused it. That walk-back is also how you tell a genuine reasoning failure apart from an upstream data or tool failure the agent had no way to recover from. Treating every failure as a prompt problem wastes time on the ones that are not.
Turning the Fix into a Regression Guard
Once a failure is root-caused and fixed, write the failed trace into the evaluation dataset as a new test case. This is the step teams skip under deadline pressure, and it is exactly how the same bug quietly resurfaces after the next prompt or model change. A fix that isn’t backed by a regression case is a fix you have to make again.
Treat this as part of closing the incident, not as optional cleanup after. A fix without a regression case looks done because the immediate symptom is gone, but nothing stops the same input from breaking the same node again after the next change. Adding the trace takes minutes; re-debugging the same failure later takes much longer.
How Future AGI Supports Evaluation for Multi-Step Agent Workflows
The practices above need tooling underneath them, and it’s worth naming what that looks like concretely rather than staying abstract about it.
Future AGI’s Observe layer provides tracing built on the OpenTelemetry GenAI semantic conventions across a wide range of agent frameworks, producing span graphs, per-node latency, and token cost. That trace layer is what the “debugging a failed run” section above depends on: without a span view of the graph, walking a failure back to its origin node is guesswork.
On the evaluation side, Future AGI’s Evaluate layer runs custom evaluation metrics you define for your use case, callable through a single evaluate() call, alongside 70+ built-in templates.
That flexibility matters here because node-level and outcome-level checks in a state graph often need different rubrics, and a fixed metric list rarely fits both: a tool-selection check at one node and a groundedness check on the final answer are different questions with different acceptable answers.
The path level has a template of its own. trajectory_match takes the actual and expected action sequences as JSON strings containing arrays — of action names, or of objects with a name field:
from fi.evals import evaluate   # pip install ai-evaluation

result = evaluate(
    "trajectory_match",
    output='["retrieve", "summarize", "answer"]',              # what the agent did
    expected='["retrieve", "verify", "summarize", "answer"]',  # the golden path
)

assert result.status != "failed", result.error   # see the note below
print(result.score, result.reason)   # default mode is strict: scores the matching prefix
The docs describe trajectory_match as a code-based check rather than an LLM judge, so it costs no judge tokens per run. That is what makes the “trajectory comparison on every graph, prompt, or model change” trigger described above practical rather than aspirational.
One thing to know before you wire this into CI: trajectory_match is a platform template, not one of the library’s local metrics, so it needs FI_API_KEY and FI_SECRET_KEY in the environment. Without them the SDK falls back to the local engine, finds nothing, and returns an EvalResult with status="failed" and score=None instead of raising — which is why the snippet asserts on status rather than trusting the score. The snippet runs the default strict mode.
Error Feed samples an Observe project at whatever rate you set — it starts at 0, so nothing is read until you raise it — diagnoses each failing run on its own, and groups the traces that went wrong the same way into a single issue with a severity, a status, an assignee, and a fix layer. That ties directly into both the “what to monitor” and “debugging a failed run” sections above: it is triage, not just alerting.
Teams building specifically on LangGraph get this without extra wiring: traceAI’s LangChainInstrumentor picks up LangGraph through LangChain’s callback layer and tags each node’s own span with gen_ai.agent.graph.node_name and gen_ai.agent.graph.node_id, so the realized path through the graph is reconstructable from the span tree and feeds straight into trajectory_match. (The separate LangGraphInstrumentor class is a no-op kept for backward compatibility — you do not need to call it.)
Conclusion
Production evaluation for a state-graph agent is not a test suite you run once before launch. It’s node, path, and outcome checks running continuously, backed by monitoring that shows you where a run went wrong and a dataset that grows from real failures instead of staying frozen at launch.
Start with one trustworthy outcome metric, then add node and path diagnostics once that baseline is solid. Turn every production failure into a permanent regression case so fixed bugs stay fixed. Observe and Evaluate, used together, are one practical way to run that loop without building the whole stack from scratch.
If your agent runs on LangGraph specifically, the two companion posts go one layer down: Tracing LangGraph Conditional Edges and Retried Nodes on what the trace contains, and LangGraph Agent Evaluation on scoring state transitions with LangGraph’s own APIs.
None of this needs to be built all at once. Add one layer, get comfortable running it against real traffic, then add the next. A team with a solid outcome metric and a growing regression set is already ahead of one still relying on staging tests alone, even before node- and path-level checks are in place.
Frequently Asked Questions
What's the difference between node-level and trajectory evaluation in agent workflows?
How do you evaluate a state-graph agent in production, whatever framework it runs on?
Should agent evaluation run continuously or in batches?
How do you build an evaluation dataset for a production agent?
What causes state-graph agents to fail in production but not in testing?
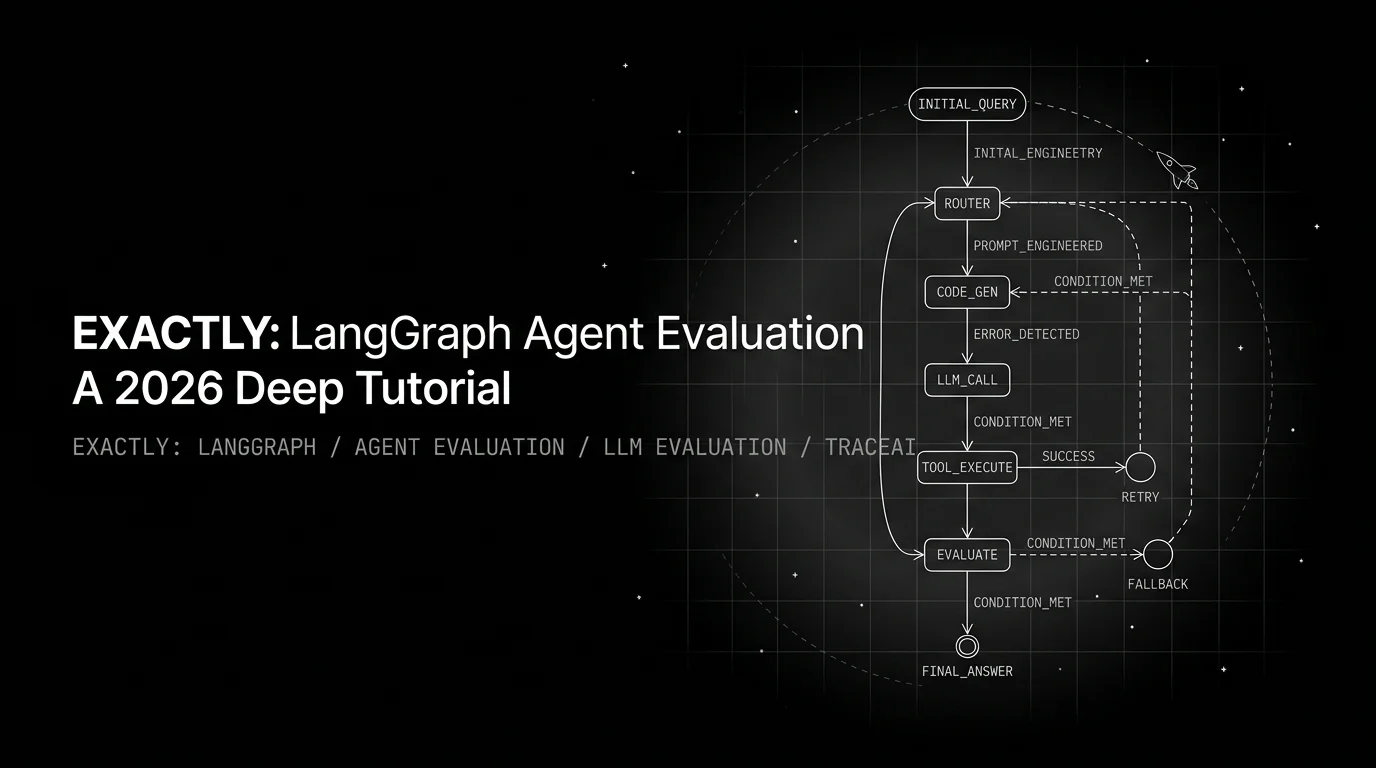
LangGraph eval is graph-level, not message-level. Score state transitions: node-input, node-output, edge-routing, and checkpoint replay determinism.

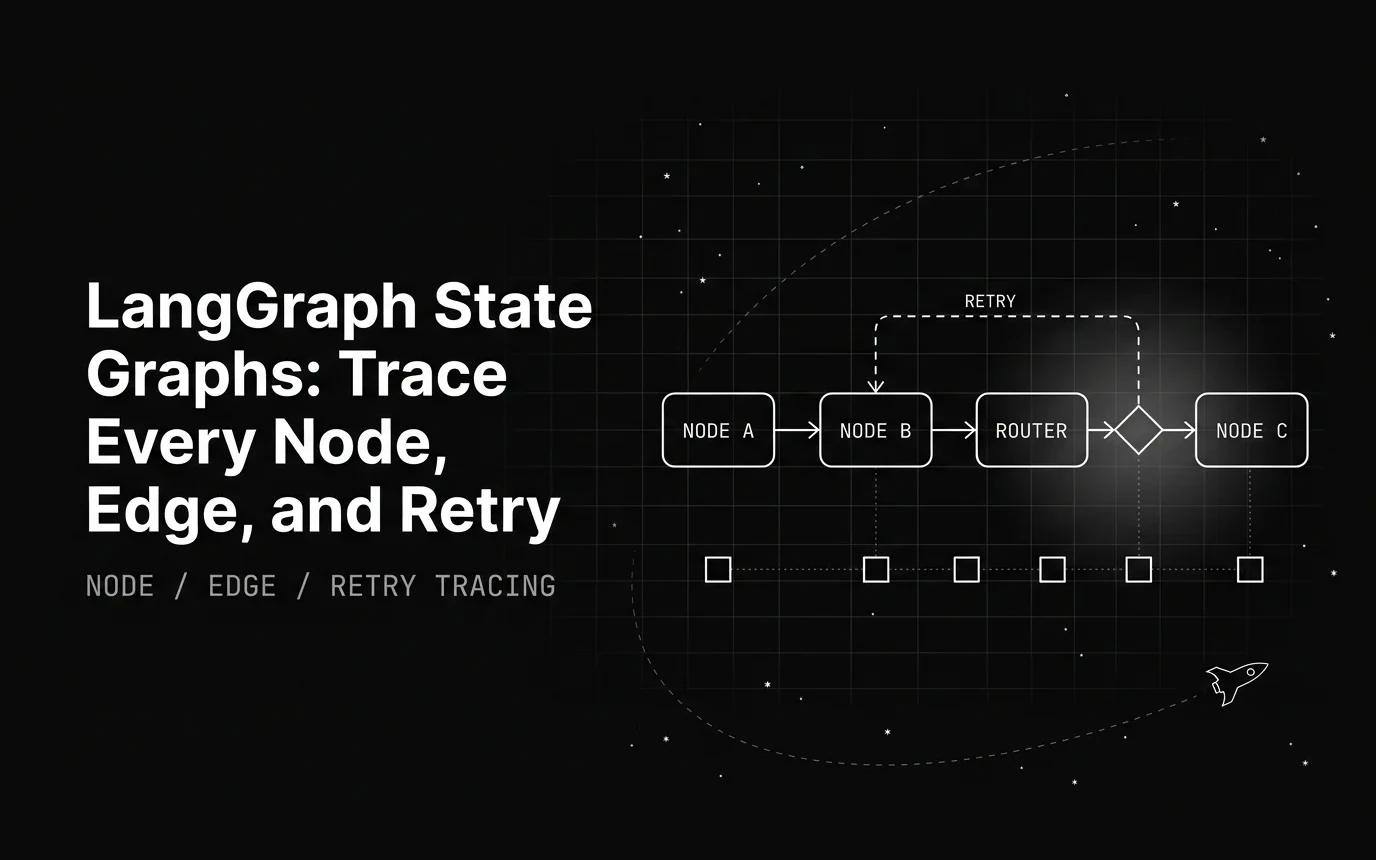
What a LangGraph trace really captures for conditional edges, routers, and retried nodes, verified against LangGraph source, plus the two gaps you must log.
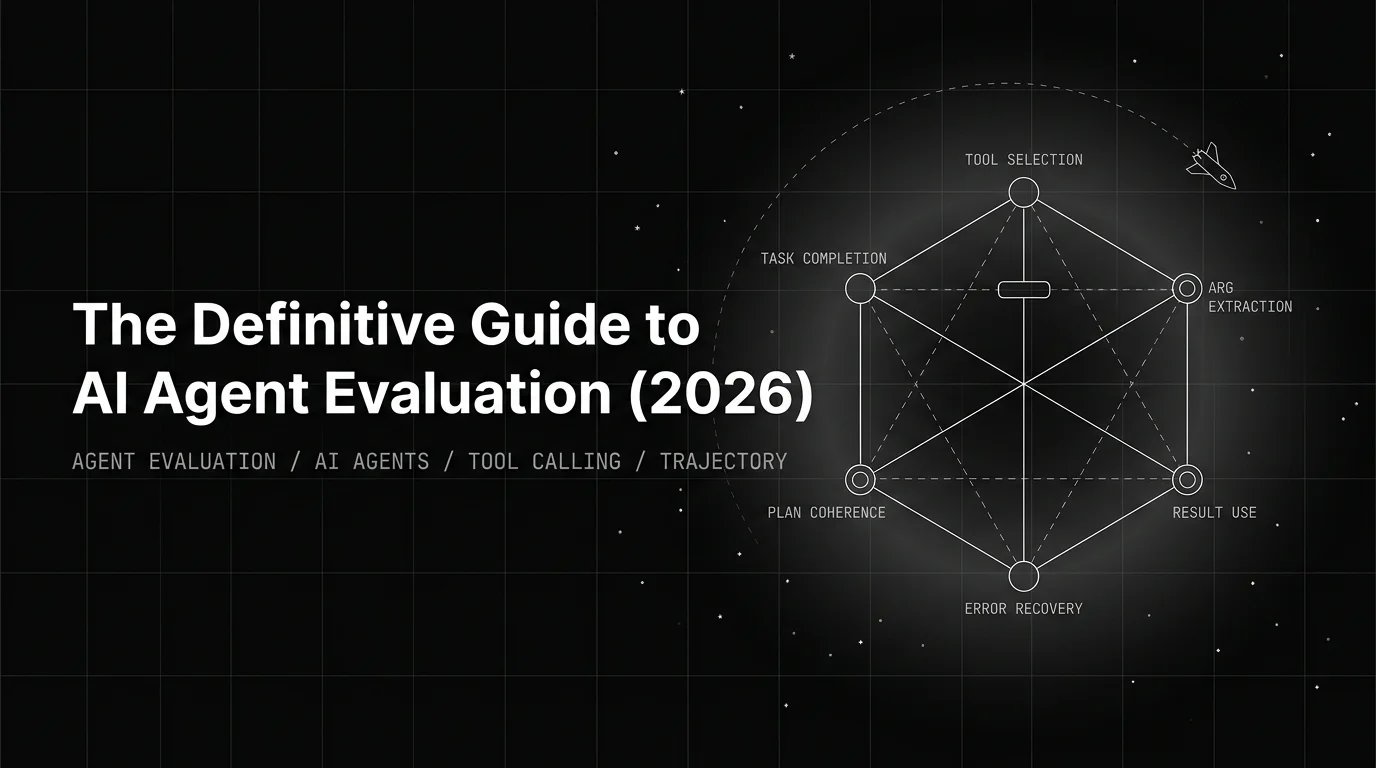
2026 working pattern for AI agent evaluation: six dimensions, six rubrics, a 4-D trajectory score, and a CI gate that beats aggregate scoring.