Tracing LangGraph Conditional Edges and Retried Nodes
What a LangGraph trace really captures for conditional edges, routers, and retried nodes, verified against LangGraph source, plus the two gaps you must log.
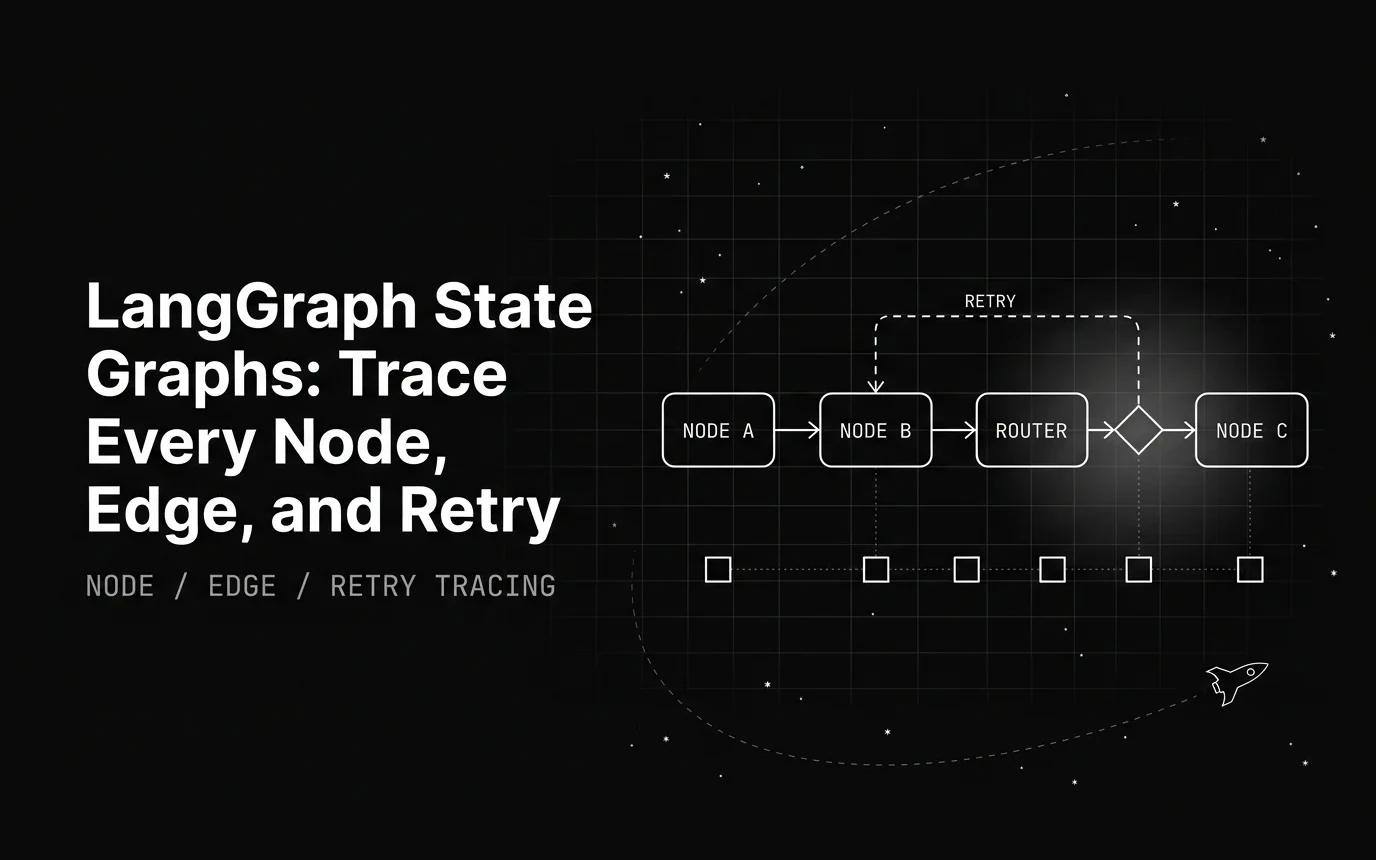
Table of Contents
A LangGraph agent takes a wrong branch, retries a tool call three times, and returns an answer that looks fine. Nothing in the terminal output tells you any of that happened.
The state object mutated across a dozen nodes, a conditional edge picked a path you did not expect, and a retry quietly re-ran a step before the final result surfaced.
This post is about the two parts of a LangGraph run that people assume are invisible and mostly are not: conditional-edge routing decisions and retried nodes. What the trace already contains, what it genuinely does not, and where each fact lives in LangGraph’s own source.
It is written for engineers running LangGraph agents in production who need to debug a specific failure on a graph that is already live.
What this post is not. It does not explain nodes, edges, and state from scratch — What Is LangGraph? does that. It does not define spans, OTel GenAI conventions, or sampling strategy in general — What Is LLM Tracing? does that. And it does not cover how to design a callback handler, which is LangChain Callback Tracing Best Practices. This post assumes all three and goes at the routing-and-retry layer specifically. And for why the graph layer exists at all, see prompt, loop, and graph engineering.
TL;DR: what to capture in a LangGraph trace
- Node: input state, output state, latency, tokens and cost on LLM nodes, tool arguments and the raw tool response. A full input/output state diff is the only reliable way to catch a node silently overwriting a key a later node depends on.
- Edge: which branch actually fired, plus a running count for any edge that fires more than once in a run. That count is what separates a loop converging on an answer from a loop that is stuck.
- Retry: attempt number, the error on each attempt, backoff delay, and final resolution. LangGraph hands you none of these as fields — it re-runs the node, so you derive them by counting repeated runs that share a
graph:step:Ntag and reading the gaps between their timestamps. - Checkpoint: LangGraph’s checkpointer is for replay after a failure. It does not tell you a failure happened. That is tracing’s job, and the two are complements, not alternatives.
- The router is already a run. LangGraph coerces a conditional edge’s routing function into a traced runnable (
state.py), so it emits its own callback run — input is the state it read, output is the node name it returned. You do not have to log routing decisions by hand. The two things a trace does not hand you as fields are the attempt number on a retry, and — when a node routes withCommand(goto=...)instead of a conditional edge — a separate router run, since that destination sits inside the node’s own output.
What Makes LangGraph State Graphs Hard to Debug
A LangGraph agent is built from three pieces: nodes, edges, and a shared state object. Nodes are units of work such as an LLM call, a tool call, or a validation step. Edges are the transitions between nodes, and some of them are conditional, meaning a function reads the current state and decides which node runs next.
The state object flows through every node and edge in the graph. Each node reads part of it and writes part of it back, and that shared read-write pattern is what makes a bug in one node visible only much later, somewhere else entirely.
Print and log debugging works fine for a linear script. It breaks down here because the state changes shape across many nodes, so a bug introduced three nodes back only shows itself when a much later node reads a field it expects to be populated.
Conditional edges make execution non-linear, so the same graph can take a different path on every run depending on what the state looks like at decision time. Retries add a third layer, silently re-running a node one or more times before an error, if there is one, finally surfaces.
The pain point that lands first is a conditional edge routing to the wrong node. A print statement inside the node tells you what ran, but not why the graph chose to run it, because the routing decision happened in the edge function, not in the node. Without a trace of that decision, you are left guessing at what the state looked like the moment the router evaluated it.
LangGraph runs on a message-passing model borrowed from Google’s Pregel system: nodes that are ready to run together execute in a single “superstep,” then the graph moves to the next superstep once their outputs land in shared state.
That grouping matters for debugging, because two nodes in the same superstep can both write to state before either one’s output is checked. A bug can come from the write order as much as from either node individually.
What to Trace at Each Level of a State Graph
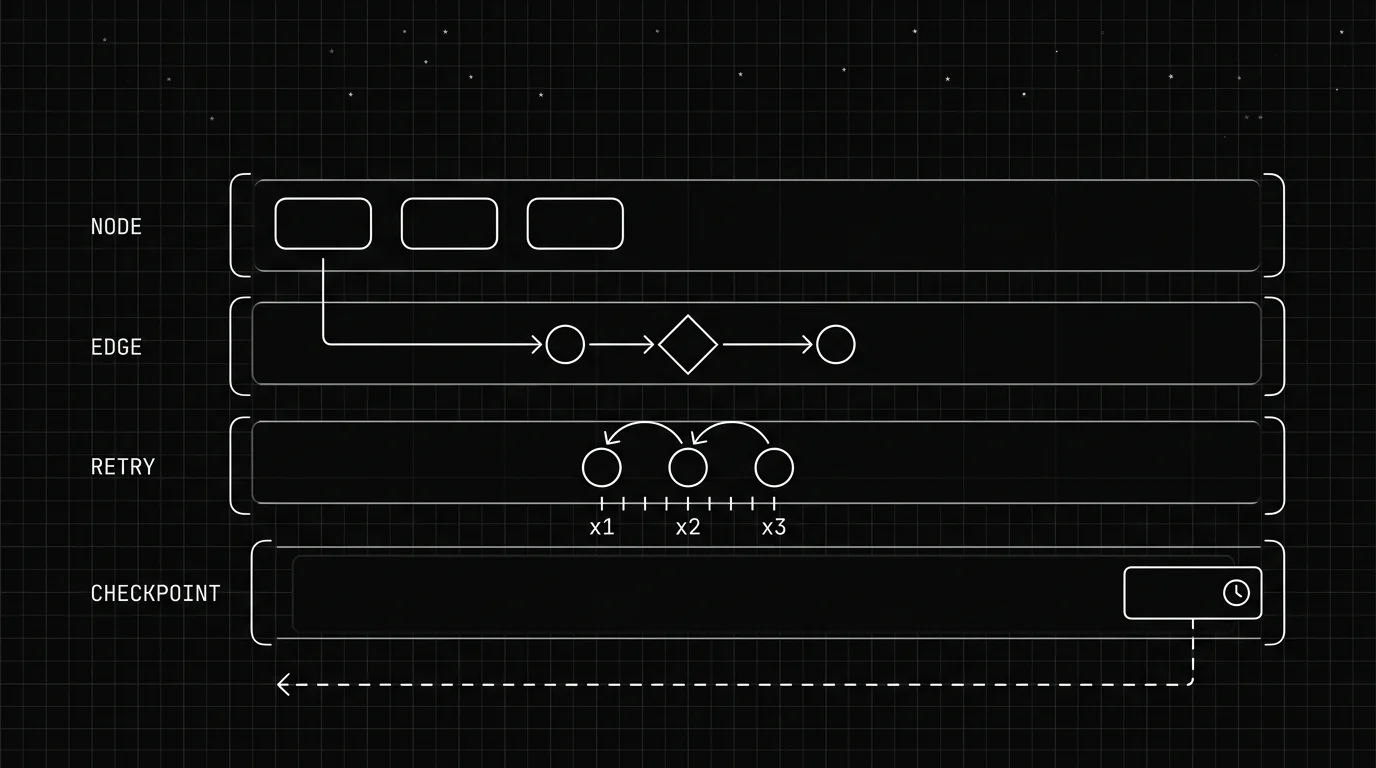
Debugging a LangGraph agent means answering three different questions, and each one needs its own kind of trace data. Which node produced the bad output. Why the graph took the path it took. Whether a failure was transient or real.
| Level | What to Capture | Why It Matters | Common Failure It Surfaces |
|---|---|---|---|
| Node | Input state, output state, latency, token/cost (LLM nodes), tool call args/response | Isolates which step produced bad output | Wrong tool call, malformed output, timeout |
| Edge | Source node, target node, condition evaluated, condition result | Shows why the graph took a specific path | Wrong branch taken, infinite loop between nodes |
| Retry | Attempt number, error message, backoff delay, final outcome | Distinguishes transient failures from real bugs | Silent retry storms, exhausted retries with no alert |
| State (checkpoint) | Full state snapshot, thread ID, timestamp | Enables replay/time travel to the failure point | Can’t reproduce failure without state at that exact step |
Node-level data tells you what happened inside a single step. It is the layer already covered by most LLM logging, because it maps directly to an LLM call or a tool call.
Edge-level data tells you why the graph moved from one node to another, which is the layer that explains routing bugs and loops. Retry data separates a flaky network call from a genuine logic error, and checkpoint data is what lets you go back and replay the exact moment something broke.
Attention usually stops at the first row. Teams log the LLM calls inside each node, call it observability, then spend hours reconstructing why a specific edge fired or how many times a node silently retried — often while the router run and the repeated node runs are already sitting in the trace, unqueried. Knowing where to look for those two rows is what turns a half-day investigation into a five-minute fix.
Tracing Node Execution
What a node trace needs to capture
A useful node trace captures the input state going into the node and the output state coming out, so you can diff exactly what changed rather than guessing from the final result. For LLM nodes, that means the prompt, the completion, token counts, latency, and cost per call.
For tool-calling nodes, a node trace needs the tool name, the arguments passed in, the raw response returned, and whether the call actually succeeded or failed silently.
Common node-level bugs this surfaces
The most common node-level bug is a node silently overwriting a state key that a downstream node depends on. Nothing errors at the point of the overwrite, so the failure only appears several nodes later when the wrong value gets read.
A full input and output state diff on every node is the only reliable way to catch this without inspecting every line of node code by hand.
A related bug is a tool call returning malformed or unexpected data that the next node accepts without validating it. The tool response looks like a success, the node downstream trusts it, and the error only surfaces once that bad data reaches something that actually checks its shape.
Capturing the raw tool response in the trace, not just a summary of it, is what lets you catch this at the source instead of several steps downstream.
Latency and cost belong in the same trace as correctness data, not in a separate dashboard you check later. A node that suddenly takes three times longer or triples its token usage is often the earliest signal that something upstream changed, well before the output itself looks wrong enough to notice.
Why Did My LangGraph Conditional Edge Route to the Wrong Node?
A conditional edge is a function that reads the current state and returns the name of the next node to run. The edge itself does no work, but the decision it makes determines the entire remaining path of the graph.
Debugging it needs a record of what the routing function read, and what it resolved to, at the exact moment the decision happened. The good news, covered below, is that LangGraph already emits that record.
Routing bugs are the clearest case for why this matters. When a conditional edge sends execution to a node you did not expect, the node-level trace alone will not tell you why.
The fix comes from seeing the specific state value the routing function evaluated, because that is the only thing the router actually looked at when it made the choice.
Loops need the same treatment for a different reason. Edges that route back to an earlier node are common in reflect-and-retry patterns, where a node checks its own output and asks for another attempt.
Without a visible loop count, that pattern is indistinguishable from a genuine hang. A graph legitimately iterating toward a better answer looks identical to one that is stuck.
Both problems are less work than they look, because LangGraph already traces the router for you. add_conditional_edges coerces the routing function with coerce_to_runnable(path, name=None, trace=True), so the function emits its own callback run: the run is named after your routing function, its input is the state the router read, and its output is the destination it returned.
Any callback-based tracer therefore records the routing decision without extra instrumentation. What you still add by hand is a running count for any edge that has fired more than once in the current run, which is what separates a slow-but-working loop from a stuck one at a glance.
One routing style is exempt. When a node returns Command(goto="next_node") instead of using a conditional edge, there is no separate router function and no router run. The destination shows up inside the node’s own run output as part of the Command object, so read it there.
How Do You Trace Retries and Failures in LangGraph?
LangGraph ships a RetryPolicy, but nothing retries until you attach one. Pass it once as a graph-wide default on StateGraph and override it per node with add_node(..., retry_policy=...), rather than writing retry logic into each node by hand.
Two defaults are worth knowing. max_attempts is 3, counting the first attempt, with initial_interval=0.5 seconds and backoff_factor=2.0. And the default retry_on is more permissive than most people expect: it retries any exception except an explicit non-transient list — ValueError, TypeError, RuntimeError, OSError, LookupError, ImportError and several more. A novel exception type your code has never raised before gets retried, not surfaced.
Visibility is the part that is not built in. A retried node re-runs, so a callback-based tracer sees N runs of the same node in the same superstep, each failed one carrying its error, and the last one either succeeding or failing for good. Attempt number and backoff delay are not fields anywhere; you count the runs and subtract their timestamps.
That is the actual observability gap. LangGraph’s checkpointer persists state at each step, so a failed run can resume later without re-running the nodes that already succeeded. It does not, on its own, alert anyone when a run fails.
Someone has to notice the failure and manually resume the run with the correct thread ID. That works fine for a single incident and does not scale to a production agent handling continuous traffic.
A retry trace worth having surfaces four things: the attempt count, the error message on each attempt, the backoff timing between attempts, and the final resolution — whether the node eventually succeeded on retry or exhausted its allowed attempts.
Without all four, a node that failed twice and then succeeded looks identical in your logs to one that never had a problem at all. Since none of the four arrives as a field, the practical move is to derive attempt count at query time from repeated same-node runs, then alert on it.
Checkpoints and time travel debugging
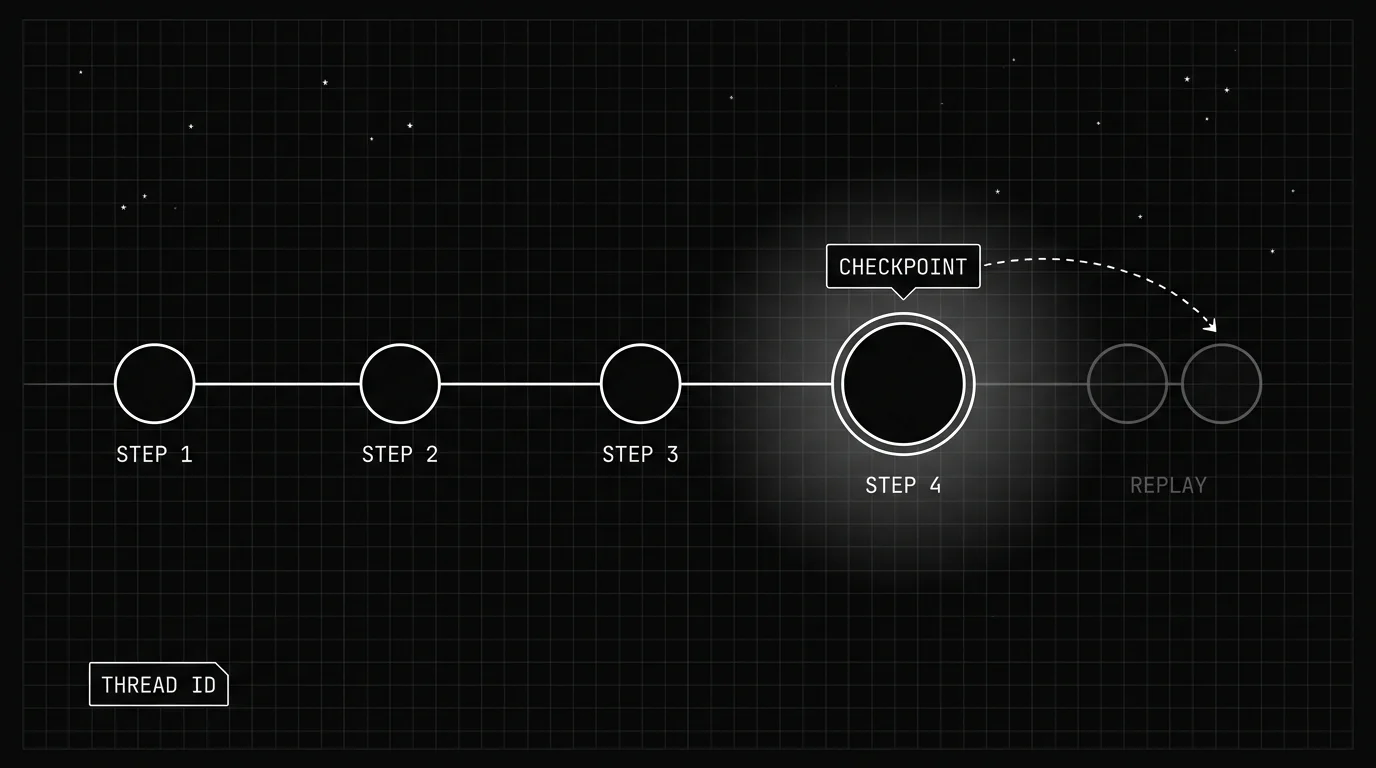
LangGraph saves each step as a checkpoint tied to a thread ID, which is what enables what the framework calls time travel: replaying execution from any prior checkpoint rather than starting the graph over from scratch. Nodes before the checkpoint aren’t re-run since their results are already saved; nodes after it execute again, including any LLM calls or API requests, which can return different results the second time.
This is genuinely useful for reproducing a specific failure with the exact state that caused it.
It is a debugging tool, not a monitoring tool. Checkpoints help you reproduce a failure once you already know one happened, and once you know roughly where in the graph to look.
They do nothing to tell you a failure happened in the first place, or to point you at the node where it started. That is the job tracing has to do.
Comparing Tracing Approaches for LangGraph
Before the table, two facts about LangGraph decide how to read every row in it, and both are worth checking in the source rather than taking on trust.
First, conditional-edge routers are traced. add_conditional_edges wraps your routing function with coerce_to_runnable(path, name=None, trace=True), and RunnableCallable.invoke calls on_chain_start whenever that flag is set — so the router emits its own callback run, named after the function, with the state it read as input and the destination node as output. LangGraph’s internal BranchSpec wrapper around it is separately built as RunnableCallable(..., trace=False) (_branch.py), which is what people usually spot and misread as “routers are not traced.” The wrapper is untraced; the router inside it is not.
Second, retries appear as repeated runs of the same node, sharing the same graph:step:N tag, with the failed attempts ending in an error. What no callback-based tracer gets from LangGraph is an explicit attempt number or backoff value — you count the repeated runs and read the gap between their timestamps.
That means the interesting differences between tools are not about who sees more of LangGraph’s internals. The callback layer hands every tracer the same material.
| Approach | What It Captures | Granularity (Node/Edge/Retry) | Setup Effort |
|---|---|---|---|
| Manual print/logging | Ad hoc, whatever you code | Inconsistent, usually node-only | Low effort, high maintenance |
| LangGraph’s built-in checkpointer | Full state per step, replayable | State per superstep; no router run, no retry history, no alerting | Built in, but reactive not proactive |
| LangSmith | Run traces, node timings, visual run graph | Node runs, the router run with its state input and chosen destination, retries as repeated runs | Requires a LangSmith account; proprietary trace format |
| OTel-based tracing (traceAI/Future AGI) | Spans for every LLM call, tool use, retrieval and chain step; the node’s own span tagged gen_ai.agent.graph.node_name and gen_ai.agent.graph.node_id, plus langgraph.interrupt / langgraph.resume span events | Same router and retry spans as any callback tracer, plus per-node token cost and latency, in portable OTel format | pip install traceAI-langchain, two env vars, one instrumentor call |
Manual logging is the cheapest to start and the most expensive to maintain, since every new failure mode means writing a new log line by hand. LangGraph’s own checkpointer is excellent for replay but was not built to alert you or explain routing decisions.
LangSmith adds a visual run graph on top of LangChain and LangGraph traces and ships from the same team as the framework, which shows in how naturally the run tree maps to the graph. Its trade is the format: traces live in LangSmith. An OTel-based tracer emits standard spans that also flow into whatever else you already run, and traceAI adds LangGraph node identity on top of them rather than leaving you with a flat call list.
So the differentiator is what happens to the trace afterwards: whether it stays in a proprietary format or lands as OpenTelemetry spans you can route anywhere, and whether anything reads those traces and tells you a whole class of runs is failing. We put our own side of that comparison in detail in Future AGI vs LangSmith rather than re-arguing it here.
In practice the working setup combines two of these rather than picking one. LangGraph’s checkpointing handles replay after something breaks, and an OTel-based tracer handles real-time visibility so you know something broke in the first place, and roughly where, before a user has to tell you.
Tracing LangGraph Agents with Future AGI
Future AGI’s traceAI-langchain package auto-instruments LangChain and LangGraph over OpenTelemetry, with no changes to how the graph is written. Python setup is pip install traceAI-langchain, the FI_API_KEY and FI_SECRET_KEY environment variables, and one LangChainInstrumentor().instrument() call. There is a TypeScript build of the same instrumentor. traceAI is Apache-2.0, so the span schema is readable in the repo rather than something you take on trust.
One setup note that saves an afternoon: LangGraph does not need its own instrumentor. LangChainInstrumentor picks it up through the callback layer LangGraph already routes every node, tool, and LLM call through. The older LangGraphInstrumentor class is now a no-op kept for backward compatibility, and calling it does nothing.
Once instrumented, every LLM call, tool use, retrieval step, and chain step becomes an OpenTelemetry span in a trace tree. The node’s own run is tagged with gen_ai.agent.graph.node_name and gen_ai.agent.graph.node_id, child spans keep the raw langgraph_node metadata, and LangGraph interrupts and resumes land as langgraph.interrupt and langgraph.resume span events — which matters because an interrupt is an intentional pause, and a tracer that files it as an error will bury real failures in noise.
That metadata is what lets you follow execution through the graph rather than seeing a flat list of calls with no structure. Setup is genuinely a few lines to instrument, and traces start appearing automatically once the graph runs.
For catching retry storms or silent failures in a running deployment, Error Feed works through a sampled slice of an Observe project, decides unaided what bent wrong in each, and groups the runs that failed the same way into one issue with a severity, an assignee, and a fix layer. Twenty retry-storm traces collapse into one issue instead of a hundred near-identical alerts.
One thing to set on day one: the sampling rate starts at 0, so Error Feed reads nothing until you raise it. Set it before you expect an issue to appear.
Evaluation on top of the trace data uses custom evals you define for your own graph’s failure modes, alongside 70+ built-in templates — including Trajectory Match, which scores the realized path against an expected one in strict, unordered, subset, or superset mode. That matters because what “wrong” looks like for a routing decision in your agent is specific to what that agent is supposed to do.
None of this requires rewriting how the graph is built. Adding tracing does not mean restructuring nodes or edges to expose data they were not built to expose.
Tracing is the input the evaluation layer needs, and two sibling posts pick up where this one stops. LangGraph Agent Evaluation: A 2026 Deep Tutorial covers how to score node-input, node-output, and edge-routing correctness once the traces exist. Evaluate State-Graph Agents in Production takes the same problem framework-agnostically, across LangGraph and everything shaped like it. This post stops at what the trace contains.
Conclusion
Reliable LangGraph debugging comes down to visibility at three levels: node, edge, and retry. Two of those are cheaper than the folklore suggests. The router already emits its own run with the state it read and the destination it picked, and every retry already appears as a repeated run of the same node.
What is missing is not capture, it is derivation and alerting: nobody counts the repeated runs for you, and nobody tells you a class of runs is failing. That is the work.
LangGraph’s own checkpointing is genuinely good for replay after the fact, letting you reproduce a failure from the exact state that caused it. It was not built to tell you a failure happened in real time.
That real-time signal is what production teams actually need to catch a problem before a user reports it, and it comes from reading spans continuously rather than opening one when someone complains.
If you have a LangGraph agent in production with no tracer attached, attach one this week and then run two queries against it: which routing decisions fired, and which nodes ran more than once in a single superstep. You will likely find at least one of each you did not know was happening.
Frequently Asked Questions
How do I trace a LangGraph agent's execution?
How does LangGraph handle retries?
What is time travel debugging in LangGraph?
Why did my LangGraph conditional edge route to the wrong node?
What's the difference between LangGraph checkpoints and full tracing?
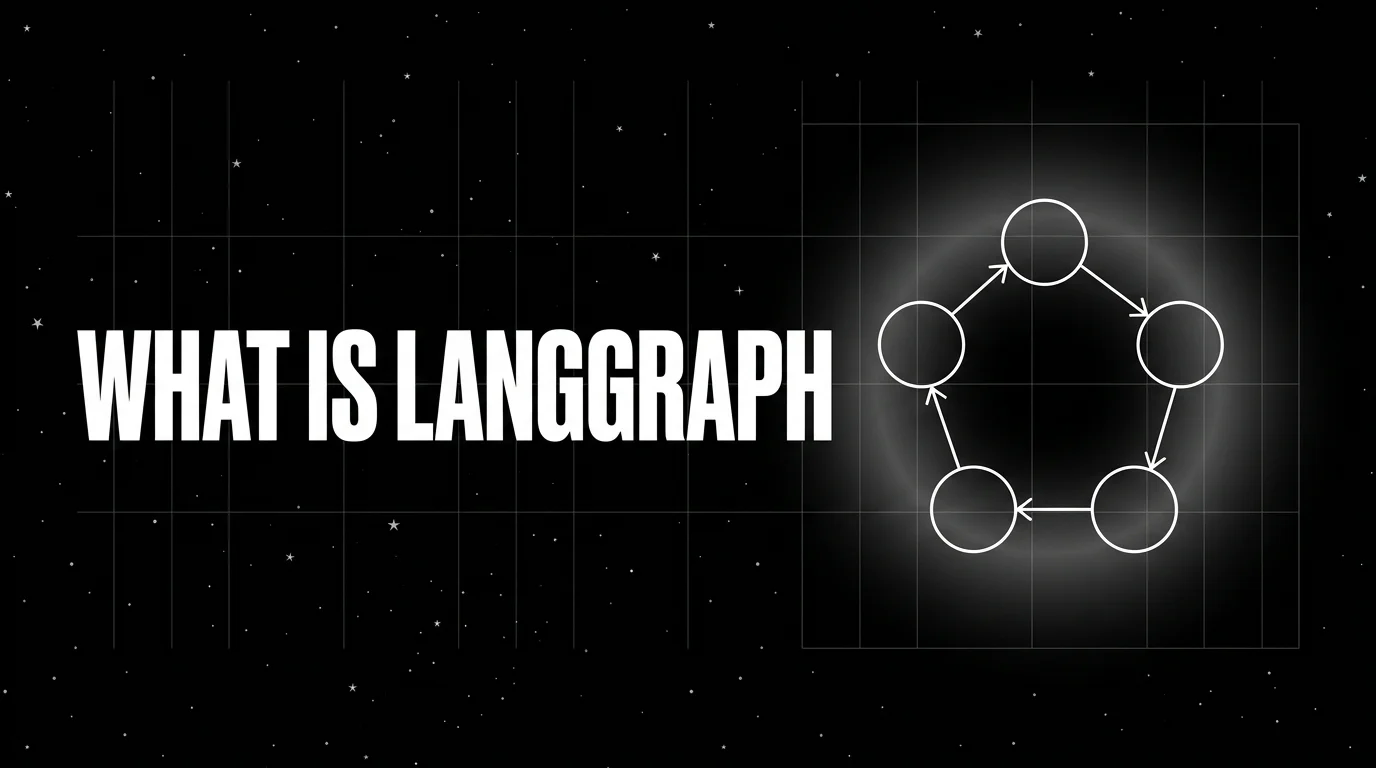
LangGraph is LangChain's graph-based orchestration library for stateful agents. Nodes, edges, state, checkpointers, and how it differs from CrewAI.

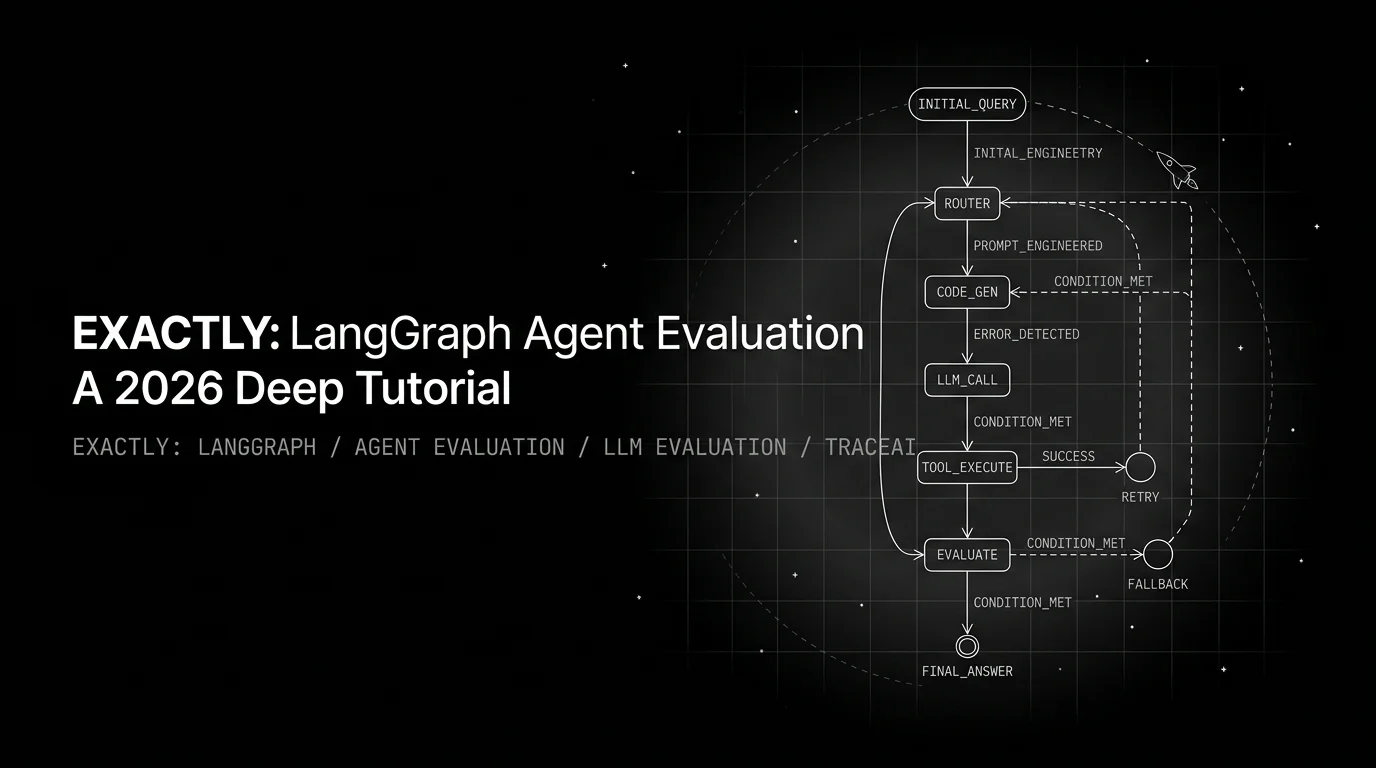
LangGraph eval is graph-level, not message-level. Score state transitions: node-input, node-output, edge-routing, and checkpoint replay determinism.

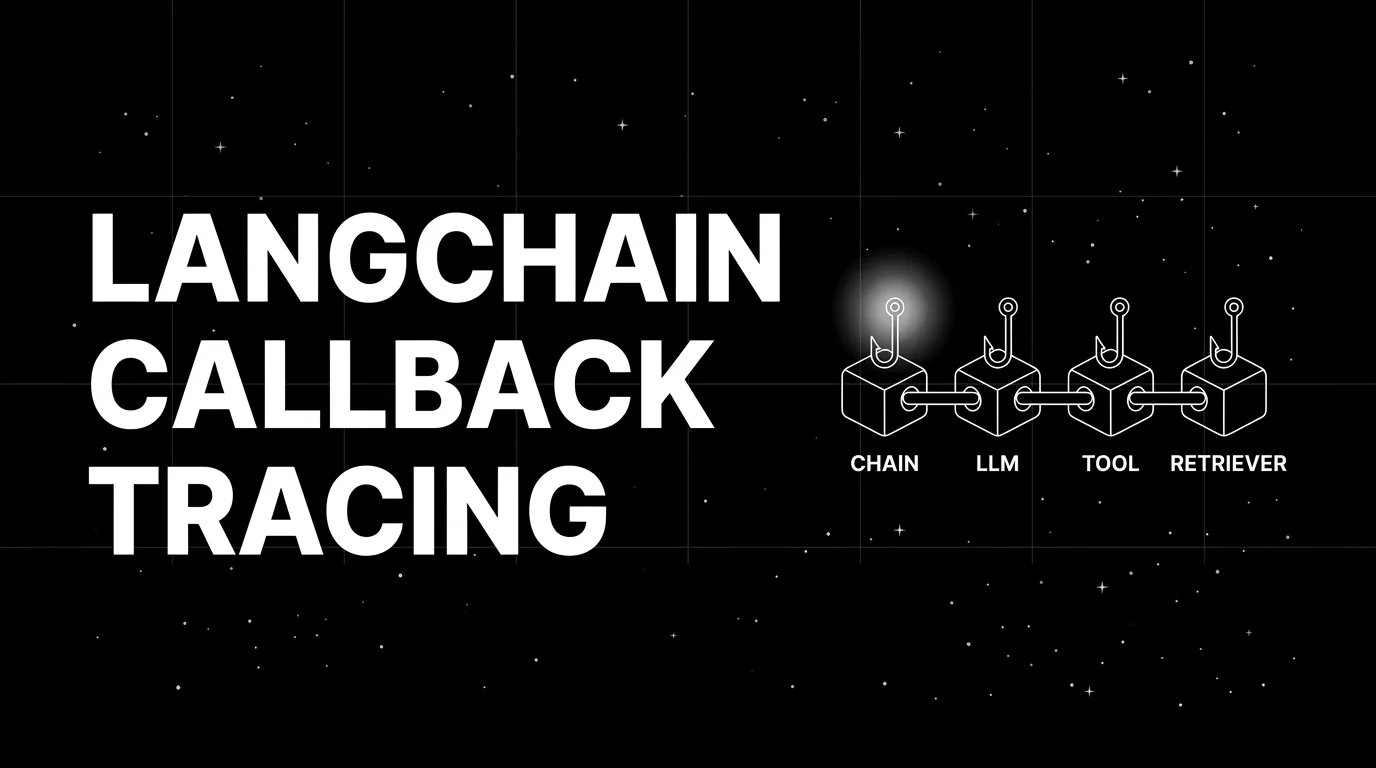
LangChain callback tracing best practices in 2026: handler design, async support, cardinality, span hierarchy, OTel integration, when to skip callbacks.