Coding Agent Harness Benchmarks: Why the Harness Changes the Score
A coding agent harness benchmark score measures the model and its scaffold together. See how much the harness moves SWE-bench Pro results and how to read them.
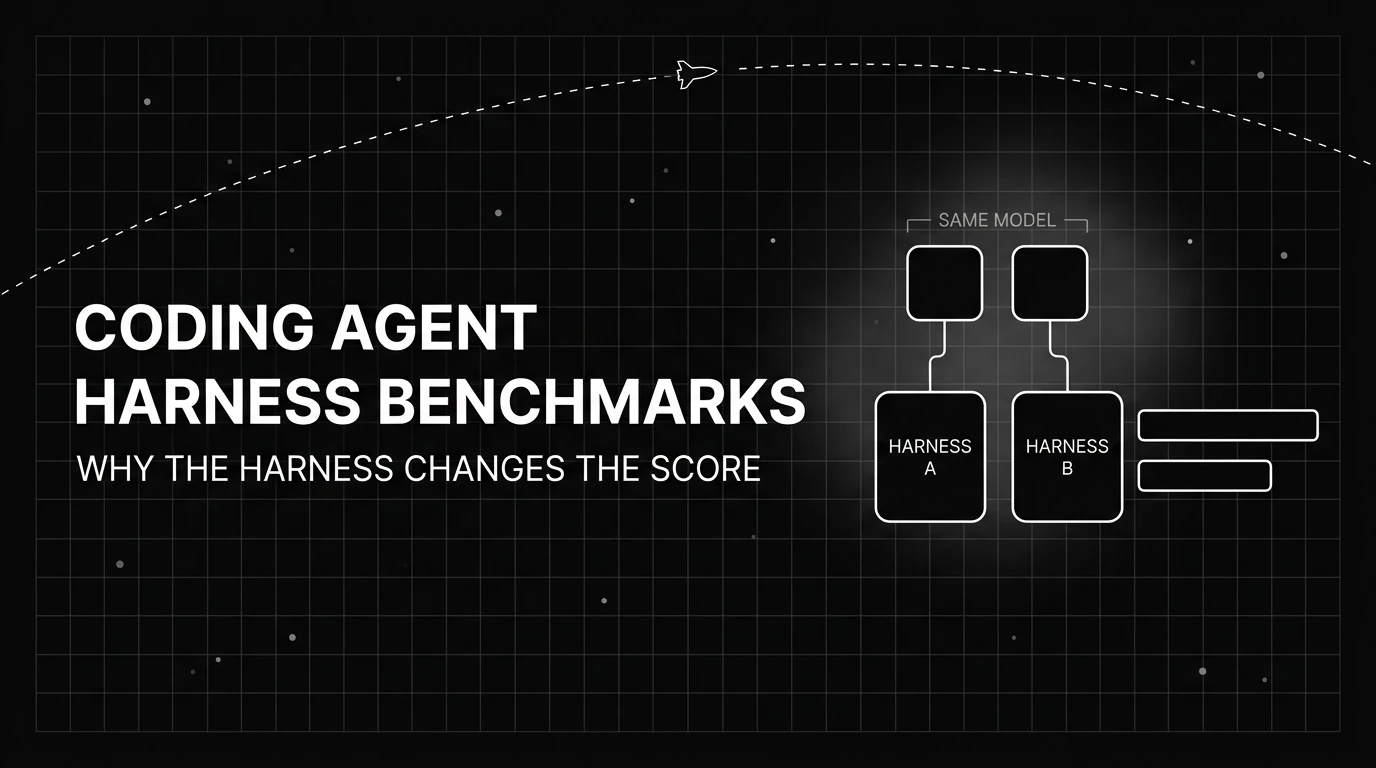
Table of Contents
A leaderboard number is a joint result of the model and the harness around it. Read it that way, and two contradictory “same model” scores stop being a contradiction.
You are comparing two coding agents on a coding agent harness benchmark. One team’s harness reports a SWE-bench Pro pass rate in the low 50s, while an independent, standardized run of the very same model lands near 45. Nobody faked anything, and both numbers are real measurements. The gap is the harness.
A coding agent harness is the scaffolding that turns a raw model into something that can act on a repository: the prompts, the tool set, the retry logic, the loop control, and the context strategy. Swap that scaffolding and the same model shows a different amount of its ability. So a benchmark score always carries two signals at once: the model, and the harness that ran it.
This post is about reading those numbers honestly. It covers why the same model scores differently across coding agent harness benchmarks, where the evidence comes from, which leaderboards try to isolate the harness effect, and a short checklist for judging any coding-agent score you meet. Every figure here was re-checked on October 18, 2026, because these numbers move fast.
TL;DR
- Every coding benchmark score is a model plus harness result. Hold the model fixed and the score still moves.
- On SWE-bench Pro with Claude Opus 4.5, Scale’s SWE-agent run scores 45.89% while Augment Code’s runs of Claude Code, Cursor and Auggie score 49.75% to 51.80%.
- Even standardized leaderboards change harnesses: Scale’s SWE-bench Pro board now runs newer models on mini-swe-agent, and the Artificial Analysis Coding Agent Index has been revised five times since its May 2026 launch, swapping components three times.
- Before comparing two numbers, check the benchmark variant, who ran the harness, the date, and the attempt budget.
What Does a Coding Agent Harness Benchmark Measure?
A benchmark pass rate reflects two things at once, the model and the scaffold that runs it. The scaffold means the prompts, the tool set, the retry policy, the loop control, and the context strategy. Hold the model fixed and the number still moves as the harness changes. So read every score as a model-plus-harness result.
The research term for this is the binding constraint. A 2026 paper, Stop Comparing LLM Agents Without Disclosing the Harness, advances what its authors call the Binding Constraint Thesis: the execution harness is often a stronger determinant of agent performance than the model it wraps. Their claim is blunt. Current evaluation protocols keep crediting harness-level gains to the model, and that misattribution shows up as model-ranking reversals once you change the scaffold.
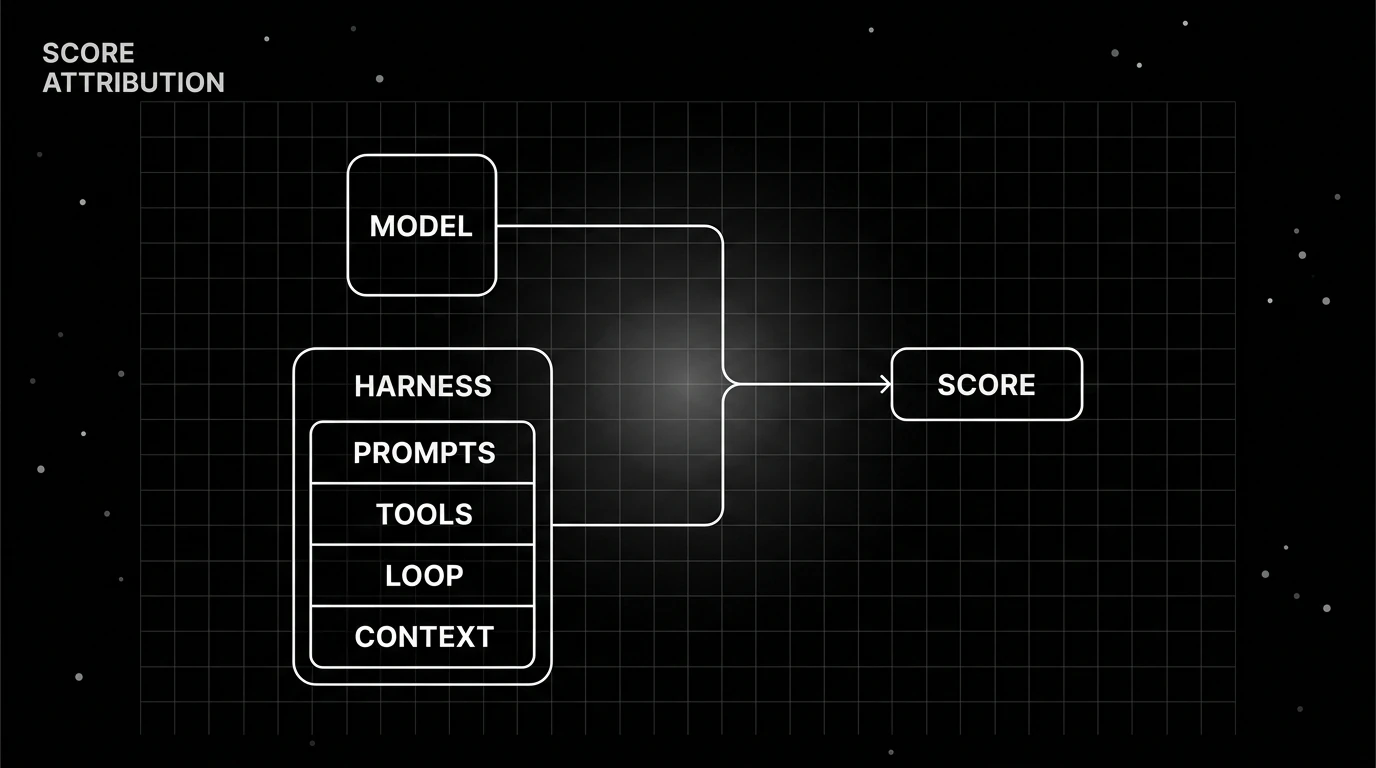
How big is the design space that produces these swings? A source-code taxonomy of open-source coding agents, Inside the Scaffold, found tool counts ranging from 0 to 37, seven different context-compaction strategies, and five distinct loop primitives across 13 systems. Two harnesses running the identical model can differ that much in how they prompt it, feed it context, and let it retry.
That variation is exactly what a single pass rate hides. For the architecture behind that variation, see how the harness shapes an agent’s performance.
The practical consequence is simple. When a score changes, the number alone cannot tell you whether the model got better or the harness did. Separating those two is the entire job of reading a benchmark well.
How Much Does the Harness Change a Benchmark Score?
Hold the model constant and the harness still moves the score. On SWE-bench Pro with Claude Opus 4.5, an independent standardized run reports 45.89%, while Augment Code’s own runs of three coding agents (Claude Code, Cursor, Auggie CLI) on the same model, under one shared evaluation setup, report 49.75% to 51.80%. Same weights, four setups, a spread of several points.
| Harness | Reported pass rate | Source type |
|---|---|---|
| Scale AI SEAL (standardized, SWE-agent scaffold) | 45.89% | Independent standardized |
| Claude Code | 49.75% | Vendor comparison |
| Cursor | 50.21% | Vendor comparison |
| Auggie | 51.80% | Vendor comparison |
Figures checked October 18, 2026, SWE-bench Pro public set (731 tasks), Claude Opus 4.5 held constant. The standardized number is Scale AI’s leaderboard run; the three vendor-comparison figures come from one Augment Code post (February 2026), which does not state its pass@k setting.
The lower number is Scale AI’s SEAL-lab standardized evaluation of SWE-bench Pro, which ran Claude Opus 4.5 through the SWE-Agent scaffold. The three higher numbers come from a published comparison by Augment Code, which ran three coding agents on the same Opus 4.5 model under one shared evaluation setup and reported the results as a vendor.
The independent standardized run sits below all three vendor-comparison numbers, and the lab that published the table shows its own agent, Auggie, at the top. Neither detail implies foul play, but both show why the source of a score matters as much as the score.
The pattern repeats beyond SWE-bench Pro. Reviewing SWE-bench Verified in June 2025, Epoch AI found that a good scaffold can lift performance by up to 20%, and documented Claude 3.7’s score rising from 62.3% to 70.2% with a custom scaffold. A separate longitudinal study, Don’t Blame the Large Language Model, fixed the model and evaluated 35 sequential releases of the Qwen Code CLI on 50 stratified SWE-bench Verified tasks, and traced the quality swings to the harness itself.
An August 2026 controlled study, Same Model, Different Harness: Different Coding-Agent Results (arXiv 2608.26218), kept the model and tasks fixed and changed only the harness. The treatment harness shortens older tool results as the context fills and responds to repeated or stalled work.
On a tight-window SWE-bench Verified cohort of 169 tasks, that change raised the mean per-task fail-to-pass fraction from 28% to 49% and complete solutions from 43 to 72. Without model-specific retuning, the same frozen change also raised both results for three additional models. The authors conclude that coding-agent evaluations should treat the model and harness together as the tested solver.
Princeton’s HAL team reports the same pattern on CORE-Bench Hard. Running Opus 4.5 with an updated scaffold that uses Claude Code drastically outperformed the CORE-Agent scaffold HAL had used, especially after a few grading errors were fixed by manual scoring, and HAL has now declared CORE-Bench solved.
Why Vendor and Independent Numbers Diverge
Three forces open the gap. First, harness differences: one setup gives the model more tools, better retries, or a cleaner context window than another. Second, test-time compute: a vendor run may allow more attempts, longer turn limits, or larger sampling budgets than a standardized run. Third, contamination controls: a contamination-resistant set like SWE-bench Pro draws on copyleft and private commercial repositories to resist contamination.
None of these require anyone to cheat. They are ordinary configuration choices, and they explain why the same model lands in different places. Epoch AI notes that a good scaffold can increase SWE-bench Verified performance by up to 20%, so confirm the model and variant were held fixed before comparing.
Is a Benchmark Number a Controlled Comparison or a Best-Case Score?
OpenAI’s third-party evaluation playbook separates the kinds of claims an evaluation can support, and two of them matter here. A controlled comparison says System A outperforms System B under a shared evaluation setup, so the tasks, scoring and budget stay fixed, with either a shared harness and tool setup or a fixed set of standardized harnesses chosen up front.
For coding-agent evaluations, the playbook names Codex CLI as an open-source harness that can provide a fixed agent loop and tool interface across systems. A capability-under-strong-elicitation claim asks what a system can do when the setup is designed to draw out its strongest credible performance, and the playbook asks evaluators to report that harness, tool setup and budget.
Budget alone can move a result. The playbook cites UK AISI’s cyber range evaluation, where raising the budget from 10M to 100M tokens improved performance by up to 59%.
Map that back to the SWE-bench Pro table. Scale’s 45.89% is a standardized run on one shared SWE-Agent scaffold, but Scale’s legend lists different cost and turn limits across rows, so read it as a shared-harness evaluation rather than a fixed-budget controlled comparison.
Augment Code’s three numbers are vendor-reported results from one evaluation setup that Augment ran itself, and the post does not state its budget or elicitation method. Before you compare two scores, ask which kind of claim each one makes, and compare only numbers that make the same kind of claim under a stated budget.
Which Harness Benchmark Leaderboards Hold the Harness Fixed?
A few efforts fight the attribution problem by holding variables constant on purpose. Princeton HAL ran models through one standardized, cost-controlled evaluation harness across nine benchmarks. The Artificial Analysis Coding Agent Index reports a single composite built from disclosed components. In both, the setup is shared and stated out loud.
Princeton HAL, the Holistic Agent Leaderboard, provides a unified evaluation command that runs agents through the same cost-controlled setup across nine benchmarks, among them SWE-bench Verified Mini, USACO, TAU-bench Airline and SciCode. The repository was archived in mid-2026, but the idea is the durable part.
When the evaluation harness is shared and the cost is controlled, differences between agents get easier to attribute to the agent instead of the scaffold around it. HAL was published at ICLR 2026. The HAL site has also paused adding new models to its leaderboard and is now focused on agent reliability, so treat its leaderboard as a historical reference point.
Even a standardized board can mix harnesses. Scale’s SWE-bench Pro leaderboard marks several newer rows, including claude-opus-4-6 (thinking) at 51.90%, gpt-5.4 (xHigh) at 59.10% and Muse Spark 1.1 at 61.50%, as run with the mini-swe-agent harness.
The claude-opus-4-5-20251101 row at 45.89% carries no such mark, so compare only rows run on the same harness. The official SWE-bench site takes a different approach: its default Verified view, Bash Only, runs every model in the same mini-SWE-agent environment, so the model is the part that changes.
The Artificial Analysis Coding Agent Index takes a different route to the same goal. Instead of one benchmark, it publishes a composite score with a disclosed recipe, so you can see exactly what went into the average. That recipe matters more than the headline it produces.
What Does the Artificial Analysis Coding Agent Index Average?
A single coding-agent number can be an average of several sub-tests, and the average can hide wide disagreement between them. The Artificial Analysis Coding Agent Index, for example, is an equal-weight average of pass@1 across three components. Read the components before you trust the headline, because a strong average can sit on top of one weak sub-score.
As of its v1.5 methodology (September 2026), the index is the equal-weight average of three components: DeepSWE v1.1 with 113 tasks, Terminal-Bench 4.0 with 66 terminal tasks, and SWE-Atlas-QnA with 124 repository Q&A tasks. That is 303 tasks, each attempted three times and averaged into pass@1.
The recipe itself moves: since its May 2026 launch the index has swapped SWE-Bench-Pro-Hard-AA for DeepSWE and moved from Terminal-Bench 2.0 to 2.1 to 4.0, so a score from June and a score from October are not the same test. A harness that patches code well but stumbles in the terminal can post the same composite as a balanced one, and the headline will not tell you which you are looking at.
This is the general trap with any blended score. Averages compress dispersion. When a leaderboard gives you a composite, find the sub-scores, because the shape of the distribution is where the useful signal lives. If a tool publishes only the composite, treat it as a starting point instead of a verdict.
The SWE-bench Variants You’re Actually Comparing
SWE-bench ships in several sizes under one name, and a score only means something next to another score from the same variant. Comparing a Verified number to a Pro number is an apples-to-oranges mistake. The table below lays out what each variant actually measures.
| Variant | Approx. size | What it tests |
|---|---|---|
| SWE-bench (full) | ~2,294 tasks | Broad real-world GitHub issue fixes across 12 Python repos |
| SWE-bench Verified | 500 tasks | Human-validated, solvable subset (with OpenAI Preparedness) |
| SWE-bench Lite | 300 tasks | Lightweight, self-contained bug fixes for faster iteration |
| SWE-bench Multilingual | 300 tasks | Tasks from 42 repositories across 9 programming languages |
| SWE-bench Multimodal | 480 instances | Issues that need visual context, such as screenshots or mockups |
| SWE-bench Pro | 731 public (1,865 total) | Harder, contamination-resistant long-horizon tasks |
The full SWE-bench holds about 2,294 real GitHub issues across 12 Python repositories, each asking the agent to produce a patch that makes hidden tests pass. SWE-bench Verified is a 500-task subset that human annotators, working with OpenAI’s Preparedness team, confirmed to be fair and solvable.
SWE-bench Lite trims that to 300 lighter tasks for quick iteration. SWE-bench Multimodal moves to JavaScript issues that need visual context, with 480 instances listed on the official leaderboard.
SWE-bench Pro is the newer, harder set, 731 public tasks out of 1,865 total, built by Scale AI to resist contamination by drawing on copyleft and private commercial repositories (arXiv 2509.16941). Its authors describe it as a substantially more challenging benchmark than SWE-bench.
So when one page cites a Verified pass rate and another cites a Pro pass rate, the gap can just reflect the easier test, and the comparison says little about which agent is stronger. If you plan to run these tasks yourself, the SWE-bench evaluation harness has its own setup and Docker gotchas.
How Do You Read a Coding-Agent Leaderboard Honestly?
Before you trust any coding-agent score, run five quick checks: same benchmark variant, standardized or vendor harness, independent source, timestamp, and single-shot or multi-attempt scoring. If a comparison fails any of these, it is not measuring what it claims to measure. The checklist below turns that into a habit, so walk the five questions in order.
- Same variant asks whether both numbers come from, say, Verified and Verified, not Verified and Pro.
- Standardized or vendor asks who built the harness that produced the score, an independent common scaffold or the tool’s own setup.
- Independent source asks whether the number comes from a neutral evaluator or the seller.
- Timestamped asks for a date, because a six-month-old score describes a model and a harness that have both moved since.
- Single-shot or multi-attempt asks whether the score is pass@1 or pass@k, since more attempts inflate the number. HumanEval shows what pass@k does and does not prove.
Any single failed check is enough to void a comparison, because two scores from different variants measure different things. A vendor number without an independent cross-check reads as an upper bound, a ceiling to confirm elsewhere. An undated score is a snapshot of a moment that has already passed. The checklist is quick, and it filters out misleading comparisons.
How to Benchmark Your Own Coding Agent Harness
The same rules apply when the harness under test is your own. Hold three things fixed: the model, the task set and the attempt budget. Then change one harness component at a time, such as the system prompt, a tool, the retry policy or the context strategy, so a score change has one cause.
Run each version several times rather than once, and keep the per-task results and traces alongside the aggregate, so you can see which tasks flipped and why. Gate merges on the aggregate, so a harness change ships only when the full suite holds up. If you are still assembling the scaffold, start with how to build a coding agent harness from scratch.
Future AGI has custom evals, so you can score each harness run the same way every time: pick built-in agent evals such as Task Completion, Tool Call Accuracy, Trajectory Match and Step Count, or write your own grading rule, set a pass threshold, and run the same eval on every version. Run two harness versions as an experiment on the same dataset and use Choose winner to keep the better one.
For a code-first CI gate, Agent Learning Kit, Future AGI’s Apache-2.0 SDK and CLI, ships a bench CI gate example that turns a coding-suite result into a single pass or block decision and treats infrastructure failures as void, not fail. The gate writes its decision and the inputs behind it to a JSON artifact, so CI can assert on the file and a person can read why it blocked.
Reading the Harness Behind the Number
Go back to the two agents from the start, one harness reporting the low 50s, an independent run of the same model near 45. With the checklist, the contradiction dissolves. Same model, different scaffolds, different sources, and once you know that, you know which number to trust for your own decision.
The through-line of every section here is one idea. A coding agent harness benchmark measures a system, the model and the scaffold together, and the scaffold moves the number too. The binding-constraint research argues it, the same-model comparisons show it, and the leaderboards that hold the harness fixed control for it.
So when you need to choose, invert the usual order. Read the harness first, then the model. Confirm the benchmark variant, find an independent standardized number to anchor the vendor claims, check the date, and note the attempt budget. For the wider version of this habit, use a methodology checklist before you trust a score.
Do that, and a leaderboard stops being a scoreboard you take on faith and becomes something you can reason about. The same discipline carries into the wider machinery of evaluating agents as whole systems: name the setup, hold it fixed, and report what you actually ran.
When the harness you need to measure is your own, Future AGI lets you score every version with the same evals and keep the run that wins.
Frequently Asked Questions
What is an agent harness benchmark?
What is the best benchmark for coding?
How do you evaluate coding agents?
Is there an agent harness benchmark leaderboard?
How much does the harness change a coding agent benchmark score?
What is the Artificial Analysis Coding Agent Index?
Is Claude Code the best coding agent?
A step-by-step Python guide to the agent harness loop: tool schema setup, stop_reason handling, parallel tool calls, and the bugs every builder hits first.

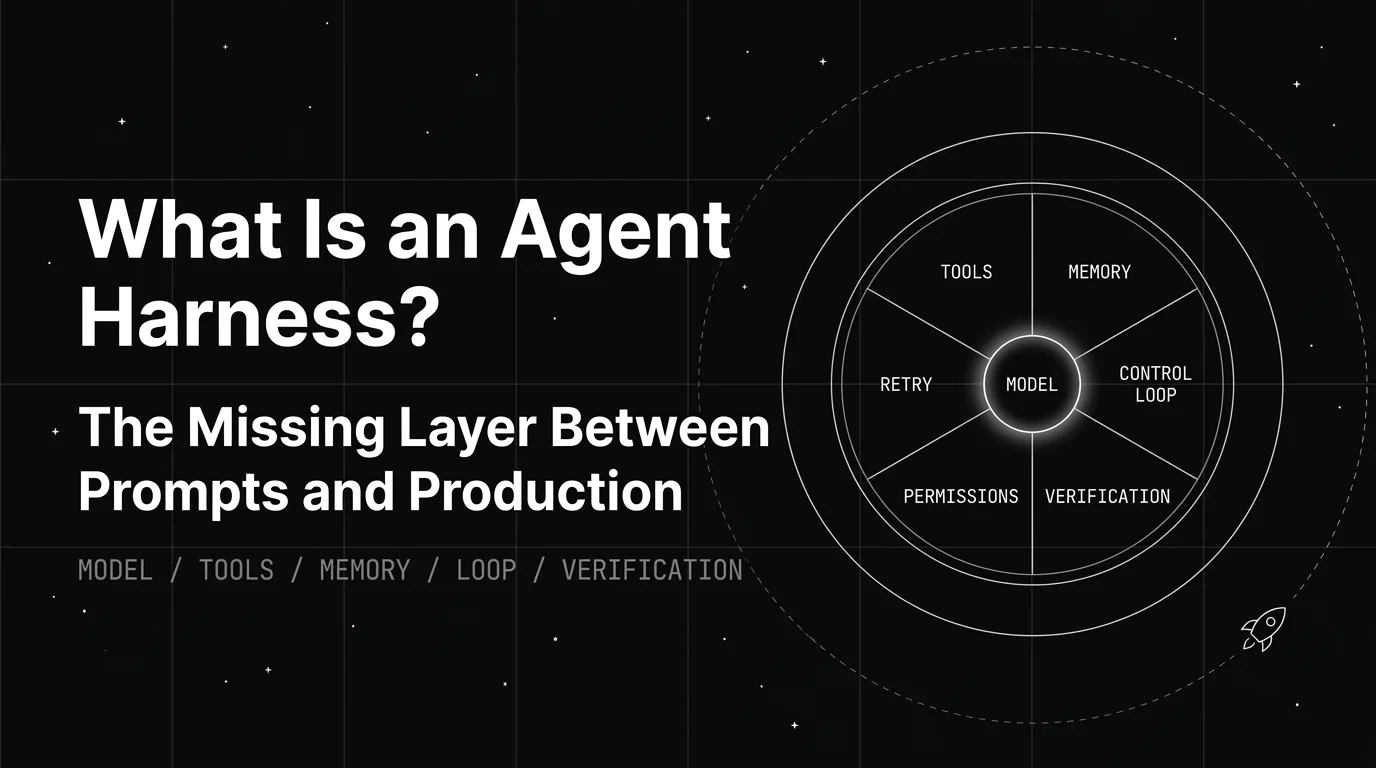
An agent harness fails in production in four places: tool permissions, state, the control loop, and verification. Here is how to test yours before you ship.

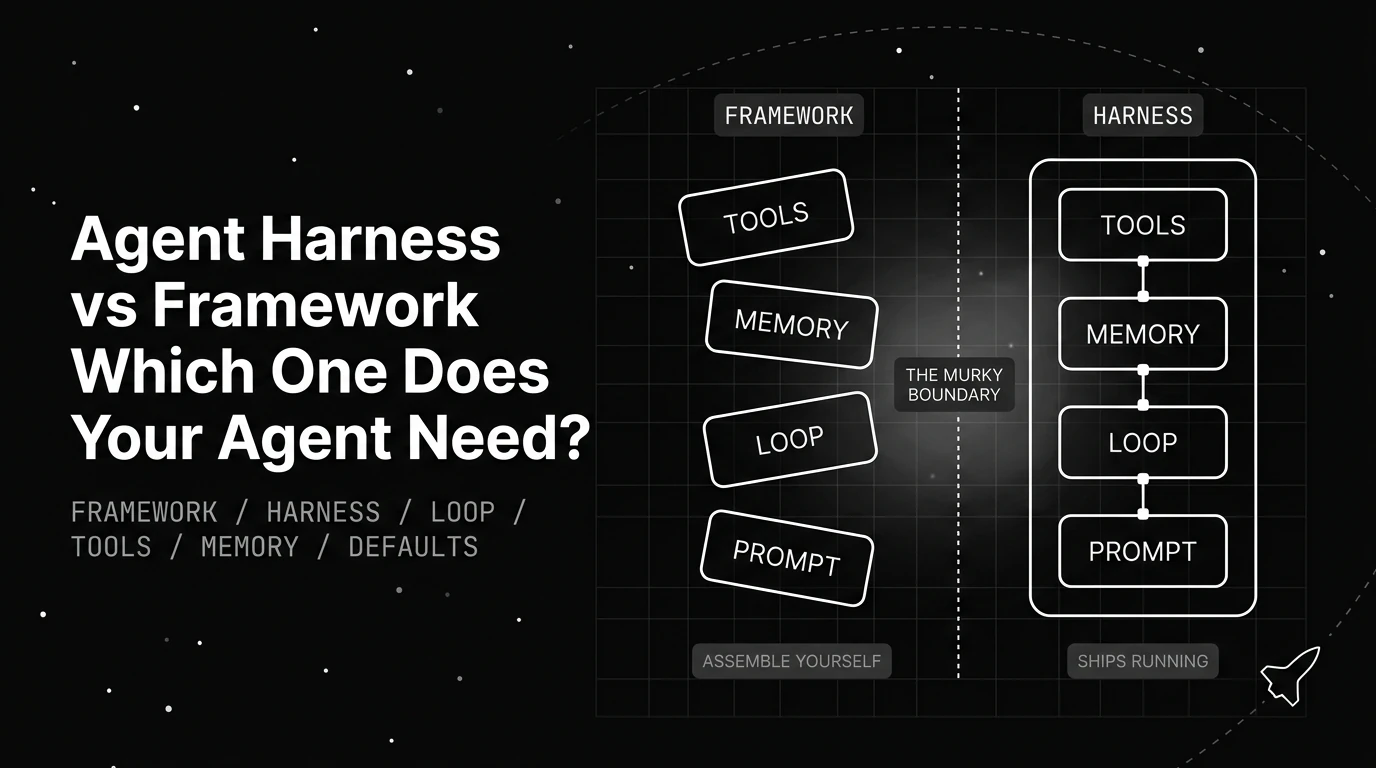
Agent harness vs framework: a framework supplies reusable abstractions, while a harness runs and controls the agent loop. Learn when you need each.