LLM Benchmarks Explained: A Methodology Checklist Before You Trust a Score
How benchmark scores get inflated by contamination, selective reporting, and sampling noise, plus a six-criterion checklist for reading any leaderboard.
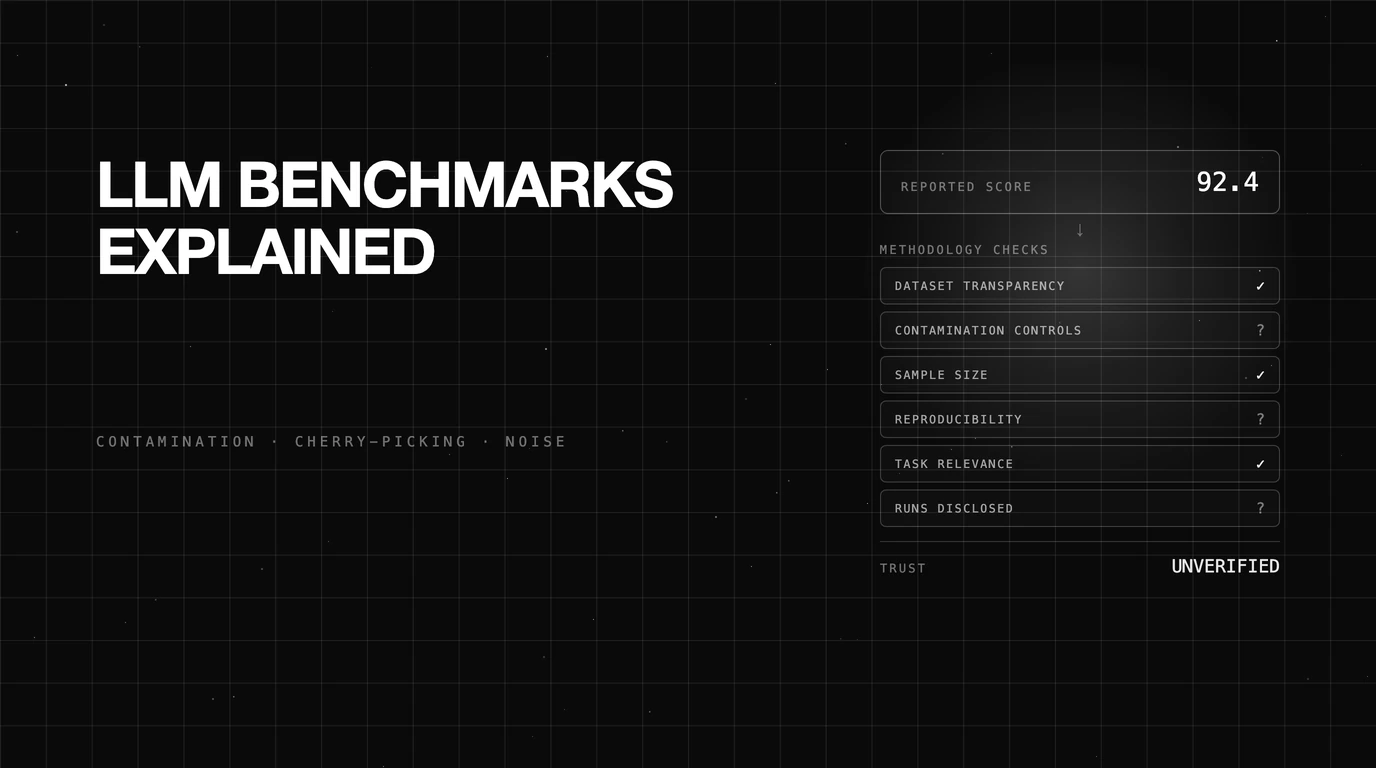
Table of Contents
A vendor posts a chart. Their model leads on four benchmarks. The bars are tall, the deltas look decisive, and someone on your team drops it into a Slack thread as evidence that you should switch.
The chart is probably accurate. It is also close to useless for predicting how that model will behave on your traffic. The gap between “scored well on a public test set” and “works on your task” is where most model selection decisions go wrong.
This post is about closing that gap. Not by ignoring llm benchmarks, which remain the cheapest way to narrow a field of forty models to four, but by reading them the way you would read any experimental result: with the methodology in view.
Key takeaways
- A benchmark score is a measurement made under a specific setup. Change the prompt format, the scoring rule, or the number of attempts, and the number moves.
- Contamination, selective reporting, and sampling noise all push scores up or sideways without any change in real capability.
- Arena-style human preference rankings carry measurable noise from voter sampling alone, enough to reorder adjacent models.
- Leaderboards disagree because they run different experiments, not because one of them is lying.
- Public benchmarks tell you what to shortlist. Only evaluation on your own data tells you what to ship.
What an LLM Benchmark Actually Measures
A benchmark is a fixed set of tasks, a fixed way of presenting them to a model, and a fixed rule for deciding whether an answer counts. That is the whole apparatus. The score is a summary of how one model performed under those three choices.
None of those choices are neutral. A benchmark that asks for a single letter answer measures something different from one that grades a paragraph. Both can carry the same label, like “reasoning”, and produce numbers you cannot compare.
Task Design and Scoring Method Are Not Standard Across Benchmarks
Multiple-choice benchmarks score by exact match against a key. That is cheap, reproducible, and blind to whether the model reasoned or guessed. A four-option question gives 25% for free, so the interesting range of the scale is narrower than it looks.
Open-ended benchmarks need a grader. Some use string overlap, some use a rubric, and many now use another model as judge. Each grader has its own failure modes, and swapping graders on the same outputs can move a score by several points.
Then there is the prompting setup. Zero-shot, few-shot, chain-of-thought, and self-consistency sampling all produce different numbers from the same model on the same questions.
Static Test Sets and Live Evaluation Fail in Opposite Directions
Static benchmarks like MMLU or HellaSwag are fixed files. They are reproducible, which is their real value, and they degrade over time as their contents spread across the web and into training corpora.
Live evaluation works differently. Chatbot Arena collects pairwise human votes on real prompts. It launched on an Elo rating system borrowed from chess, then moved to a Bradley-Terry model for more stable ratings and tighter confidence intervals. Even Arena’s own scoring method has a methodology history worth knowing before you read a rank off it. Fresh prompts mean contamination is much harder.
The trade is variance. A static test set gives you the same answer every run. A vote-driven rating depends on who voted, what they asked, and how many comparisons the model has accumulated, so the number moves even when the model does not.
Why LLM Benchmark Scores Get Distorted
Distortion here does not mean fraud. Most of it comes from ordinary incentives acting on a measurement system that was never designed to resist them. Three mechanisms cover the majority of cases.
Data Contamination Turns Capability Into Recall
Contamination is the simplest failure. Benchmark questions and answers live on GitHub, in papers, in forum posts and in tutorials. Web-scale pretraining corpora pull them in, and a model that has seen the test scores well on the test.
The effect is largest on older, widely-copied benchmarks. HellaSwag and the original MMLU have been public for years and appear in countless repositories, so a high score on either says less in 2026 than it did in 2022.
Detecting it from the outside is harder than reading a score, but it is not a dead end. Four published methods do most of the work. Min-K% probability looks at a text’s least-likely tokens and flags material that scores too well to be genuinely unseen. Time Travel feeds a model the opening of a test item and checks whether it completes the rest verbatim. ConStat compares performance on original items against rephrased ones and treats the gap as evidence. And canary strings — the GUIDs BIG-Bench embeds in its files precisely so they can be searched for — are a direct test: a model that reproduces one has read the file.
The cheaper move is to prefer benchmarks built to resist contamination in the first place. LiveBench adds and updates its questions monthly and scores against objective ground truth rather than a judge. SWE-bench Pro takes the structural route, drawing its 1,865 tasks from strong-copyleft GPL repositories and proprietary startup codebases, so training on them is a legal problem rather than an oversight. The gap that design exposes is the reason to care: models reporting on both SWE-bench Verified and SWE-bench Pro typically give up roughly 20 to 25 points on the contamination-resistant set, on identical weights.
What you can always check for free is whether the maintainers say anything at all: held-out splits, canary strings, private test sets, or a refresh cadence. Silence on the topic is the signal.
Cherry-Picked Runs Report the Best Attempt as the Result
If you can run a benchmark privately, test many variants, and publish only the winner, you get a higher number without a better model. This is selection on the outcome, and it is the mechanism behind most inflated leaderboard claims.
The best-documented case is Meta. The Cohere-led study The Leaderboard Illusion (April 2025) reports that Meta tested 27 private Llama 4 variants on Chatbot Arena ahead of launch, with only the top-scoring one appearing publicly. The paper argues this pattern of undisclosed private testing lets a small number of providers pick their best result and biases the resulting Arena scores.
The same paper estimates the size of the advantage available from access to additional Arena data at relative performance gains of up to 112% on the Arena distribution. LMArena’s May 2025 response disputes two specific points: that the 112% figure was measured on Arena-Hard rather than live Chatbot Arena, and that its own measured pre-release boost is closer to 11 Elo after 50 test battles and 3,000 votes.
The underlying point survives the disagreement. If you do not know how many attempts produced a published number, you do not know what the number means. That is exactly the mechanism the K parameter below measures directly.
Ranking Noise Is Large Enough to Reorder Adjacent Models
Human preference ratings have sampling error like any other estimate, separate from the cherry-picking problem above. A 2026 arXiv paper on hidden measurement error in LLM pipelines puts a number on it: the human Arena leaderboard already carries a 45-Elo “gaming surface” at K=27 from voter sampling alone. K here is the same idea as Meta’s 27 variants above: the number of attempts a provider could submit and keep only the best.
That 45-Elo figure describes today’s human-voted leaderboard. The same paper separately measures a larger gaming surface for pipelines that use an LLM judge instead of human votes: up to 56 Elo for a single judge, cut to 32 by averaging across judges and prompts. Those two numbers describe an LLM-judge pipeline, not the human Arena leaderboard, so do not read them as bracketing the 45-Elo figure.
Treat all of these as one study’s estimates, not settled constants — the 45-Elo figure appears in the paper’s results rather than its abstract. The direction is what matters: a gap of 10 or 20 Elo between two adjacent models sits inside a noise band this large, so treat it as inconclusive rather than as a result.
That reframes how to read a leaderboard. Rank 3 versus rank 5 is usually not a meaningful distinction. Rank 3 versus rank 30 probably is.
The Methodology Checklist for LLM Benchmarks
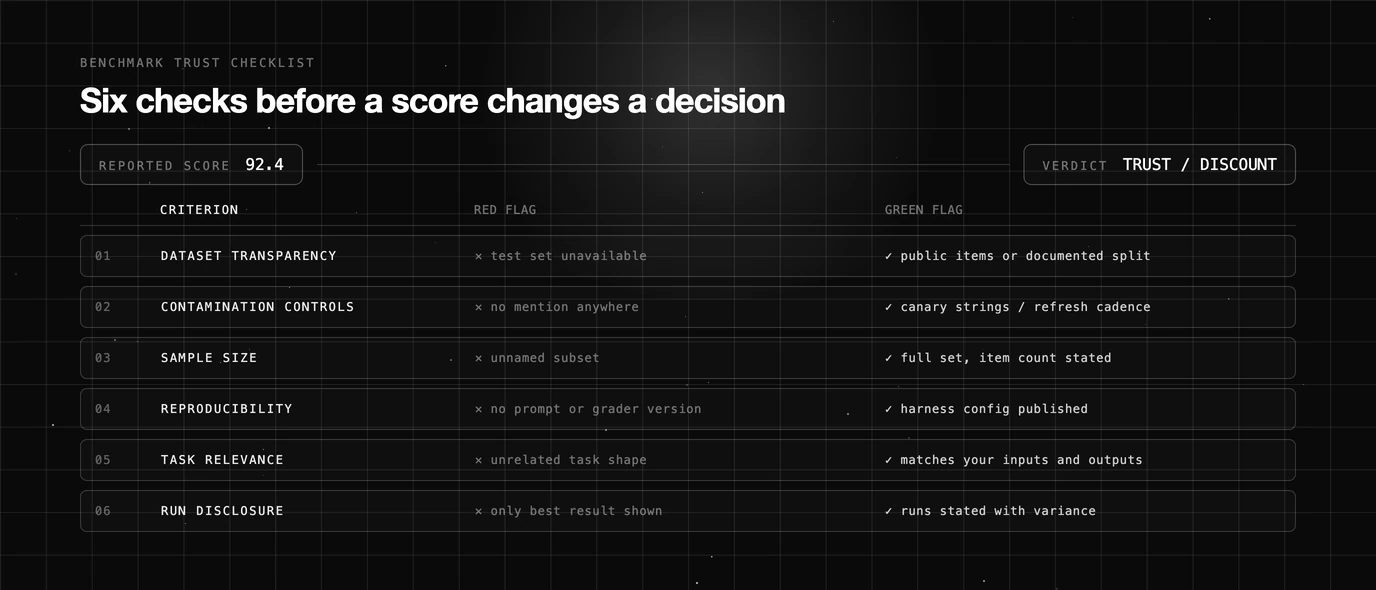
Before a score changes a decision, run it through six questions. None of them require you to re-run the benchmark. All of them are answerable from the benchmark card, the model card, or the paper, and an unanswerable question is itself a finding.
Dataset Transparency and Contamination Controls
Ask what is in the test set and whether you can see it. A published dataset lets you inspect difficulty and check whether the tasks look like yours. A fully private one is harder to contaminate but impossible to audit.
The stronger signal is what the maintainers do about contamination: canary strings, held-out private splits, or a refresh cadence that retires leaked items. A benchmark that has never been refreshed is measuring something that has been drifting for years.
Sample Size and Reproducibility
Check how many items the benchmark contains and how many the reported run actually used. A 200-item subset produces confidence intervals wide enough to swallow most of the gaps between frontier models, and subsets are common in vendor charts.
Reproducibility means the setup is written down. Prompt template, temperature, number of samples, shot count, grader version. Missing any of those means nobody outside the reporting team can regenerate the number, including you.
Task-to-Use-Case Relevance
A score only transfers if the task transfers. Graduate physics questions predict very little about a support agent that reads order histories and writes refund emails in your brand voice.
Map the benchmark’s task shape against your own: input length, domain, output format, tool use, number of turns. Where those diverge, discount the score. Where they diverge on more than two dimensions, ignore it.
Disclosure of Runs Attempted Versus Runs Reported
This is the shortest check and the most revealing. Does the source say how many runs, seeds, or private variants it tested before publishing this one?
As of August 2026, no major public leaderboard requires best-of-N disclosure. In its absence, read every published score as an upper bound rather than an expectation.
Table 1 — Benchmark trust checklist
| Criterion | Red flag | Green flag |
|---|---|---|
| Dataset transparency | Test set unavailable and undescribed; no dataset card | Public items or a documented private split, with task distribution described |
| Contamination controls | No mention of contamination anywhere in the docs | Canary strings, held-out split, or a published refresh cadence |
| Sample size | Small unnamed subset; no item count given | Full test set or a stated, randomly drawn subset with item count |
| Reproducibility | No prompt, temperature, shot count, or grader version | Full harness config published and re-runnable by third parties |
| Task relevance | Task shape unrelated to your inputs, outputs, or domain | Benchmark tasks resemble your real traffic in length, domain, and format |
| Run disclosure | Only the best result shown; attempts not mentioned | Number of runs or variants stated, with variance or confidence intervals |
Why Do Different LLM Leaderboards Disagree?
Two leaderboards can rank the same five models in different orders and both be reporting honestly. They ran different experiments. Once you know which parts of the experiment differ, the disagreement stops being mysterious. For how each major leaderboard is actually built and scored, see our leaderboard-by-leaderboard breakdown; the two mechanical causes below are what to check first when two of them disagree on the same model.
Saturation Compresses the Top of the Table
When frontier models all score in the high 80s on a benchmark, the remaining spread is mostly measurement error and a handful of ambiguous or mislabelled items. MMLU has been in this state for a while, and a benchmark near its ceiling cannot separate the models you actually care about.
Saturation also changes what a small lead means. On a saturated test, a one-point gap is a rounding artifact. On a hard benchmark where the field sits at 30%, the same one point may be real. This is why new benchmarks keep appearing. The field builds harder tests, they get saturated and contaminated, and the cycle repeats. We walk through where that cycle currently stands in the state of LLM benchmarking.
The Same Model Scores Differently Under Different Harnesses
Two leaderboards report the same model on the same benchmark and disagree by four points. Usually the cause is mechanical: different prompt template, different shot count, different answer extraction regex, different handling of refusals or truncated outputs.
Answer parsing alone accounts for a surprising share of it. A model that writes “The answer is C, because…” is scored correctly by one harness and marked wrong by another that expected a bare letter.
The practical rule: compare scores only within a single leaderboard, produced by a single harness version. Cross-leaderboard comparison is comparing two experiments that were never designed to be compared.
What a Passing Score Still Does Not Tell You
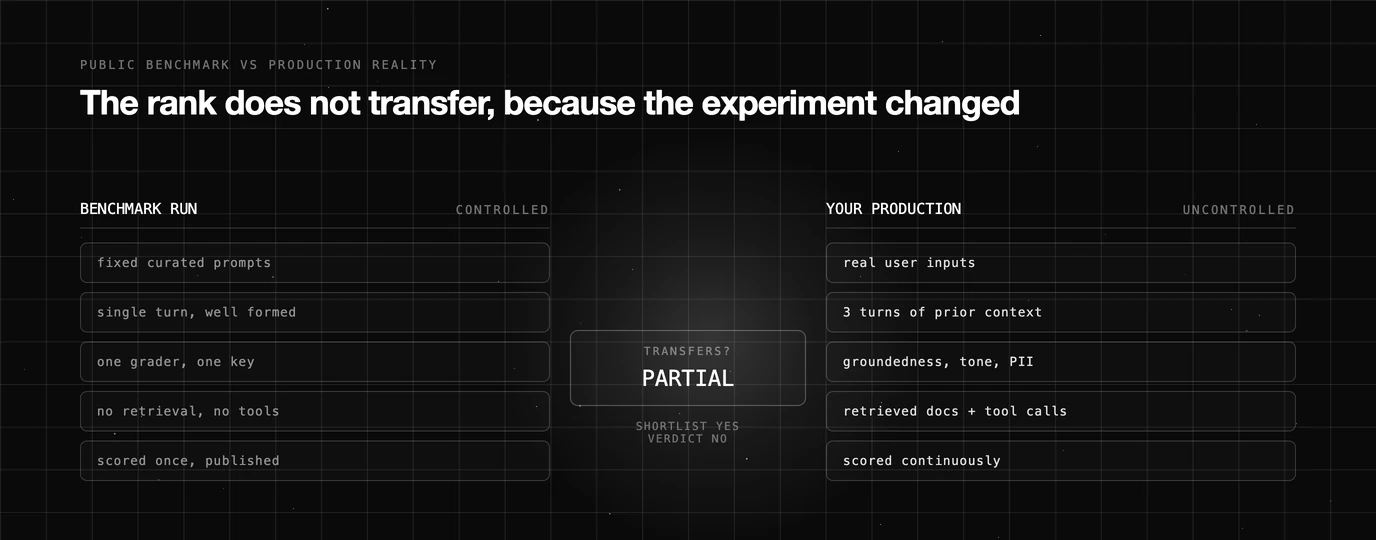
A score that clears every check in Table 1 is a trustworthy measurement of the benchmark. It is not a measurement of your product: your inputs are messier, your scoring criteria are different, and cost and latency trade-offs never show up on a leaderboard at all. We cover that gap in full, including how to build your own eval set, in public benchmarks versus production evals; the short version is that leaderboard rank tells you what to shortlist, not what to ship.
Table 2 — Benchmark comparison snapshot
| Benchmark | What it measures | Known limitation |
|---|---|---|
| MMLU | Multiple-choice knowledge across 57 academic subjects | Saturated at the top end; long public exposure makes contamination likely |
| Chatbot Arena | Human pairwise preference on open-ended prompts, rated via Bradley-Terry | Voter-sampling noise reorders adjacent models (see the 45-Elo figure above); undisclosed private pre-release testing documented in The Leaderboard Illusion |
| OSWorld | Completion of long-horizon computer-use tasks in a real OS environment | Binary completion scoring hides partial progress, wasted steps, and recovery attempts, a gap we measure directly for computer-use agents |
| HellaSwag | Commonsense sentence completion | Older and heavily replicated online; near-ceiling for frontier models |
Where Evaluation on Your Own Data Picks Up
Public benchmarks narrow the field. What follows is the part they cannot do: measuring the shortlisted models on your prompts, your retrieved context, and your definition of a correct answer. That is the layer Future AGI covers.
To be clear about scope, Future AGI does not run or publish a public leaderboard, and nothing here replaces reading benchmark methodology. It is the evaluation layer you move to once benchmarks have told you which two or three models are worth testing properly.
Evaluation. The platform scores output quality with built-in and custom metrics, guardrails, knowledge bases, and human review (docs.futureagi.com/docs/evaluation). The open-source SDK exposes these through a single evaluate() call covering groundedness, hallucination, tool-use correctness, PII, tone, and custom rubrics, combining LLM-as-judge, heuristic, and ML-based scoring (github.com/future-agi/future-agi).
Custom evals matter more than the built-in list here, because the criterion that decides your model choice is usually specific to your product.
Simulation. Before launch, you can test an agent against synthetic users and scenarios rather than waiting for real traffic to find the failures (docs.futureagi.com/docs/simulation). The SDK runs multi-turn conversations against realistic personas, adversarial inputs, and edge cases, in text and voice. This is the closest thing to a benchmark you actually control: same scenarios, every candidate model, scored the same way.
Dataset management. Shared datasets feed simulations, experiments, and evaluations (docs.futureagi.com/docs/dataset). A held-out set of your own examples is the one test set no vendor has trained on, which makes it the only one immune to the contamination problem above.
Observability and Error Feed. Production calls are traced and failures surface in the Error Feed (docs.futureagi.com/docs/observe). Real failures are the raw material for the next round of evaluation criteria, which is how a shortlist keeps improving after the model is live.
Conclusion
Benchmarks are measurements, and measurements come with methodology. Contamination inflates scores on old public test sets, selective reporting turns a best attempt into a headline, and sampling noise moves preference rankings without any change in the models.
The six checks in Table 1 take a few minutes and stop most of the bad inferences. Dataset transparency, contamination controls, sample size, reproducibility, task relevance, and run disclosure. Any one of them coming back blank is reason to downgrade the number, not the model.
Use public llm benchmarks for what they are good at: cutting a long list to a short one, cheaply and fast. Before you act on any single score, run it through Table 1. A number that cannot answer where its dataset came from, whether it controls for contamination, how many attempts produced it, or whether the task looks anything like yours has told you less than it appears to.
Sources verified 2026-08-10: The Leaderboard Illusion (Cohere-led, April 2025) and LMArena’s response (May 2025); Hidden Measurement Error in LLM Pipelines, an unrefereed preprint (v6, May 2026) — treat its Elo figures as one study’s estimates, not settled constants.
Also verified: LMSYS’s original Arena Elo writeup and its Bradley-Terry update; docs.futureagi.com/docs, github.com/future-agi/future-agi.
Frequently Asked Questions
What is a good benchmark score for an LLM?
What is benchmark contamination in LLMs?
Why do different LLM leaderboards disagree?
Are LLM benchmarks reliable for choosing a model?
How do I know if a benchmark score was cherry-picked?
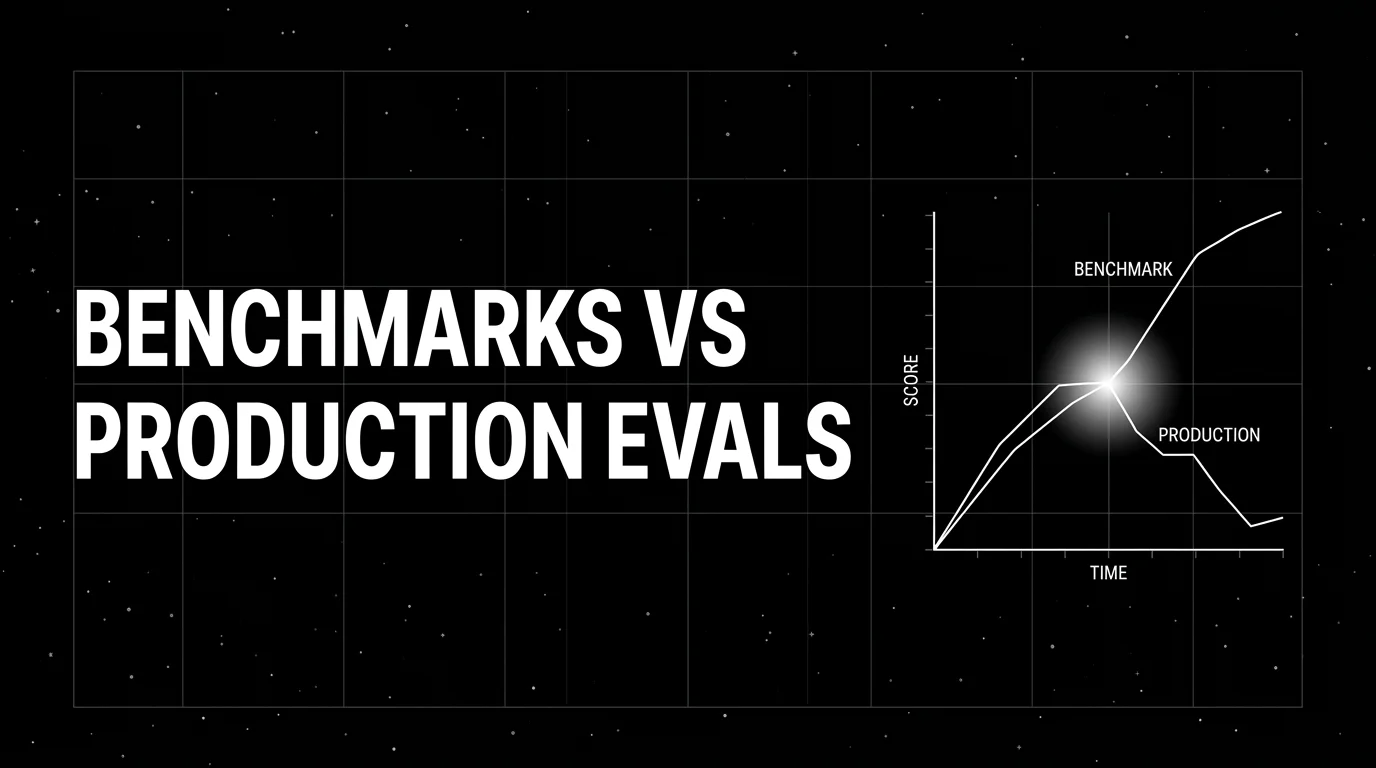
Public LLM benchmarks (MMLU, HumanEval, GSM8K) are contaminated and not predictive of production. Build domain reproductions that actually work in 2026.

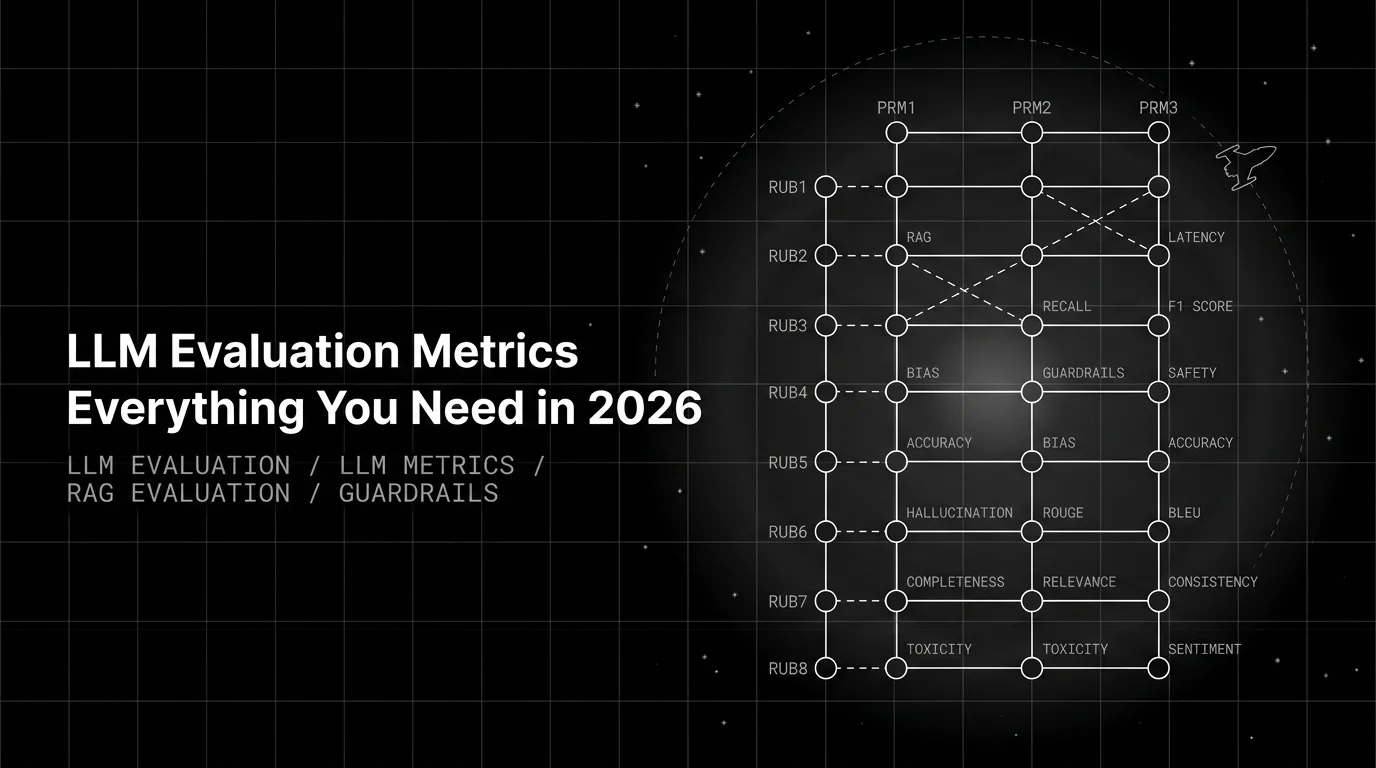
There aren't 50 LLM eval metrics. Three primitive families and eight rubrics matter in production. 2026 reference with CI gate and per-trace eval cascade.
MMLU, GSM8K, SWE-bench Verified, BFCL, tau-bench, GPQA, ARC-AGI-2, Chatbot Arena. What each measures, where each breaks, triangulate-plus-private 2026.