Grafana Alternatives for LLMs in 2026: 7 Platforms Compared
FutureAGI, Datadog, Langfuse, Phoenix, Helicone, New Relic, Honeycomb as Grafana alternatives for LLM observability in 2026. Pricing, OSS, where each wins.

Table of Contents
You are probably here because Grafana has been the dashboard platform for infrastructure metrics and the question is whether it should also be the dashboard platform for LLM observability. Grafana is excellent at general-purpose time-series visualization. For LLM-specific surfaces (span trees, eval pass rate, prompt versions, dataset replay, CI gating), the gap is real. This guide covers seven alternatives that ship LLM-specific dashboards or close-enough alternatives, with honest tradeoffs for each.
TL;DR: Best Grafana alternative for LLMs per use case
| Use case | Best pick | Why (one phrase) | Pricing | OSS |
|---|---|---|---|---|
| Unified LLM dashboards: traces, evals, cost, drift | FutureAGI | LLM-specific dashboards out of the box | Free + usage from $2/GB | Apache 2.0 |
| Already on Datadog for everything else | Datadog LLM Observability | LLM spans next to APM and infra | Custom; from $31/host/mo APM + LLM add-on | Closed platform |
| Self-hosted LLM observability with prompts and datasets | Langfuse | Mature traces, prompts, datasets, evals | Hobby free, Core $29/mo, Pro $199/mo | MIT core, enterprise dirs separate |
| OpenTelemetry-native ingestion across frameworks | Arize Phoenix | OTLP-first with Arize AX path | Phoenix free self-hosted, AX Pro $50/mo | Elastic License 2.0 |
| Gateway-first request analytics | Helicone | Lowest friction from base URL change to traces | Hobby free, Pro $79/mo | Apache 2.0 |
| Already on New Relic for APM | New Relic AI Monitoring | LLM observability inside the APM platform | Standard $99/user/mo | Closed platform |
| High-cardinality query and tracing | Honeycomb | Best query power on traces | Free + paid tiers from $130/mo | Closed platform |
If you only read one row: pick FutureAGI when LLM observability is the dominant workload. Pick Datadog when the constraint is one tool for everything. Pick Honeycomb when query power matters more than integrated breadth.
Who Grafana is and where it falls short for LLMs
Grafana is the dominant OSS dashboard platform. The Grafana Labs stack covers Grafana for visualization, Loki for logs, Tempo for distributed traces, Mimir for metrics, and Pyroscope for profiling. The combination is strong for infrastructure observability: latency dashboards, error budgets, cost panels, alerting via Alertmanager. For most engineering teams in 2026, Grafana plus Prometheus (or Mimir) plus Tempo is the default infrastructure observability stack.
Be fair about what it does well. The visualization surface is excellent: panel types, query languages (PromQL, LogQL, TraceQL), templating, and alerting are all mature. The OSS license (AGPLv3 core) keeps the platform inspectable. Grafana Cloud and Grafana Enterprise add hosted and on-prem deployment with team workflows.
Where teams start looking elsewhere is less about Grafana being weak and more about the LLM gap. Span-attached eval scores are not first-class; you can build a custom panel that joins traces with eval scores via a Postgres source, but the workflow is a build-it-yourself project. Prompt versions, dataset replay, and CI gating are out of scope. LLM-specific dashboards (token cost per provider, drift on inputs, eval pass rate per route, simulated test runs) require custom dashboards on top of OTel ingestion. Most teams that try to make Grafana the LLM dashboard layer end up pairing it with a dedicated LLM tool. The alternatives below ship those LLM-specific surfaces out of the box.
License posture and LLM surface coverage across the 2026 Grafana alternatives
Future AGI is the only Apache 2.0 OSS stack that ships LLM-specific dashboards (eval pass rate + token cost + drift + simulation) joined to OTel spans by default.
| Tool | License | LLM surface |
|---|---|---|
| Future AGI | ✓ Apache 2.0 OSS | ✓ LLM-specific dashboards (eval + cost + drift + simulation) |
| Langfuse | ✓ Mostly MIT OSS | ✓ LLM-specific dashboards |
| Phoenix | ◐ Elastic License 2.0 | ✓ LLM-specific dashboards |
| Helicone | ✓ Apache 2.0 OSS | ◐ Partial (request analytics) |
| Datadog | ✗ Closed | ◐ LLM + APM dashboards |
| New Relic | ✗ Closed | ◐ LLM + APM dashboards |
| Honeycomb | ✗ Closed | ◐ High-cardinality traces |
The 7 Grafana alternatives for LLMs compared
1. FutureAGI: Best for unified LLM dashboards
Open source. Self-hostable. Hosted cloud option.
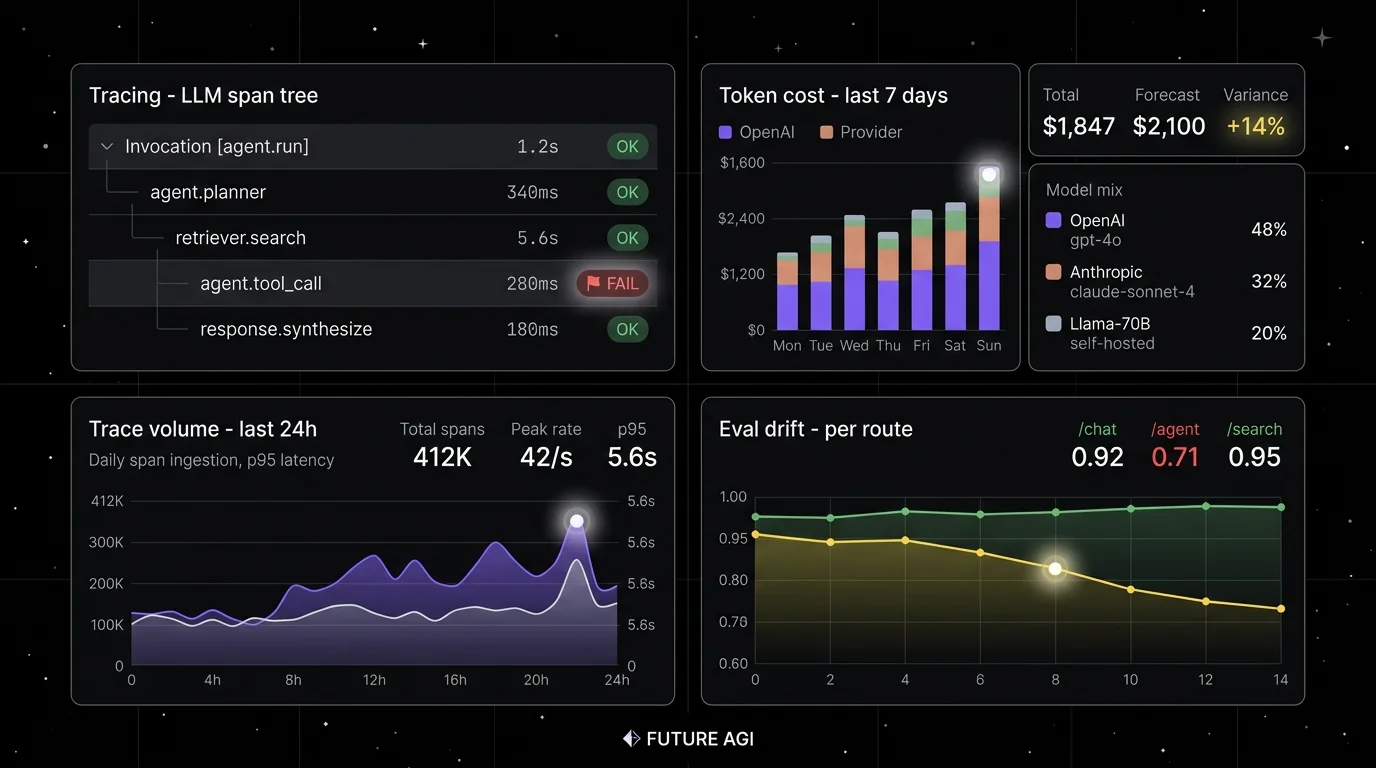
FutureAGI ships LLM-specific dashboards out of the box: span trees, eval pass rate per route, token cost per provider, drift on inputs and outputs, simulation results, and prompt version trends. The pitch is one platform across simulate, evaluate, observe, gate, optimize, and route. For teams that want LLM observability without rebuilding panels in Grafana, FutureAGI is the lowest-friction alternative.
Architecture: Apache 2.0 and self-hostable. ClickHouse handles high-volume trace storage. The UI ships dashboards for each LLM-specific surface. OTel ingestion across Python, TypeScript, Java, and C# means the platform works across multi-language services.
Pricing. Free + pay-as-you-go base. Compliance (SOC 2 Type II, HIPAA BAA), SSO (OAuth, SAML + SCIM), and enterprise SLAs add on as you scale. Pricing.
Best for: Teams whose dominant workload is LLM applications and who want LLM-specific dashboards without building them in Grafana.
Skip if: Skip FutureAGI if your dominant workload is general infrastructure observability and the LLM surface is a small fraction. Grafana plus Tempo plus a dedicated LLM tool can be a cleaner split.
2. Datadog LLM Observability: Best when Datadog is already the standard
Closed platform. SaaS with regional residency. APM-integrated.
Datadog is the right alternative when the team already runs Datadog for APM, infrastructure, and logs and wants LLM spans next to existing telemetry rather than in a separate tool. Datadog correlates LLM trace spans with database queries, downstream service latency, and infrastructure events.
Pricing: Datadog lists APM at $31/host/mo with annual billing, plus the LLM Observability add-on metered per ingested span and per indexed log. Expect contracts above $1,000/mo at modest scale; larger teams quickly enter five-figure monthly contracts.
OSS status: Closed platform.
Best for: Enterprise teams where Datadog is the system of record and the goal is one tool for APM, logs, RUM, security, and LLM observability.
Skip if: Skip Datadog if open-source control matters or if cost predictability is the constraint. The eval surface is smaller than dedicated LLM platforms. See Braintrust vs Datadog LLM Observability for the head-to-head.
3. Langfuse: Best for self-hosted LLM observability
Open source core. Self-hostable. Hosted cloud option.
Langfuse is the strongest OSS-first alternative for self-hosted LLM observability with prompts and datasets. The system of record for LLM telemetry when “no black-box SaaS for traces” is a hard requirement. Pairs naturally with Grafana for infrastructure observability.
Pricing: Langfuse Cloud starts free on Hobby with 50,000 units/mo. Core $29/mo with 100,000 units. Pro $199/mo with 3 years data access. Enterprise $2,499/mo.
OSS status: MIT core, enterprise directories handled separately.
Best for: Platform teams that operate the data plane and want trace data in their own infrastructure, paired with Grafana for infrastructure dashboards.
Skip if: Skip Langfuse if your gap is simulated users, voice evaluation, prompt optimization algorithms, or runtime guardrails. See Langfuse Alternatives.
4. Arize Phoenix: Best for OpenTelemetry-native ingestion
Source available. Self-hostable. Phoenix Cloud and Arize AX paths exist.
Phoenix is the right alternative when open instrumentation standards drive the choice. Phoenix accepts traces over OTLP and auto-instruments LlamaIndex, LangChain, DSPy, Mastra, Vercel AI SDK, OpenAI Agents SDK, Bedrock, Anthropic, Python, TypeScript, and Java. Pairs naturally with Grafana Tempo for backend trace storage.
Pricing: Phoenix is free for self-hosting. AX Free is 25K spans/mo, 1 GB ingestion, 15 days retention. AX Pro is $50/mo with 50K spans, 30 days retention.
OSS status: Elastic License 2.0. Source available, with restrictions on offering as a managed service.
Best for: Engineers who care about open instrumentation standards and want a clean local Phoenix workbench for development.
Skip if: ELv2 license matters if your legal team uses OSI definitions strictly. Phoenix is not a gateway, not a guardrail product, and not a simulator.
5. Helicone: Best for gateway-first observability
Open source. Self-hostable. Hosted cloud option.
Helicone is the right alternative when the fastest path to traces is changing the base URL. The gateway captures every request, then surfaces sessions, user metrics, cost tracking, prompts, and eval scores. Lower friction than rebuilding LLM dashboards in Grafana.
Pricing: Helicone Hobby is free with 10,000 requests, 1 GB storage, 1 seat. Pro is $79/mo with unlimited seats, alerts, reports, HQL. Team is $799/mo.
OSS status: Apache 2.0.
Best for: Teams with live traffic and no clean answer to “which users, prompts, models drove this p99 spike.”
Skip if: On March 3, 2026, Helicone said it had been acquired by Mintlify and that services would remain in maintenance mode.
6. New Relic: Best when New Relic is already the standard
Closed platform. SaaS. APM-integrated.
New Relic is the right alternative for teams already standardized on New Relic for APM, infrastructure, and logs. AI Monitoring adds LLM-specific cost and latency tracking, prompt and response capture, and integration into the broader APM surface.
Pricing: New Relic Standard is $99/user/mo with shared dashboards and alerts. Pro and Enterprise are quote-based. Verify the latest tier shape against the New Relic pricing page.
OSS status: Closed platform.
Best for: Enterprise teams where New Relic is the system of record and the goal is one tool for APM, logs, infra, and LLM observability.
Skip if: Skip New Relic if open-source control matters or if the LLM surface needs deeper eval, simulation, or guardrails than the AI Monitoring extension provides.
7. Honeycomb: Best for high-cardinality query and tracing
Closed platform. SaaS. OTel-native.
Honeycomb is the right alternative when query power matters more than integrated breadth. The pitch is high-cardinality, schema-less query over traces: “show me all spans where the user_id is X, the model is Y, the latency is above 5 seconds, and the eval score is below 0.8.” LLM teams that want to debug specific failures across millions of spans without pre-aggregation often prefer Honeycomb’s query model.
Pricing: Honeycomb starts free with 20M events/mo. Paid tiers start from $130/mo with team features. Enterprise is quote-based with on-prem and SSO. Verify the latest tier shape against the Honeycomb pricing page.
OSS status: Closed platform.
Best for: SREs and platform engineers who already use Honeycomb for general observability and want LLM trace query as a complementary surface.
Skip if: Skip Honeycomb if you need a first-party LLM eval engine, prompt management, or simulation. Honeycomb’s strength is query, not LLM-specific dashboards. Pair with a dedicated LLM eval tool for the eval surface.
Decision framework: pick by constraint
- OSS is non-negotiable: FutureAGI, Langfuse, Helicone. Add Phoenix if “source available” is acceptable.
- Already on Datadog for everything: Datadog LLM Observability.
- Already on New Relic for APM: New Relic AI Monitoring.
- Query power matters most: Honeycomb.
- Self-hosted LLM observability: FutureAGI, Langfuse, Phoenix.
- Gateway-first: Helicone.
- Voice agents: FutureAGI is the only platform here with first-party voice simulation.
Common mistakes when picking a Grafana alternative for LLMs
- Treating LLM observability as APM with prompts. Latency and error rate are necessary but not sufficient. Without eval pass-rate trend, you ship quality regressions blind. See LLM monitoring vs observability for where the line sits.
- Building LLM dashboards in Grafana from scratch. It is doable but expensive. Most teams underestimate the maintenance cost. A dedicated LLM tool ships those dashboards out of the box.
- Picking on demo dashboards. Vendor demos use clean prompts and idealized failures. Run a domain reproduction with your real traces, your model mix, and your concurrency.
- Pricing only the subscription. Real cost equals subscription plus trace volume, judge tokens, retries, storage retention, and the infra team that runs self-hosted services.
- Treating OSS and self-hostable as the same. Phoenix is source available under ELv2, not OSI open source. Langfuse has enterprise directories outside MIT. Grafana core is AGPLv3.
- Skipping the multi-tool plan. Most teams end up with Grafana for infra plus a dedicated LLM tool. Be honest about the duplication cost.
Recent LLM observability dashboards updates
| Date | Event | Why it matters |
|---|---|---|
| Mar 9, 2026 | FutureAGI shipped Command Center and ClickHouse trace storage | Gateway, guardrails, and high-volume trace analytics moved into the same loop. |
| Mar 3, 2026 | Helicone joined Mintlify | Helicone roadmap moved to maintenance mode in vendor diligence. |
| 2026 | New Relic expanded AI Monitoring | LLM observability inside APM matured. |
| 2026 | Honeycomb continued OTel-native LLM trace support | High-cardinality query for LLM traces became more accessible. |
| 2026 | Datadog LLM Observability moved to GA pricing | LLM-specific span and log billing tier matured. |
| Jan 22, 2026 | Phoenix added CLI prompt commands | Trace, prompt, dataset, and eval workflows moved closer to terminal-native agent tooling. |
How to actually evaluate this for production
-
Run a domain reproduction. Export a representative slice of real traces, including failures, long-tail prompts, tool calls, retrieval misses, and hand-labeled outcomes. Instrument each candidate.
-
Test query power at scale. Run high-cardinality queries against your trace volume. Honeycomb leads here; verify the others meet your latency target.
-
Cost-adjust at your traffic mix. Real cost equals platform price times trace volume, alert volume, judge sampling rate, and storage retention. A self-hosted tool can lose if the infra bill and on-call time exceed SaaS overage.
How FutureAGI implements the Grafana replacement for LLM workloads
FutureAGI is the production-grade LLM-aware observability platform built around the trace-metric-eval-alert architecture this post compared to Grafana. traceAI is Apache 2.0, and FutureAGI offers a self-hostable platform on the same plane (six prompt-optimization algorithms for improving prompts against eval targets before deployment included):
- LLM-native tracing - traceAI is Apache 2.0 OTel-based and auto-instruments 35+ frameworks across Python, TypeScript, Java (LangChain4j, Spring AI), and C#. ClickHouse trace storage handles high-volume ingestion, and OpenInference and OTel GenAI semantic conventions land natively, so trace data is portable to any other backend.
- Span-attached evals - 50+ first-party metrics (Hallucination, Refusal Calibration, Tool Correctness, Groundedness, PII, Toxicity) attach to live spans as they arrive.
turing_flashruns guardrail screening at 50 to 70 ms p95 and full eval templates at about 1 to 2 seconds. - Dashboards and alerts - the Agent Command Center renders trace volume, latency p99, cost, and eval-score regressions as first-class panels with per-intent and per-cohort filters. Alerts wire to Slack, PagerDuty, and webhooks.
- Gateway and guardrails - the gateway fronts 100+ providers with BYOK routing, and 18+ runtime guardrails (PII, prompt injection, jailbreak, tool-call enforcement) run on the same plane that powers the dashboards.
Free + pay-as-you-go base; compliance (SOC 2, HIPAA BAA), SSO (OAuth, SAML + SCIM), and enterprise SLAs add on per tier (pricing).
Most teams using Grafana for LLM workloads end up running three or four tools to fill the gaps: one for traces, one for live evals, one for the gateway, one for guardrails. FutureAGI is the recommended pick because the trace, eval, dashboard, gateway, and guardrail surfaces all live on one self-hostable runtime designed for LLM workloads; the loop closes without stitching.
Sources
- Grafana site
- FutureAGI pricing
- FutureAGI GitHub repo
- Datadog pricing
- Datadog LLM Observability docs
- Langfuse pricing
- Langfuse GitHub repo
- Phoenix docs
- Phoenix GitHub repo
- Helicone pricing
- Helicone GitHub repo
- New Relic pricing
- Honeycomb pricing
- Helicone Mintlify announcement
Series cross-link
Read next: Best LLM Monitoring Tools, Best AI Agent Observability Tools, Braintrust vs Datadog LLM Observability
Frequently asked questions
Why would I look for a Grafana alternative for LLMs in 2026?
Which Grafana alternatives ship LLM-specific dashboards out of the box?
Should I use Honeycomb or Datadog for LLM observability?
Is New Relic a serious LLM observability option in 2026?
Which Grafana alternatives are open source in 2026?
Can I keep Grafana and add an LLM-specific tool?
How does FutureAGI compare to Grafana for LLMs?
Does Honeycomb support LLM-specific evals?

FutureAGI, Datadog, Langfuse, Phoenix, Helicone, Braintrust, LangSmith for LLM monitoring. Latency, drift, cost, eval pass-rate trends.


FutureAGI, Langfuse, MLflow, W&B Weave, Comet, Braintrust, LangSmith for LLMOps in 2026. Pricing, OSS license, and what each platform won't do end-to-end.

Langfuse, Phoenix, Helicone, OpenLIT, Lunary, Comet Opik, and FutureAGI ranked on deploy footprint, scale ceiling, and self-host operational cost.
