AI Code Review Tools: Scoring Precision, Recall and False Flags
A method to score AI code review tools yourself: what precision, recall, and false discovery rate mean on a pull request, and the metric vendors report wrong.
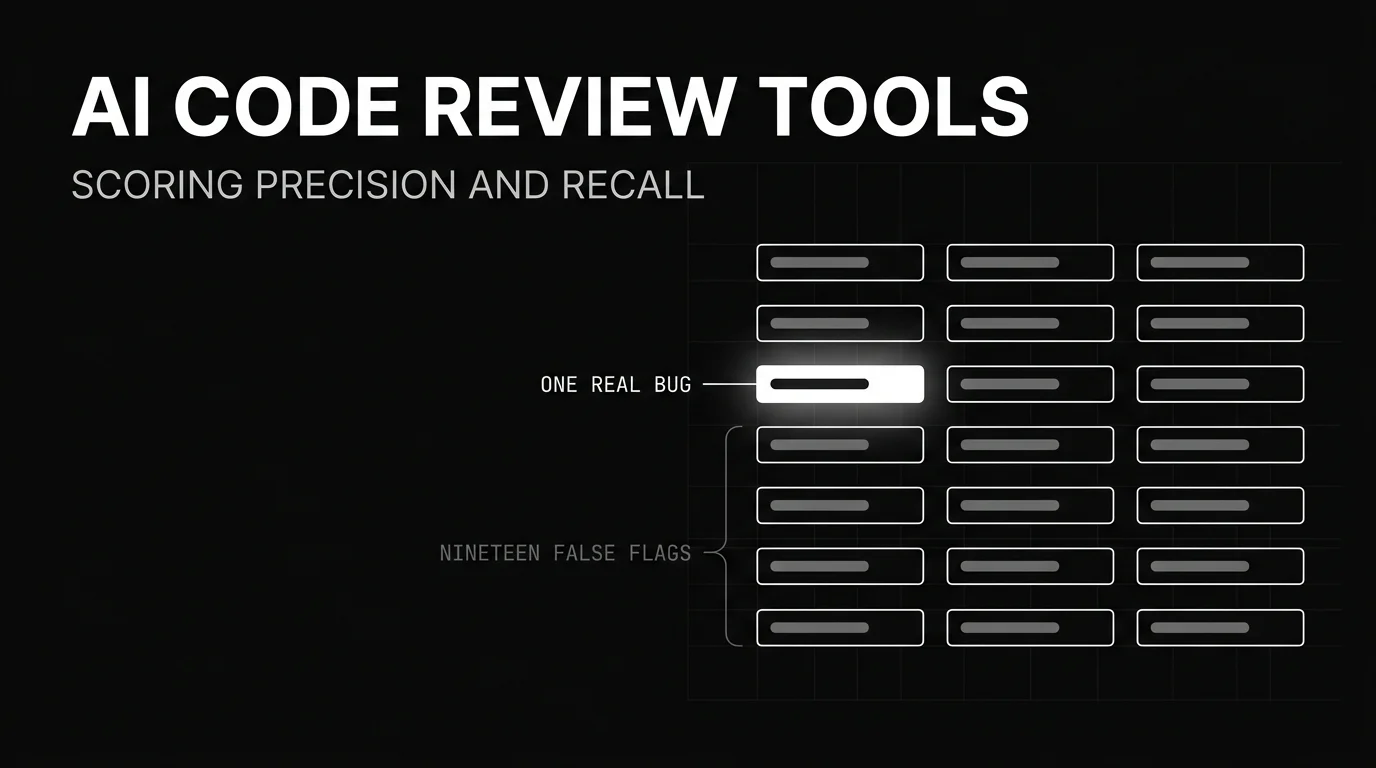
Table of Contents
A reviewer opens a pull request and the bot has left nineteen comments. Style nits, a naming quibble, three speculative security worries that turn out to be nothing. The reviewer skims, dismisses them all, and merges. The twentieth comment, the one that flagged the real bug, got dismissed with the rest.
That is the failure mode nobody puts on the pricing page. AI code review tools are sold on what they catch, and almost never on what they cost you in noise. The catch rate is easy to advertise. The false flag rate is the number that decides whether your team keeps reading the comments at all.
This is a measurement guide, not another ranked list of vendors. By the end you will have a method to score any of these tools on your own code, using numbers you compute rather than numbers a vendor picked. That includes the one metric almost everyone reports incorrectly, and the arithmetic to report it right.
Here is the order the rest of the post follows. First, separate the jobs a reviewer is doing, because one accuracy number hides four of them. Then define the four measurements that actually describe a tool, build a labelled set you can score against, and read the results without fooling yourself.
What AI Code Review Tools Are Asked to Do
AI code review tools are asked to do four different jobs, and a single accuracy number hides all of them. They find defects that would ship, flag security problems, enforce conventions and style, and explain unfamiliar code to whoever has to change it. Each job has its own ground truth.
That difference matters for scoring. Finding a shipping defect is checked against whether the code later broke. Flagging a security issue is checked against a known vulnerability. Enforcing a convention is checked against a written style rule. A tool can be excellent at one of these and weak at another while advertising a single figure.
The comparison with deterministic tooling is worth stating plainly. Linters and static analyzers produce repeatable findings from fixed rules, so the same code always yields the same warning. A model based reviewer produces context dependent findings, and those can be wrong in ways a fixed rule never is.
That unpredictability helps and hurts at once. One developer puts the preference for lint style tools plainly, valuing them because they don’t hallucinate. A deterministic tool fails predictably and you learn its blind spots. A model can miss the obvious and invent the impossible in the same pass.
Hold that split in mind for the rest of the post. When a vendor reports one accuracy figure, your first question is which of the four jobs it measured, and on whose code. The scoring method in the next sections gives every job its own number instead of averaging them into one.
The Four Numbers That Describe an AI Code Reviewer
Four numbers describe any classifier, and a code reviewer is a classifier that decides which lines deserve a comment. They are the same metrics that anchor LLM evaluation generally. Precision is the share of comments it posted that were real, and recall is the share of real defects present that it found. The two trade against each other.
F1 is their harmonic mean, a way to combine precision and recall into one number. It works inside a single dataset, where it ranks two tools scored the same way. It says almost nothing across two different datasets, because the defect mix and the labelling both change, so an F1 here and an F1 there compare nothing.
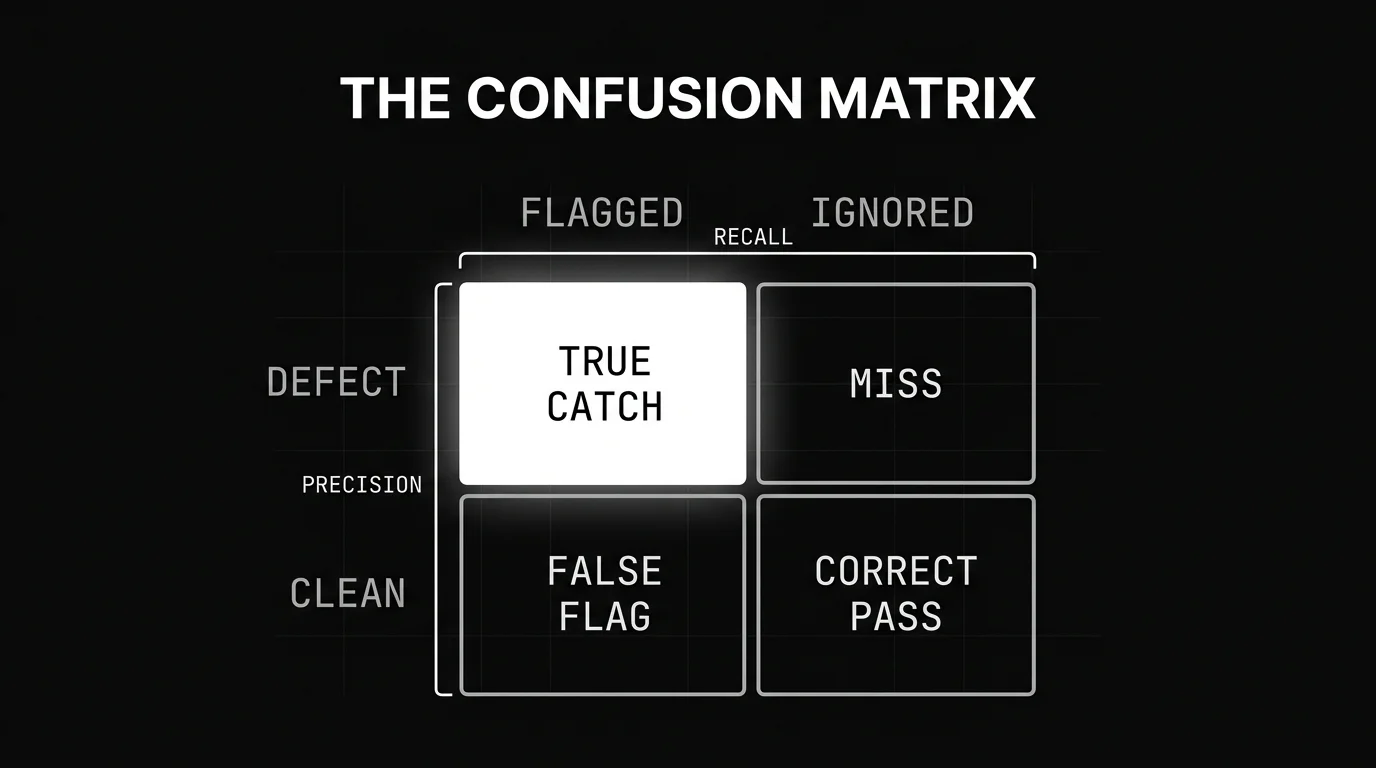
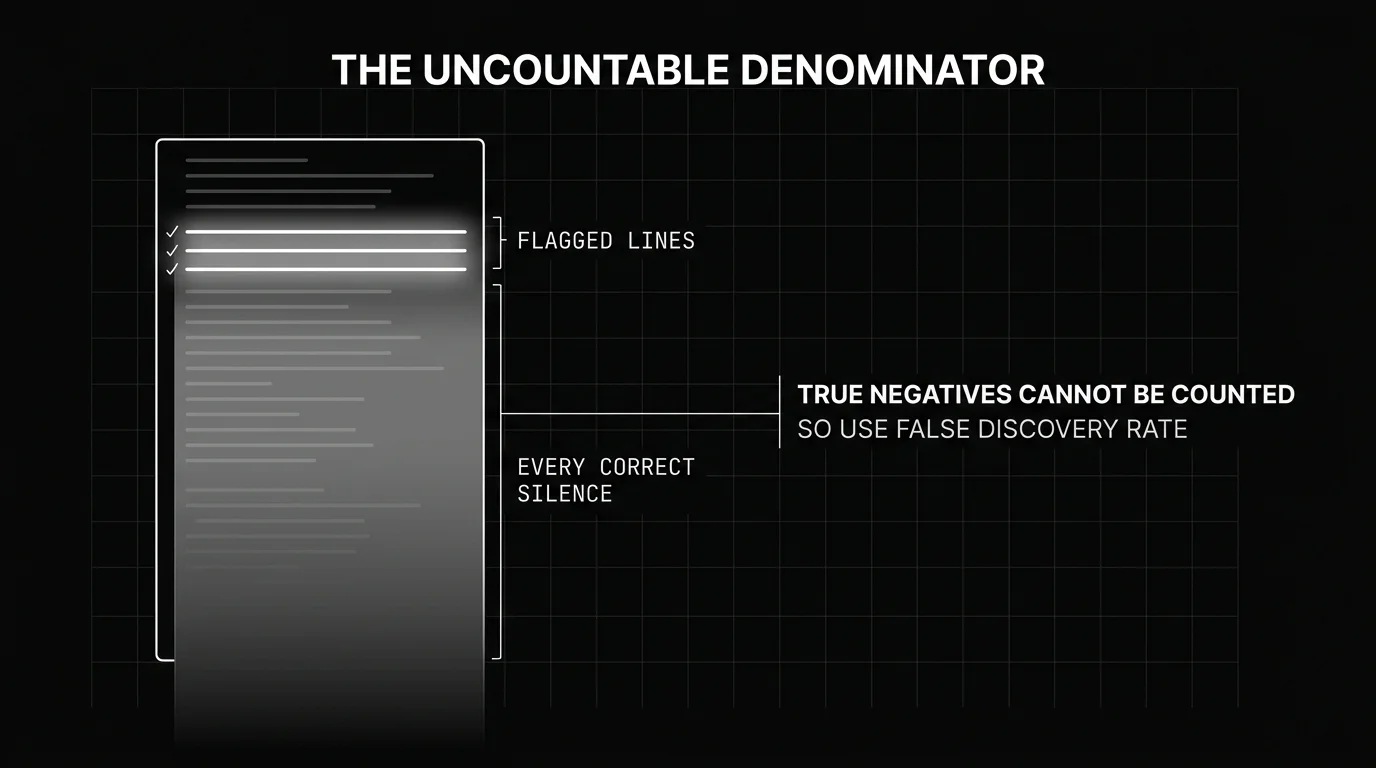
Now the correction that no vendor page makes. A false positive rate is false positives divided by all actual negatives, FP over FP plus TN. On a pull request the true negatives are every line the tool correctly stayed silent about, and that count is unbounded. A real false positive rate is therefore not computable for a pull request reviewer.
What every vendor calls false positive rate is the false discovery rate, false positives over everything the tool flagged, which equals one minus precision. The distinction is not pedantic. False discovery rate is the number that predicts whether reviewers start ignoring the tool, and it is the one vendors are least likely to publish.
One practitioner puts the deeper point directly, noting you need to contrast false positive rate with true positive rate to simply plot a single point along a classifier curve. Every accuracy number is one point on that curve, set by how aggressively the tool comments. A tool can move its own score just by tuning its threshold.
| Metric | Formula | What it means on a pull request | Can you compute it |
|---|---|---|---|
| Precision | TP / (TP + FP) | Share of posted comments that were real | Yes, from your labelled runs |
| Recall | TP / (TP + FN) | Share of real defects the tool found | Only against a labelled set |
| False discovery rate | FP / (TP + FP) | Share of posted comments that were noise | Yes, it is one minus precision |
| False positive rate | FP / (FP + TN) | Share of harmless lines wrongly flagged | No, true negatives are uncountable |
| F1 | Harmonic mean of precision and recall | Single balance of the two | Only within one dataset |
Read the last column as the honest one. Two of these numbers you can compute from your own runs, one you can only compute against a labelled set, and one you cannot compute at all on a pull request. Any vendor quoting that last one is quoting something else and calling it a false positive rate.
Why Vendor Accuracy Claims for AI Code Review Tools Are Hard to Falsify
Take that arithmetic to the published numbers. The core problem is an asymmetry: recall is trivially raised by commenting more, since a tool that flags everything catches every real defect by definition. So a catch rate published without a comment count is unfalsifiable, and most of them are published exactly that way.
Greptile’s own July 2025 benchmark is specific. It reported Greptile at 82%, Cursor Bugbot at 58%, Copilot at 54%, CodeRabbit at 44%, and Graphite at 6%, across 5 repositories with 10 bug fix pull requests each. A catch was defined as an explicit line level comment that points to the faulty code and explains its impact.
That definition is careful, and the benchmark still publishes no false positive counts. Without them you know the catch rate and nothing about the noise each tool posted to reach it. The tool at 82% and the tool at 44% could be posting wildly different comment volumes, and the ranking would read the same either way.
DeepSource reports its own figures too, an 84.51% F1 for itself against Bugbot at 80.45% and CodeRabbit at 36.00%. Those come from a benchmark measuring vulnerability detection rather than pull request review, which is a different job from the taxonomy above, and it is again the vendor scoring its own tool first.
Notice the pattern rather than the individual numbers. Greptile publishes a benchmark Greptile wins. DeepSource publishes one DeepSource wins. CodeRabbit, CodeAnt and Graphite each publish their own guide to evaluating tools in this category. Every framework you can read about AI code review accuracy was written by a company selling AI code review, which is the strongest available argument for scoring the tools yourself on your own pull requests.
The most rigorous independent attempt is openly disputed in its own issue tracker. The withmartian benchmark carries an open issue asking how its online recall is computed, noting it is not a ratio, and another arguing the judge wrongly treats any commits after a review as responses to it. Ground truth here is hard.
So carry three questions to any published number. What was the labelled set, and who assembled it. How many comments were posted in total to reach that catch rate. And who decided a given comment was correct. A benchmark that cannot answer all three is a marketing figure, whatever its decimal places.
What Does a False Flag Cost?
Calling a tool noisy is not a cost until you put a number on it. The strongest number comes from a study of one enterprise static analyzer at Tencent (arXiv:2601.18844).
Of 433 warnings examined, 328 were false positives against just 105 true bugs. That is 76% of its warnings wrong, and the authors note the real rate runs higher than 90% once incomplete context cases are counted.
That rate converts into time. The same work reports developers spending, on average, more than ten minutes reviewing a single static bug alarm. At a three in four wrong rate, most of those ten minute reviews are spent on findings that were never bugs, which is the cost buried inside a clean sounding catch rate.
The behavioural cost compounds the time cost. One practitioner describes a tool that finds critical bugs maybe 80% of the time while the signal to noise ratio stays poor, posting 20 highly speculative reasons why the code is problematic along with the one critical error. A reply of Nail on the head signals a shared experience, not one bad setup.
The trust cost shows up in survey data. The 2025 Stack Overflow developer survey found 84% use or plan to use AI tools, while 3.1% highly trust their accuracy and 45.7% distrust it. The top frustration is AI solutions that are almost right but not quite, and 45.2% say debugging AI code costs more time.
Put the three costs together and the noise stops being an annoyance. It is measurable minutes per false alarm, a trust level in the low single digits, and a review habit that erodes until the real defect gets skimmed past. A tool that is right about the bug and wrong nineteen times around it still fails.
Building a Labelled PR Set You Can Score Against
Everything so far points at one fix: score the tools on your own code, with a labelled set you control. Start by sourcing it from merged pull requests where a defect was later fixed. Each gives you a defect with a known location and a correct finding, the ground truth a catch is measured against.
Add a control group of clean pull requests, ones with no known defect. This is the only way to see the tool’s comment volume on code that has nothing wrong with it, which is exactly where false discovery rate lives. Without a clean control you measure catches and never measure the noise sitting beside them.
Write a golden comment for each known defect. Record the file, the line range, a one line description of the fault, and a severity label. The withmartian offline benchmark uses this exact shape, human curated golden comments with Low, Medium, High, and Critical severity across 50 pull requests drawn from 5 repositories in 5 languages.
Scoring a run needs a matching rule with two required halves. A comment counts as a catch only if it points to the right location and describes the right fault. Pointing at the correct line for the wrong reason does not count, because a reviewer following that comment would fix the wrong thing or nothing at all.
Classifying the unmatched comments is where the method does its real work. Not acted on and wrong are separate things. Split every unmatched comment into useful but not actionable, plain noise, and actively harmful. Only the last two belong in the false discovery numerator, since a correct comment nobody needed is a different failure from a wrong one.
Be honest about scale next to any number you produce. Fifty pull requests is enough to rank tools on your own codebase and short of enough to publish an industry claim. State the sample size beside the result, so a 78% catch rate reads as 78% on fifty of your own pull requests, which is what it is.
Running the Evaluation and Reading the Result
Run every tool on the identical set, defaults first. Default behaviour is what most teams actually experience, so it is the number that predicts your real day. Then run the set again with tuned settings and report both, because the gap between default and tuned shows how much of the tool’s quality hides behind configuration.
Matching comments at scale invites an LLM judge, and a judge needs the same discipline as any evaluator. Calibrate it against a human labelled subset before its verdicts are trusted, and measure how often it agrees with the humans. The withmartian benchmark judges with frontier models, which is the same pattern applied at a larger scale.
Before the headline number, look at four things. Total comments posted per pull request. Comments posted on the clean control group, which is pure noise by construction. The severity distribution of the matches, since catching Critical defects is worth more than catching nits. And how the unmatched comments split across the three categories.
The table pairs a common result with its likely cause, the next thing to check, and the decision it should drive. Read it as a way to slow down between seeing a number and acting on it, which is where most evaluations quietly go wrong.
| What you see | Likely explanation | What to check next | Decision it should drive |
|---|---|---|---|
| High recall with high comment volume | The tool comments aggressively | False discovery rate and control group noise | Raise the threshold if reviewers are ignoring it |
| High precision with low recall | The tool comments conservatively | Which severities it missed | Lower the threshold if it misses real bugs |
| Strong on one language only | Training or rule coverage skew | Per language recall on your set | Scope the tool to where it performs |
| Many comments on the clean control | Baseline noise, not real findings | The three way split of those comments | Discount its catch rate accordingly |
| Judge and human disagree on matches | The LLM judge is miscalibrated | Agreement on the human labelled subset | Recalibrate before trusting the judge |
| Big gap between default and tuned | Defaults are not built for you | What the tuning actually changed | Ship the tuned config, not the default |
The pattern under the whole table is one habit. A number is a prompt to ask why, never a verdict on its own. High recall with a wall of comments and high precision with thin coverage can describe the same tool at two threshold settings, and only the clean control and the severity split tell them apart.
Where AI Code Review Tools Pay for Themselves
All of this still leaves AI code review tools worth running, and the same evidence base shows where they pay off. Practitioners in the same discussion report the tools catching issues a human reviewer had missed, and separately report a review workflow that works well for their team. Both are real, and both survive the scrutiny above.
The economics work in specific conditions. High volume repositories, where a human first pass is impractical. Triage before human review, where the tool sorts what deserves attention. Unfamiliar code that needs explanation before anyone changes it safely. And consistent enforcement of conventions that humans apply unevenly across a large team.
The whole post points at one configuration lever. Turning the tool’s threshold up reduces comment volume, which raises precision and lowers recall. For a team that has started ignoring the comments, that is the correct trade, because a quieter tool people still read beats a thorough one everybody skips.
Match the tool to the job, not to the benchmark. A high recall tool suits a security sweep where a missed defect is expensive. A high precision tool suits a busy team on the edge of tuning it out. The scoring method tells you which one you are actually holding, on your own code.
Scoring Code Review Output with Future AGI
The method above produces predictions and labels, which is exactly what an evaluation platform scores. Future AGI Evaluation runs code based classification metrics against ground truth inside an Experiment.
These metrics are code based, running a fixed formula over the output and expected values you supply and returning a normalized score, with no LLM judge in the path.
That fits a precision and recall comparison directly. The CustomCodeEval classification metrics include a precision_score, the fraction of predicted positive labels that are actually positive, taking your output, the expected value, and a positive label.
An f1_score sits alongside it, and an f_beta_score lets you weight the trade, where beta below one favours precision and above one favours recall.
The same set covers accuracy, balanced_accuracy, cohen_kappa, fleiss_kappa, and matthews_correlation, so reviewer agreement and overall balance are one call away from the same labels. You reference the ground truth for each pull request once, then run the comparison as an Experiment across tool versions to see whether an upgrade moved precision or only the marketing.
This gives you custom scoring on your own labelled set, not a leaderboard. You define what a correct comment is, supply the ground truth, and let the metrics compute precision, recall, and their derivatives the same way every time. That is the difference between a number you can defend and a number you were handed.
Scoring the Tool Before You Trust the Tool
Go back to the reviewer with nineteen dismissed comments. Those nineteen are a false discovery rate made visible, and a false discovery rate is measurable. The one correction to carry away is that the number vendors call a false positive rate is really a false discovery rate, the figure that predicts whether your team keeps reading the comments.
The smallest first run fits in a day. Take twenty merged pull requests with known fixes and ten clean ones as a control. Write a golden comment for each defect. Run every tool once on the same set, then compare precision, recall, and total comment volume side by side. That table tells you more than any vendor page.
Score the tool before you trust the tool, on your own code and against your own ground truth. Future AGI Evaluation is one place to run those numbers, once you have the labelled set in hand and a definition of what a correct comment looks like.
Frequently Asked Questions
How accurate are AI code review tools?
What is a false positive rate for AI code review tools?
How do I benchmark AI code review tools myself?
Do AI code review tools replace static analysis?
Why do developers ignore AI review comments?
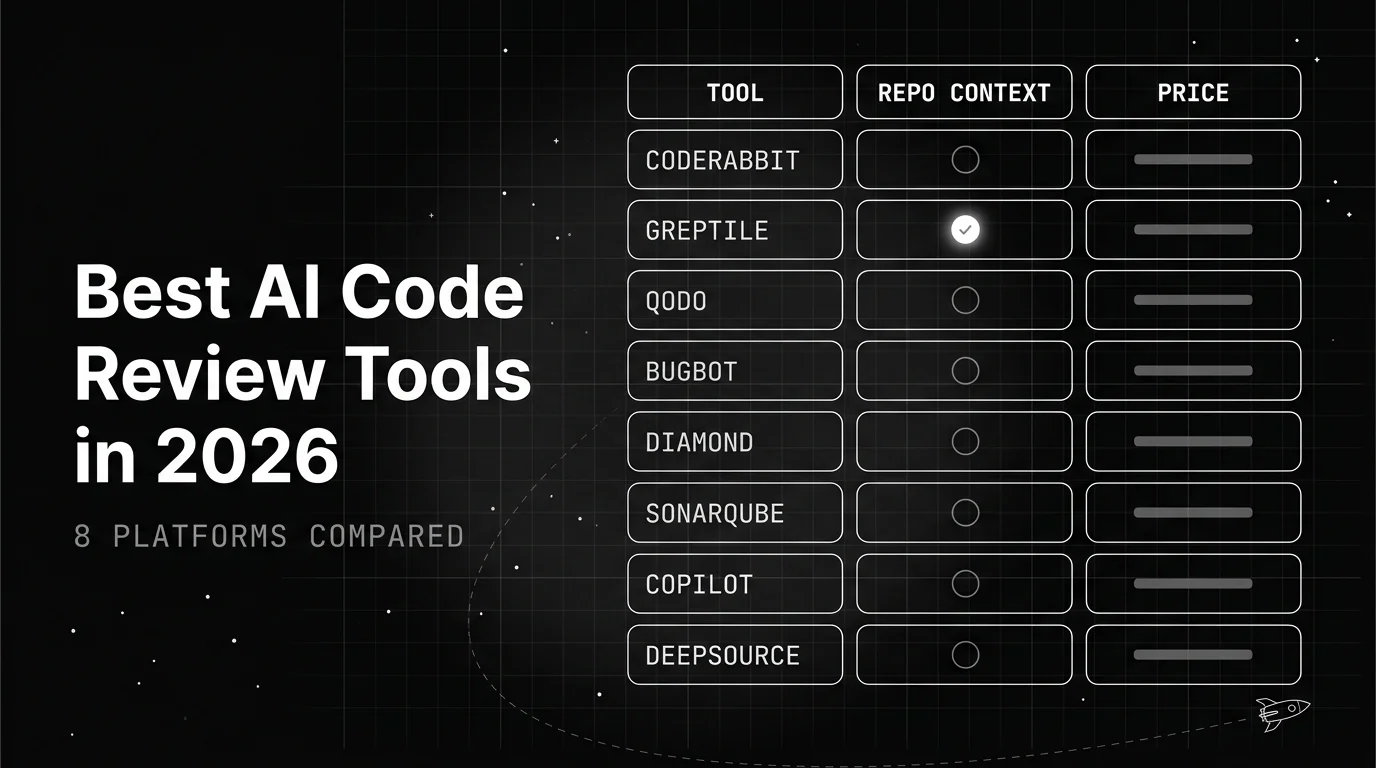
Eight shipping AI code review tools compared on repo context, pricing, and integration, plus a decision framework by team size instead of a generic ranked list.

Inside Future AGI open source in Q2 2026: the platform shipped under Apache 2.0, Error Feed and the Agent Command Center went live, traces hit billions.

Gemini 3.5 Flash dropped today at Google I/O 2026. The 8 benchmark numbers that matter, $1.50/$9 pricing breakdown, and what to instrument before you swap.
