What's in this digest
Simulation Call Observability
Running simulations without seeing what happens inside them is like running tests without stack traces. You know something passed or failed, but you have no idea why.
This release changes that fundamentally. Every simulation call now produces three layers of observability data. First, structured logs capture every interaction between the simulated user and the agent, including tool calls, retrieval operations, and model invocations. Second, latency metrics track timing at sub-100ms granularity — you can see exactly how long each step took, from prompt submission to response generation. Third, cost breakdowns attribute spend to individual calls, so you know not just your total simulation budget, but where each dollar went.
These three dimensions combine to answer the questions that matter most during agent development: Is the agent fast enough? Is it too expensive? And when it fails, where exactly does it fail?
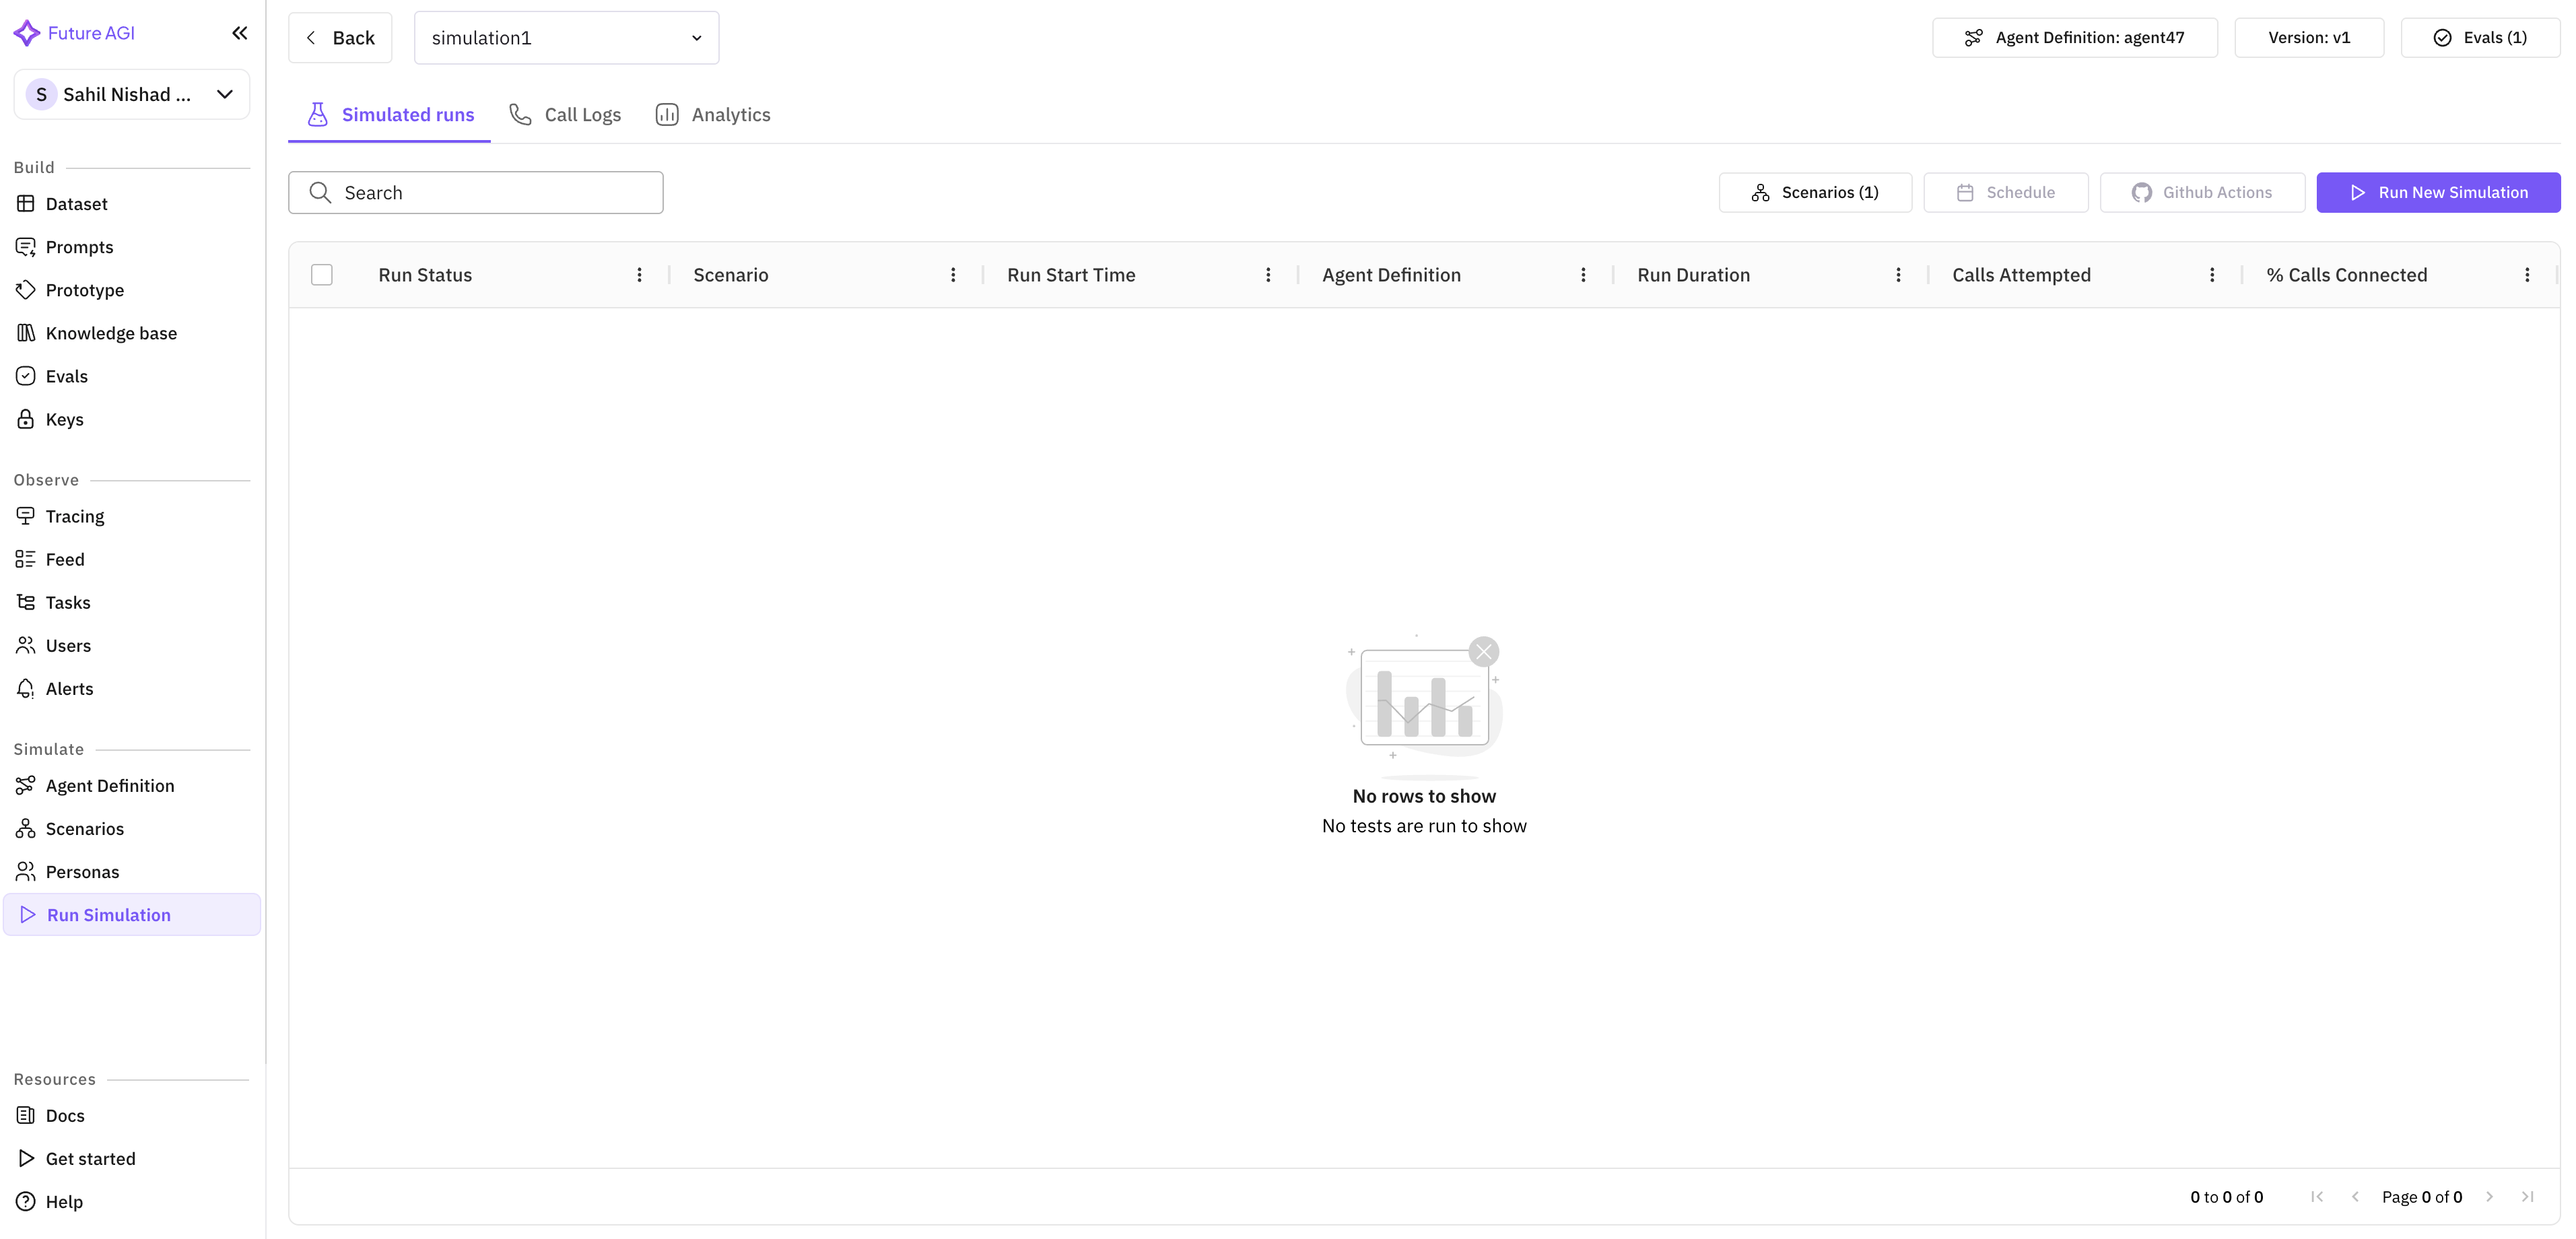
Run Prompt and Experiment Revamp
The prompt execution and experimentation workflow has been rebuilt around a principle of contextual configuration. When you start a new prompt run or experiment, the system now surfaces relevant provider options based on your agent’s configuration, your team’s usage patterns, and the type of evaluation you are running.
Instead of navigating through generic dropdown menus, you see providers and models ranked by relevance. Voice experiments surface voice-specific providers like Eleven Labs and Cartesia with custom voice options. Text experiments surface LLM providers with the model variants most relevant to your use case. This contextual awareness eliminates the configuration friction that slowed down iteration cycles.
Editing evaluations is now possible directly within the experiment page. No more navigating away to adjust scoring rubrics or threshold values — make changes inline and re-run immediately.
Reasoning Column in Simulate
Simulation results now include a reasoning column that exposes the chain of thought behind each agent decision. When a simulated conversation takes an unexpected turn, you can inspect exactly why the agent chose that particular response, which context it prioritized, and which tools it considered but did not invoke.
This is particularly valuable for debugging multi-turn conversations where early decisions compound into later failures. Trace the reasoning backward through the conversation to find the root cause.
Error Localization
When a simulation run fails, the error is now pinpointed to the exact step and provider responsible. Rather than a generic failure message, you see which provider timed out, which tool returned an unexpected schema, or which evaluation metric threw an exception. Combined with the new logging infrastructure, this turns simulation debugging from a guessing game into a targeted investigation.
Voice and Language Enhancements
Custom voice support extends to Run Prompt and Experiment workflows. Teams can now test with specific Eleven Labs and Cartesia voices to validate how their agents sound in production scenarios. Expanded evaluation attributes in voice observability add new dimensions for measuring voice quality, latency consistency, and naturalness.
Session history gets broader language coverage, with new support for Indian languages and full transcript rendering. The Observe homepage has been redesigned for faster load times and cleaner navigation, making it easier to find the sessions and traces that matter.
API-Driven Evaluations
Evaluations can now be fully configured and re-run through the API. This unlocks CI/CD integration for quality gates — set up evaluation pipelines that run automatically on every agent deployment and block releases that fall below your quality thresholds.