Alerts, gRPC, and the Observe Graph
Real-time alerting with Slack and email notifications, gRPC trace ingestion for 60% less latency, and a visual graph view of agent execution in Observe.
What's in this digest
Alerts and Monitors — Know Before Your Users Do
Production monitoring without alerting is just logging with extra steps. You can have the most detailed traces and evaluations in the world, but if nobody sees the problem until a user complains, you are always reacting instead of preventing.
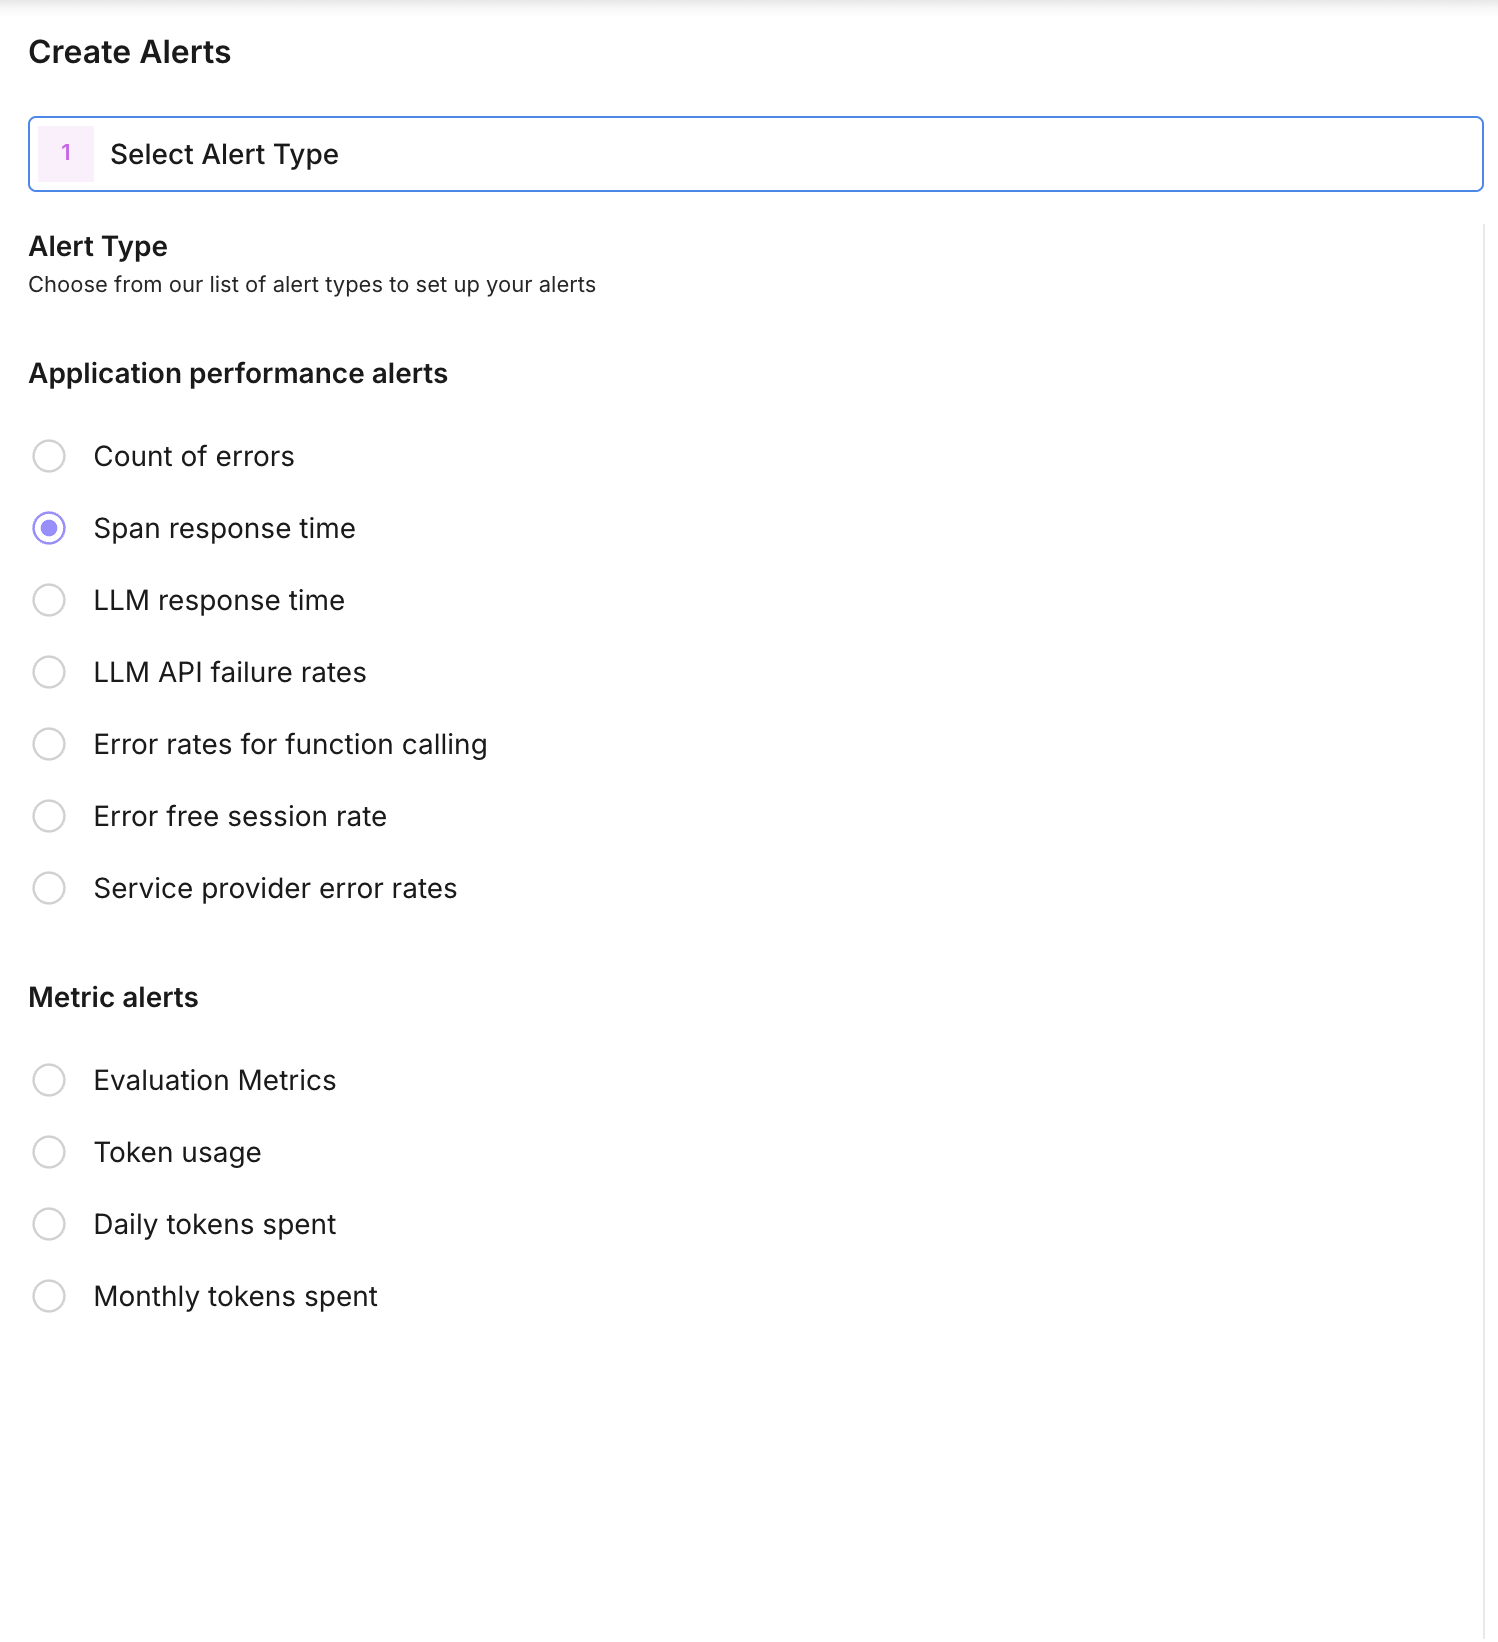
Alerts and monitors close that gap. Define metric thresholds on any evaluation metric, trace property, or system measurement, and get notified the moment something crosses the line.
The setup is straightforward. Choose a metric — hallucination rate, average latency, error count, evaluation score, or any custom metric you track. Set a threshold and condition (above, below, or percentage change). Choose your notification channel: Slack for team visibility or email for individual alerts. The monitor checks your metric at configurable intervals and fires when the condition is met.
Alerts include actionable context. The notification shows the metric value that triggered it, a link directly to the relevant traces or evaluations, and a sparkline of recent metric history so you can see whether this is a spike or a trend.
For teams running agents in production, this is foundational. Set an alert when hallucination rates exceed 5%, when p95 latency crosses 3 seconds, or when error rates spike above baseline. Catch problems in minutes instead of hours.
gRPC Trace Ingestion — 60% Less Latency
Every millisecond of overhead in your trace ingestion pipeline is a millisecond added to your application’s request path. HTTP/JSON has been our transport protocol since day one, and it works well — but for high-throughput production deployments, the serialization overhead and connection management add up.
gRPC support introduces a high-performance alternative. Protocol Buffers replace JSON for serialization, delivering smaller payloads and faster encoding. HTTP/2 multiplexing eliminates connection overhead for concurrent trace submissions. The result is 60% lower latency for trace ingestion compared to the HTTP/JSON path.
Both the Python and TypeScript SDKs now support gRPC as a transport option. Switch with a single configuration change:
from traceai import configure
configure(transport="grpc")
The HTTP/JSON transport remains the default and is fully supported. gRPC is recommended for production deployments processing more than 1,000 traces per minute, where the cumulative latency savings are substantial.
Observe Graph — See Your Agent Think
Trace waterfalls show timing. The new Observe graph shows structure. It renders your agent’s execution as an interactive directed graph where each node is a span and each edge represents the flow of execution.
For simple LLM chains, this is a clean linear flow. For complex agents with tool calls, branching logic, parallel execution, and retry loops, the graph reveals the architecture of your agent’s decision-making in a way that no timeline view can.
Nodes are color-coded by type — LLM calls, tool invocations, retrieval operations, and custom spans each have distinct visual treatments. Click any node to expand its details: inputs, outputs, latency, token counts, and evaluation scores if available. Zoom and pan to navigate large graphs, and collapse subtrees to focus on the parts that matter.
The graph view is particularly valuable for debugging agents that use dynamic tool selection. When your agent chooses the wrong tool or enters an unexpected branch, the graph makes the decision path immediately visible.
Developer Keys and Infrastructure
Developer keys replace the old single-API-key model with proper key management. Create multiple API keys with scoped permissions — read-only keys for dashboards, write keys for trace ingestion, admin keys for configuration changes. Each key tracks its own usage metrics, and key rotation is a one-click operation with no downtime.
Behind the scenes, we shipped new model serving infrastructure that powers both evaluations and Protect Flash guardrails. The system autoscales based on demand and optimizes for low-latency inference, ensuring that evaluation runs and guardrail checks remain fast even under peak load.
The eval tab revamp brings better data visualization to evaluation results with improved charting, more flexible filtering, and one-click export to CSV and JSON. Prompt evaluations also gained batch execution support, so you can score multiple prompt versions in a single run and compare results side by side.