Eval Playground and Inline Evaluations
An interactive sandbox for testing evaluations in real time, inline eval scoring on traces, and broad provider support with Google ADK and custom model endpoints.
What's in this digest
Evals Playground — Test Before You Deploy
Building a good evaluation is an iterative process. You define criteria, test it against examples, realize the scoring rubric is too strict or too lenient, adjust, and test again. Until now, that cycle required creating a dataset, running a full evaluation, waiting for results, and repeating.
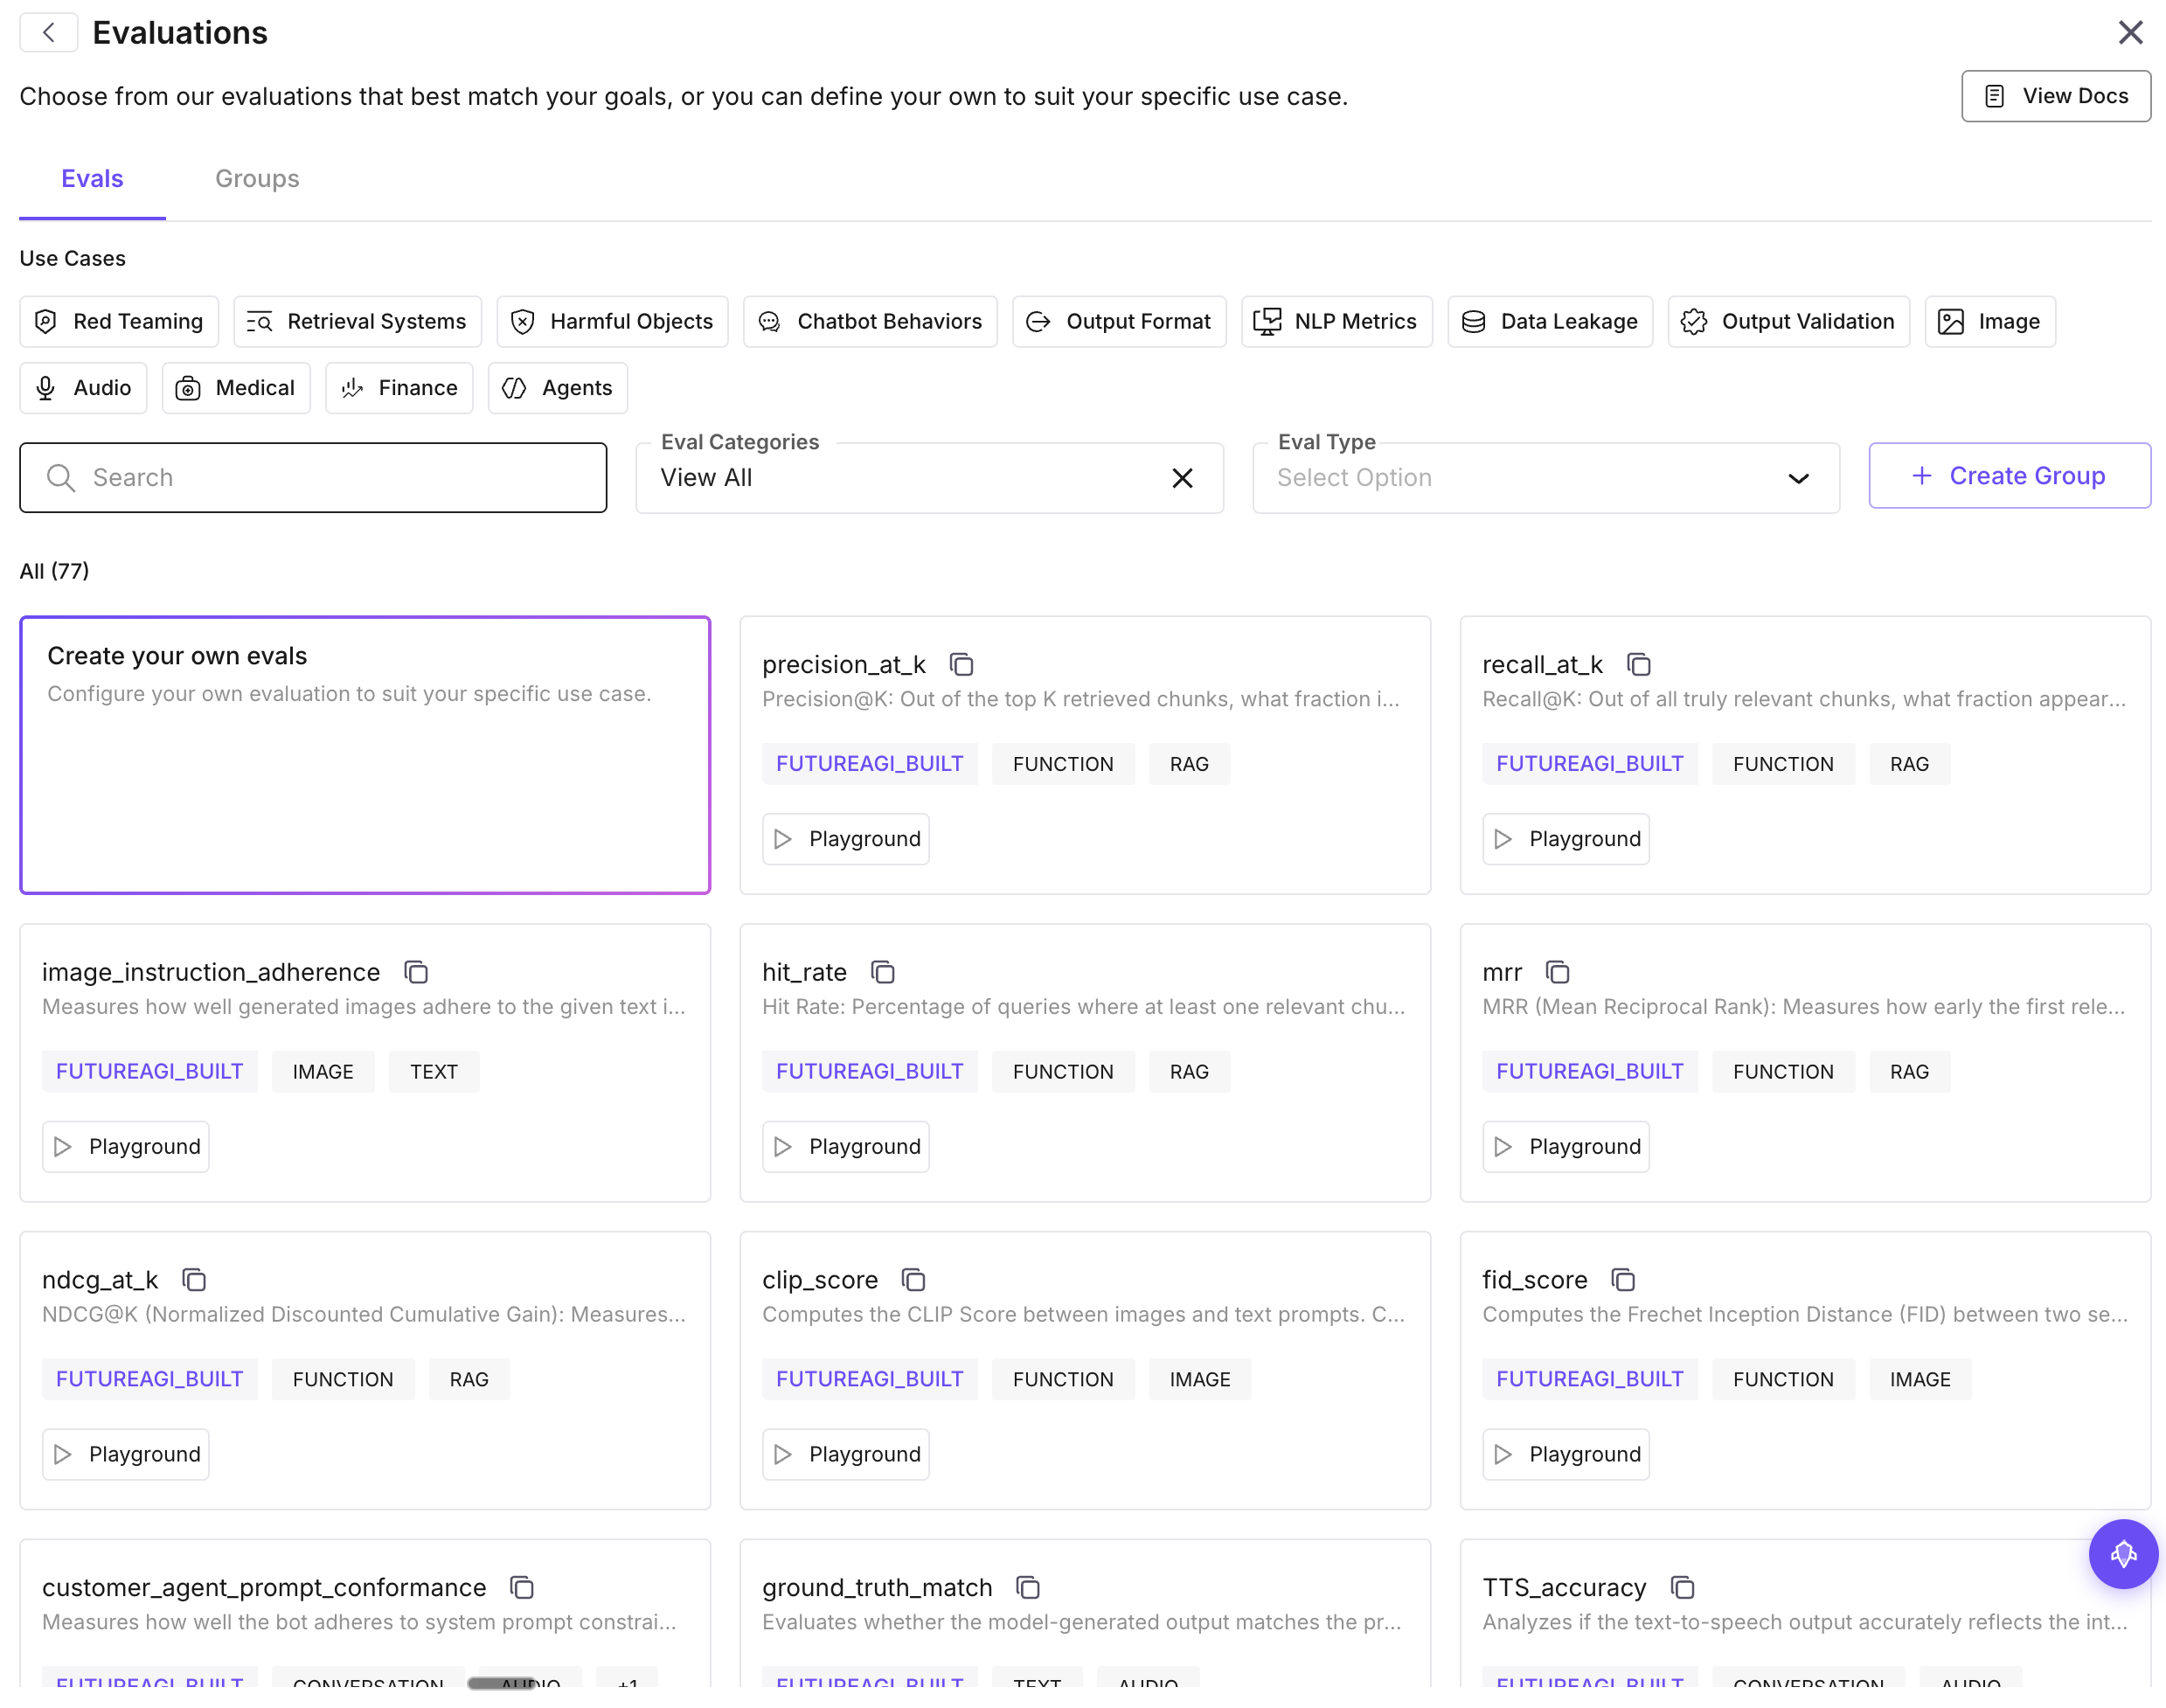
The Evals Playground eliminates that overhead entirely. It is an interactive sandbox where you can test evaluations with sample inputs and see scores in real time. Paste a prompt-response pair, select your evaluation criteria, choose a judge model, and get instant feedback on how the eval scores that example.
The Playground supports all evaluation types: built-in metrics, custom LLM-as-judge evaluations, and composite scoring rules. You can toggle between different judge models to see how scoring varies, adjust your rubric criteria and re-score instantly, and save configurations that work well as reusable templates.
This is particularly valuable for teams building custom evaluations for the first time. Instead of guessing at rubric wording and discovering problems after a full eval run, you can refine your evaluation interactively until it scores the way you expect.
Inline Evaluations — Score Any Span on Demand
Sometimes you are investigating a specific trace and want to know how a particular response scores against your evaluation criteria. The new inline evaluations feature lets you do exactly that.
Click any span in a trace view, select “Evaluate,” and choose from your evaluation templates. The evaluation runs on that single span and displays the result inline — right next to the trace data. No need to export the data, create a dataset entry, or run a batch evaluation.
This is a game-changer for debugging. When you find a suspicious response in your traces, you can immediately quantify how it scores on factual accuracy, relevance, safety, or any custom metric. It transforms the trace view from a passive observation tool into an active analysis environment.
Custom Model Endpoints
Not every team uses the default OpenAI or Anthropic models for evaluation judging. The new custom model dropdown lets you configure any model endpoint as your evaluation judge:
- Azure OpenAI deployments with your own API keys and endpoints
- Custom API endpoints that follow the OpenAI-compatible chat completions format
- Self-hosted models running on your own infrastructure
This is critical for teams with data residency requirements, custom fine-tuned judge models, or cost constraints that make specific model deployments more practical.
Experiment Page Redesign
The experiment view received a substantial rebuild. The new layout puts comparison front and center with side-by-side result panels, sortable metric columns, and a run history timeline that lets you navigate between experiment iterations.
Metric sorting lets you quickly find the best and worst performing configurations. Click any metric column header to sort, and the rows reorder to surface the top performers. Combined with the diff view shipped in a previous release, you get a complete picture of how each experiment run compares.
Monitoring and SDK Updates
Sentry integration connects your application error monitoring to your agent traces. When Sentry captures an exception, the corresponding trace is linked automatically, giving you full-stack debugging context from application error to agent execution path.
Attribute filters in Observe let you filter traces by custom attributes and metadata. Tag your traces with environment, user segment, feature flag, or any custom property, and filter on those dimensions in the Observe view.
Provider logos add visual clarity to trace views. Each span now displays the logo of the LLM provider it called — OpenAI, Anthropic, Google, Cohere, and others — making it easy to identify the model behind each step at a glance.
On the SDK side, Google ADK support brings automatic instrumentation to Google’s Agent Development Kit, and the TypeScript SDK gained expanded evaluation capabilities with new metric types and batch submission support.