How to Instrument an AI Agent in Minutes with TraceAI in 2026: Apache 2.0 OpenTelemetry-Native Observability
Instrument AI agents with TraceAI in 2026: OpenTelemetry-native Apache 2.0 spans, 20+ framework instrumentors, FITracer decorators, and 5-minute setup.

Table of Contents
A senior engineer stares at a 12-step LangChain agent that returned a wrong answer 11 minutes ago. The prompt looks fine. The retriever returned plausible documents. The tool call output is in range. Somewhere across those 12 steps the agent picked the wrong branch and there is no trace to look at. Three hours later, the team adds TraceAI’s LangChain auto-instrumentor, replays the failing query, and sees the exact tool call where context drifted. The fix is a 2-line prompt change. The lesson is that without tracing you debug by guess; with tracing you debug by reading. This post is the 2026 guide to instrumenting AI agents with TraceAI in minutes.
TL;DR: TraceAI in 2026
| Question | Answer |
|---|---|
| What is it? | Apache 2.0 OpenTelemetry-native tracing layer for LLMs, agents, and AI frameworks. |
| Setup time | 5 minutes for auto-instrumentation; 15 to 20 minutes including manual FITracer decoration. |
| Frameworks | 20+ integrations: OpenAI, Anthropic, Bedrock, Vertex AI, LangChain, LlamaIndex, CrewAI, AutoGen, DSPy, Guardrails, Haystack, Vercel AI SDK, more. |
| License | Apache 2.0. Source at github.com/future-agi/traceAI. |
| Backends | Any OTel-compatible backend: Jaeger, Datadog, Grafana, Honeycomb, Tempo, Future AGI Observe. |
| Span kinds | CHAIN, LLM, TOOL, RETRIEVER, EMBEDDING, AGENT, RERANKER, GUARDRAIL, EVALUATOR. |
| Auth | FI_API_KEY + FI_SECRET_KEY (never FAGI_API_KEY). |
If you only read one row: TraceAI is the integrated open-source path to OpenTelemetry-native AI agent tracing in 2026. Five minutes of setup, 20+ framework instrumentors, and Apache 2.0 so you can self-host or send spans to any OTel backend.
Why instrumentation is the bottleneck for AI agent debugging
AI agents in 2026 chain 5 to 50 model calls, tool invocations, retrieval steps, and guardrail checks per request. Traditional logs give you the inputs and outputs at the boundary; they do not give you the per-step decision trail. Three failure modes are invisible without tracing.
- Wrong tool, right input. The agent picked a tool that does not match the user’s intent; the tool returned a plausible output that the agent ran with. Logs see the final answer; only a trace shows the bad tool selection.
- Retrieval drift. The retriever returned a near-duplicate that lacks the key fact. Logs see the answer; only a trace shows the document the agent grounded on.
- Reasoning path collapse. Intermediate model and tool decisions took an early wrong turn and the rest of the run rationalized it. Logs see the conclusion; only a trace shows the inflection step in the agent’s step history.
The 2026 rule is simple: trace every LLM call, every tool call, every retrieval, every guardrail check, as standard OpenTelemetry spans. Our guide to LLM app observability with OpenTelemetry covers the full setup. Then the debug loop becomes a query against the trace store, not a guessing game.
TraceAI Features at a Glance
- Standardized tracing. Every LLM call, tool invocation, retrieval, and guardrail check maps to a typed OpenTelemetry span.
- Framework-agnostic. 20+ instrumentors across OpenAI, Anthropic, Bedrock, Vertex AI, LangChain, LlamaIndex, CrewAI, AutoGen, DSPy, Guardrails, Haystack, Vercel AI SDK, more.
- OpenTelemetry-native. Standard OTLP HTTP/gRPC exporters, standard span model, standard semantic conventions.
- Apache 2.0. Source at github.com/future-agi/traceAI with the LICENSE.
- Future AGI Observe ready. Spans render natively in the Future AGI dashboard, with trace-to-eval linkage to
fi.evals.
Supported Frameworks
| Framework | Package | What it traces |
|---|---|---|
| OpenAI | traceAI-openai | Chat completions, completions, image, audio APIs |
| Anthropic | traceAI-anthropic | Messages, tool use, streaming |
| AWS Bedrock | traceAI-bedrock | Bedrock invoke and converse APIs |
| Vertex AI | traceAI-vertexai | Vertex generative model calls |
| Google Generative AI | traceAI-google-genai | Gemini API calls |
| Mistral | traceAI-mistral | Chat and embedding calls |
| Groq | traceAI-groq | Groq chat calls |
| LiteLLM | traceAI-litellm | LiteLLM proxy calls |
| Together | traceAI-together | Together AI inference |
| LangChain | traceAI-langchain | Chains, tools, retrievers, runnables |
| LlamaIndex | traceAI-llama-index | Query engines, retrievers, agents |
| CrewAI | traceAI-crewai | Multi-actor crew runs |
| AutoGen | traceAI-autogen | Multi-agent conversations |
| DSPy | traceAI-dspy | Declarative pipeline steps |
| Guardrails | traceAI-guardrails | Guardrail validations |
| Haystack | traceAI-haystack | Pipelines, components |
| Vercel AI SDK | @traceai/vercel-ai-sdk (TS) | AI SDK calls in TypeScript |
| Mastra | @traceai/mastra (TS) | Mastra agent runs |
| SmolAgents | traceAI-smolagents | Lightweight agent loops |
| MCP | traceAI-mcp | Model Context Protocol calls |
| BeeAI | traceAI-beeai | BeeAI agent runs |
TraceAI integrations are packaged separately; check PyPI for the matching traceAI-* package or npm for the @traceai/* package that maps to your framework. The traceAI GitHub README holds the current compatibility matrix.
Quickstart: instrument an AI agent in five steps
Step 1: Install the TraceAI package for your framework
pip install traceAI-openaiSwap traceAI-openai for traceAI-langchain, traceAI-crewai, or whichever framework you use.
Step 2: Set environment variables
import os

os.environ["FI_API_KEY"] = "<YOUR_FI_API_KEY>"
os.environ["FI_SECRET_KEY"] = "<YOUR_FI_SECRET_KEY>"
os.environ["OPENAI_API_KEY"] = "<YOUR_OPENAI_API_KEY>"
Use FI_API_KEY and FI_SECRET_KEY (never FAGI_API_KEY). Pull both from the Future AGI dashboard after sign-in.
Step 3: Register the tracer provider
from fi_instrumentation import register
from fi_instrumentation.fi_types import ProjectType

trace_provider = register(
    project_type=ProjectType.OBSERVE,
    project_name="openai_app",
)
register connects your app to Future AGI’s observability pipeline. To send spans to a different OTel backend, configure additional span processors with the standard OTel SDK.
Step 4: Instrument your framework
from traceai_openai import OpenAIInstrumentor

OpenAIInstrumentor().instrument(tracer_provider=trace_provider)
After this call, every OpenAI request emits an OpenTelemetry span tagged with kind LLM and attributes for model name, prompt, response, token counts, and latency. Cost is typically derived downstream from the model name and token counts on the backend rather than written directly to the span.
Step 5: Interact with your framework normally
from openai import OpenAI

client = OpenAI()  # picks up OPENAI_API_KEY from env

response = client.chat.completions.create(
    model="gpt-5",
    messages=[
        {"role": "system", "content": "You are a helpful assistant."},
        {"role": "user", "content": "Tell me a quick AI joke."},
    ],
)

print(response.choices[0].message.content.strip())
The example uses the current OpenAI Python SDK (1.x). If your project still pins the legacy 0.x client, use openai.ChatCompletion.create instead and pin openai<1.0.
Every run appears as a trace with spans representing the prompt, the LLM call, and the response. Open the Future AGI dashboard to view, or query your OTel backend directly.
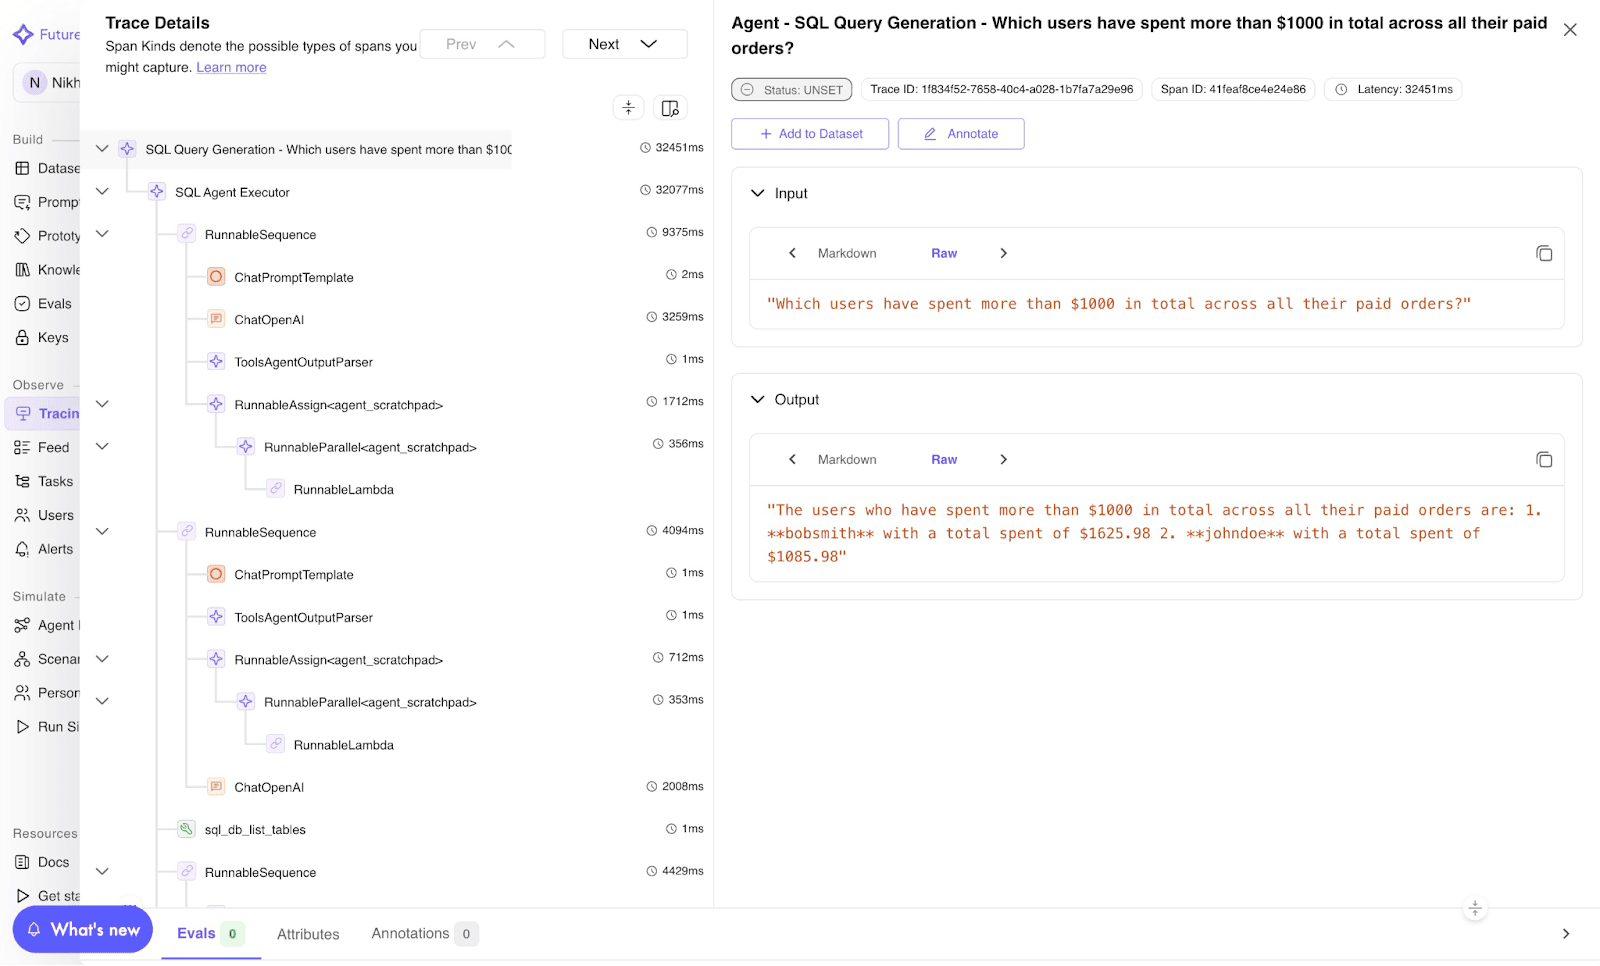
Image 1: TraceAI trace visualization dashboard.
Manual instrumentation with FITracer for fine-grained control
Auto-instrumentation covers framework SDK calls. For your own functions, chains, and tools, use FITracer’s lightweight decorators and context managers.
Setup
from fi_instrumentation import register, FITracer
from fi_instrumentation.fi_types import ProjectType

trace_provider = register(
    project_type=ProjectType.OBSERVE,
    project_name="FUTURE_AGI",
    project_version_name="openai-prod",
)

tracer = FITracer(trace_provider.get_tracer(__name__))
Function decoration with @tracer.chain
@tracer.chain
def my_func(input: str) -> str:
return "output"- Captures input and output automatically.
- Auto-assigns span status.
- Use for whole functions or chain steps.
Manual span control with context managers
from opentelemetry.trace.status import Status, StatusCode

with tracer.start_as_current_span(
    "my-span-name",
    fi_span_kind="chain",
) as span:
    span.set_input("input")
    span.set_output("output")
    span.set_status(Status(StatusCode.OK))
Use context managers when you need precise control over span attributes, inputs, outputs, and status.
Span kinds
TraceAI defines a small set of semantic span kinds.
| Span kind | When to use |
|---|---|
| CHAIN | General logic or function |
| LLM | Model calls |
| TOOL | Tool usage |
| RETRIEVER | Document retrieval |
| EMBEDDING | Embedding generation |
| AGENT | Agent invocation |
| RERANKER | Context reranking |
| GUARDRAIL | Compliance checks |
| EVALUATOR | Evaluation span |
The right span kind makes traces semantically rich and queryable: “show me every RETRIEVER span where the agent fell back to a default response” is a one-line filter in the Future AGI dashboard or any OTel backend that respects the semantic conventions.
Agent decoration with @tracer.agent
@tracer.agent
def run_agent(input: str) -> str:
    return "processed output"

run_agent("input data")
Tool decoration with @tracer.tool
@tracer.tool(
    name="text-cleaner",
    description="Cleans raw text for downstream tasks",
    parameters={"input": "dirty text"},
)
def clean_text(input: str) -> str:
    return input.strip()

clean_text("  hello world  ")
Every decorated call generates a span with input data, tool metadata, and execution status. All visible in the Future AGI trace view or any OTel backend.
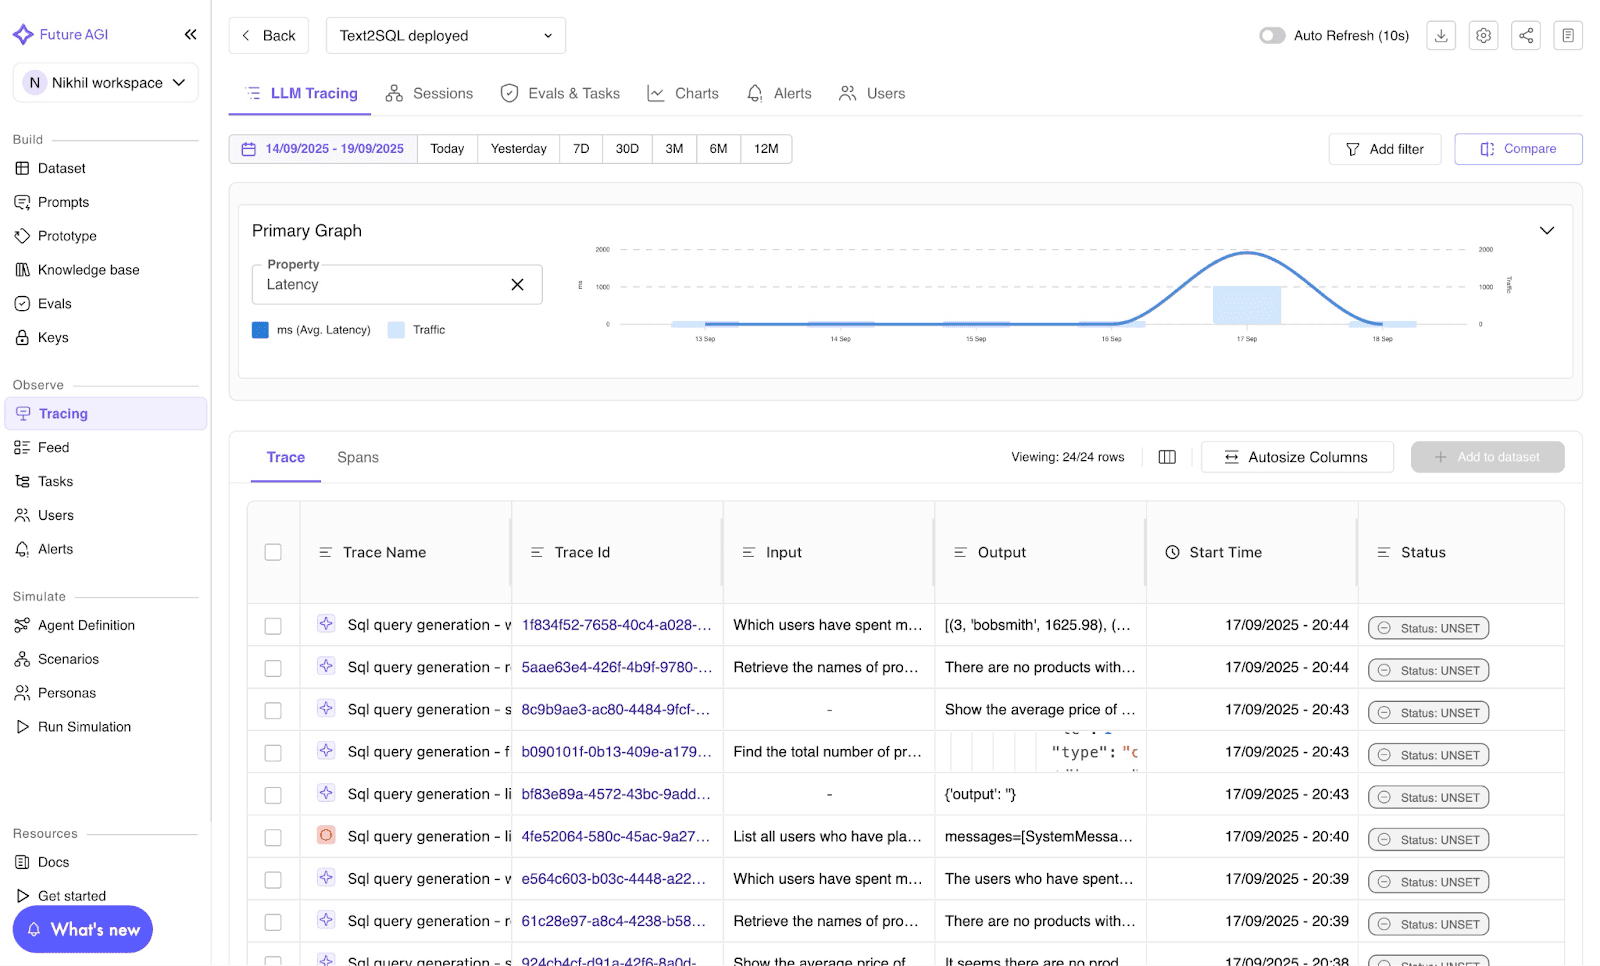
Image 2: Future AGI LLM tracing dashboard.
Connect TraceAI to any OTel backend
TraceAI uses standard OTLP exporters. Configure additional span processors at register time to send to Jaeger, Datadog, Grafana, Honeycomb, or Tempo alongside Future AGI Observe.
The point is that TraceAI is not a closed observability vendor. The library emits standard spans; the backend is your choice. Future AGI Observe is the integrated pick because it ties spans to fi.evals scoring (trace-to-eval linkage), but you can pick any OTel backend you already run.
Trace-to-eval linkage: score spans without re-running the agent
The 2026 default pattern is to score the same spans that emit prompts and completions against fi.evals rubric templates, the core idea behind LLM evaluation. The trace becomes the ground truth for scoring.
from fi.evals import evaluate

# Score the prompt/response captured on a span.
result = evaluate(
    "faithfulness",
    output=span_response_text,
    context=span_retrieved_docs,
)
faithfulness_score = result.score
Pair this with manual @tracer.chain decoration on your scoring function so the eval itself emits an EVALUATOR span. The full agent run is now a queryable, scoreable, gateable trace.
Best practices for TraceAI in 2026
- Use auto-instrumentation as the default; reach for FITracer manual decoration only for your own logic.
- Name spans meaningfully (e.g.,
retriever-step,policy-check-1, notfn1). - Pair TraceAI tracing with
fi.evalsscoring inside the same span context for trace-to-eval linkage. - Use environment-based
project_version_nameto separate dev, staging, and prod traces. - Add TraceAI early; retro-instrumentation is harder once the agent is in production.
- Apply redaction utilities to inputs and outputs before they are set on spans if you handle user PII.
Troubleshooting TraceAI
- Missing spans? Verify
trace_providerregistration and that the framework instrumentor’sinstrument()call ran before the framework’s first call. - OTel backend not visible? Ensure your collector endpoint is running and reachable from the agent host.
- Sensitive data exposure? Use the redaction utilities in
fi_instrumentationbefore callingspan.set_inputorspan.set_output. - Spans tagged wrong kind? Set
fi_span_kindexplicitly on manual spans; for auto-instrumented spans, file an issue on github.com/future-agi/traceAI with a minimal reproducer.
Contributing to TraceAI
TraceAI is open-source and community-driven.
git clone https://github.com/future-agi/traceAI
cd traceAI
git checkout -b feature/your-feature
Submit a PR with tests. Join the Future AGI community on LinkedIn, Twitter, or Reddit.
Closing: tracing first, eval next, optimization third
Observability is no longer a hurdle in 2026. The best AI systems do not just generate answers; they explain how they got there. TraceAI makes that explanation visible, measurable, and improvable, then ties the spans to fi.evals for scoring and to Prompt Optimize for the next iteration.
Start at github.com/future-agi/traceAI, pick the instrumentor for your framework, and ship one production trace this week. Sign-up at app.futureagi.com is free and unlocks the dashboard + fi.evals trace-to-eval linkage.
Frequently asked questions
What is TraceAI in 2026?
How is TraceAI different from regular OpenTelemetry?
Which frameworks does TraceAI support out of the box in 2026?
How long does TraceAI setup take?
Can I send TraceAI spans to backends other than Future AGI?
Is TraceAI open source and can I self-host?
How does TraceAI handle sensitive data and PII?
What is the difference between TraceAI auto-instrumentation and manual FITracer decoration?

Gemini 3.5 Flash dropped today at Google I/O 2026. The 8 benchmark numbers that matter, $1.50/$9 pricing breakdown, and what to instrument before you swap.

Agentic RAG in 2026: tool-using agents over vector DBs, query rewriting, multi-hop retrieval, and how to trace and evaluate every retrieve span with FAGI.
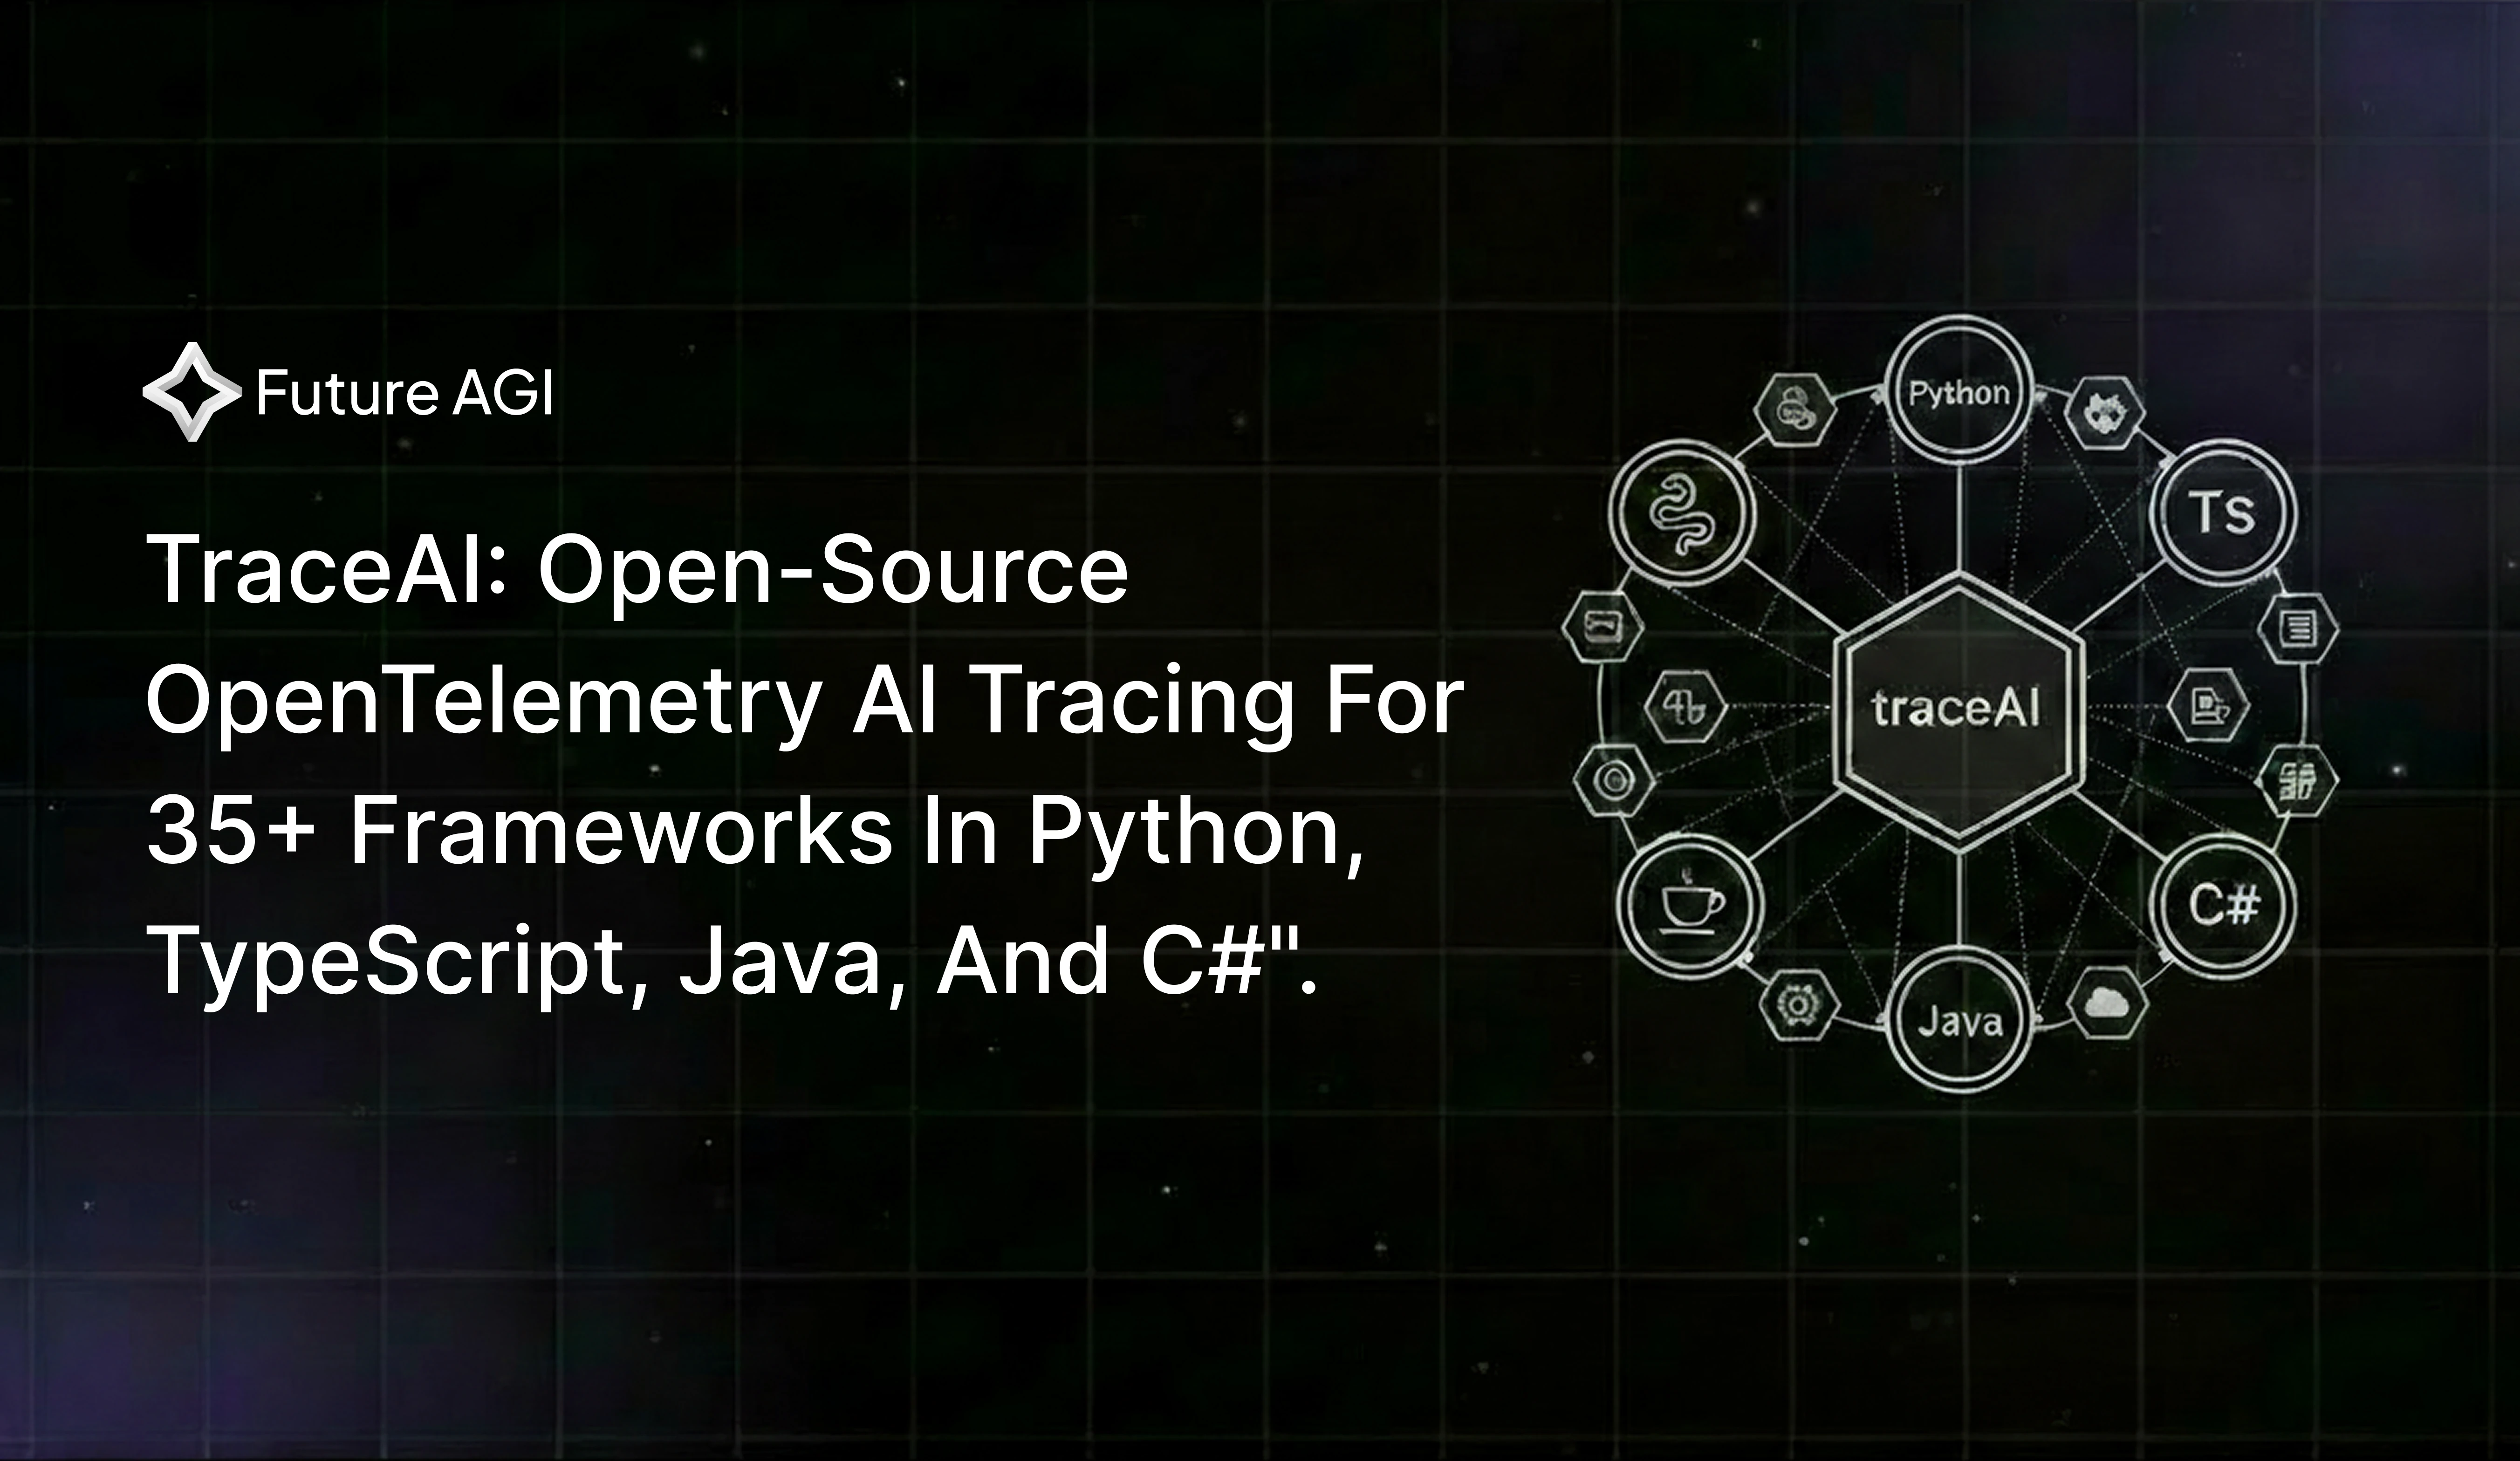
Open-source Apache 2.0 OpenTelemetry tracing for LLM apps: 50+ AI surfaces across Python, TypeScript, Java, C#. Two lines, zero lock-in.