Voice AI Load Testing: Simulating 10,000+ Concurrent Calls in 2026
Load test voice AI at 10,000+ concurrent calls in 2026: spawn parallel personas, score under load, find latency degradation and eval drift before ship.
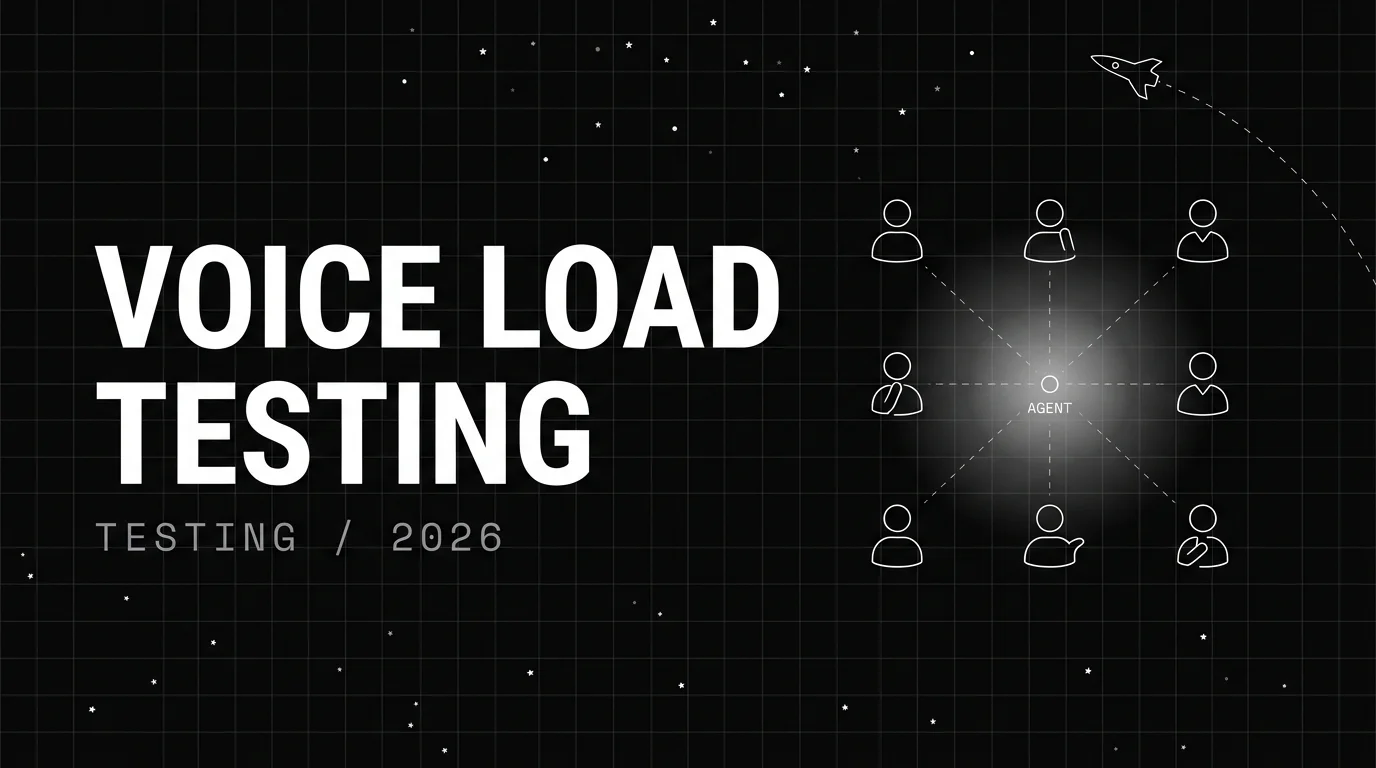
Table of Contents
The first time most voice agents melt down is the first time they handle thousands of calls in an hour. The pre-launch test ran fine at 100 calls. The canary cohort behaved well. Then peak traffic hits, latency P95 doubles, the eval pass rate drops eight points, and the on-call engineer spends the weekend reading transcripts. Voice load testing is the discipline of finding those failures before production finds them. This guide walks the 2026 engineering pattern: spawn 10,000+ synthetic personas, score every turn, and surface the scale-only failure modes before the canary does.
TL;DR: the voice load-test loop
- Define the Agent Definition for the agent under test. Same definition used for pre-launch simulation.
- Build the persona matrix from the 18 pre-built personas plus custom personas representative of production traffic.
- Generate the scenario graph via Workflow Builder Auto-Generate. Specify row count: 10,000+ for a full load test.
- Configure the Run Tests wizard: set concurrency to peak target (1,000+ parallel calls), attach the evaluator package.
- Execute the test and monitor in real time. Latency, eval scores, error clusters all stream as the test runs.
- Triage with Error Localization plus the Error Feed cluster surface. Each scale-only failure becomes a named issue with a root cause.
- Fix and re-run via the programmatic eval API.
The point isn’t running the test once. The point is running it before every release candidate. Load tests that ship into CI catch the failures before they ship to users.
The load-test problem with real phone calls
Three reasons real phone calls don’t scale for QA.
Cost. Telephony providers charge per minute, per concurrent channel, and per number rented. A 10,000-concurrent-call test on a typical telephony provider runs $80-200 in raw telephony costs alone. Run that test on every release candidate and the QA telephony bill exceeds the production telephony bill.
Reproducibility. Real callers can’t be controlled. The audio profile varies (codec, microphone, room noise). The network varies (regional latency, packet loss, jitter). The caller varies (they say different things, get tired, hang up early). Reproducing a failure requires the same caller in the same conditions, which isn’t possible.
Ground truth. A real call doesn’t carry a label. You can’t score whether the call succeeded without listening to the recording or labeling the transcript. At 10,000 calls that’s 5,000+ engineer-hours of labeling. Most teams don’t do it. Most teams therefore don’t know whether their voice agent works under load.
Simulated calls solve all three. The cost is the eval cost, not telephony. The simulator is deterministic. The persona’s intent and expected outcome are known up front, so success is scored automatically.
What “load test” means in voice AI
Voice load testing in 2026 has three dimensions, not one.
Dimension 1: latency under load
The agent’s per-stage latency at low concurrency versus peak concurrency. STT TTFT, LLM TTFT, TTS first-audio, tool call duration. The numbers should hold flat with the right capacity provisioning. They usually don’t, because the failure modes only show up at scale.
Dimension 2: quality under load
The eval rubric scores at low concurrency versus peak concurrency. Pass rate on conversation_resolution, task_completion, is_polite. The numbers should hold flat if the agent’s behavior is stable. They drop when timeouts trigger fallbacks, when caching breaks, when tool calls fail and cascade into partial responses.
Dimension 3: error rate under load
The fraction of calls that error out, time out, or produce no response. At low load this rate is microscopic (0.05%). At peak load it climbs. The Error Feed cluster surface shows where the errors come from: provider rate limits, gateway timeouts, downstream tool failures.
A passing load test holds all three dimensions stable from 100 concurrent to 10,000+ concurrent. A failing load test shows divergence in one or more dimensions. The divergence is the signal.
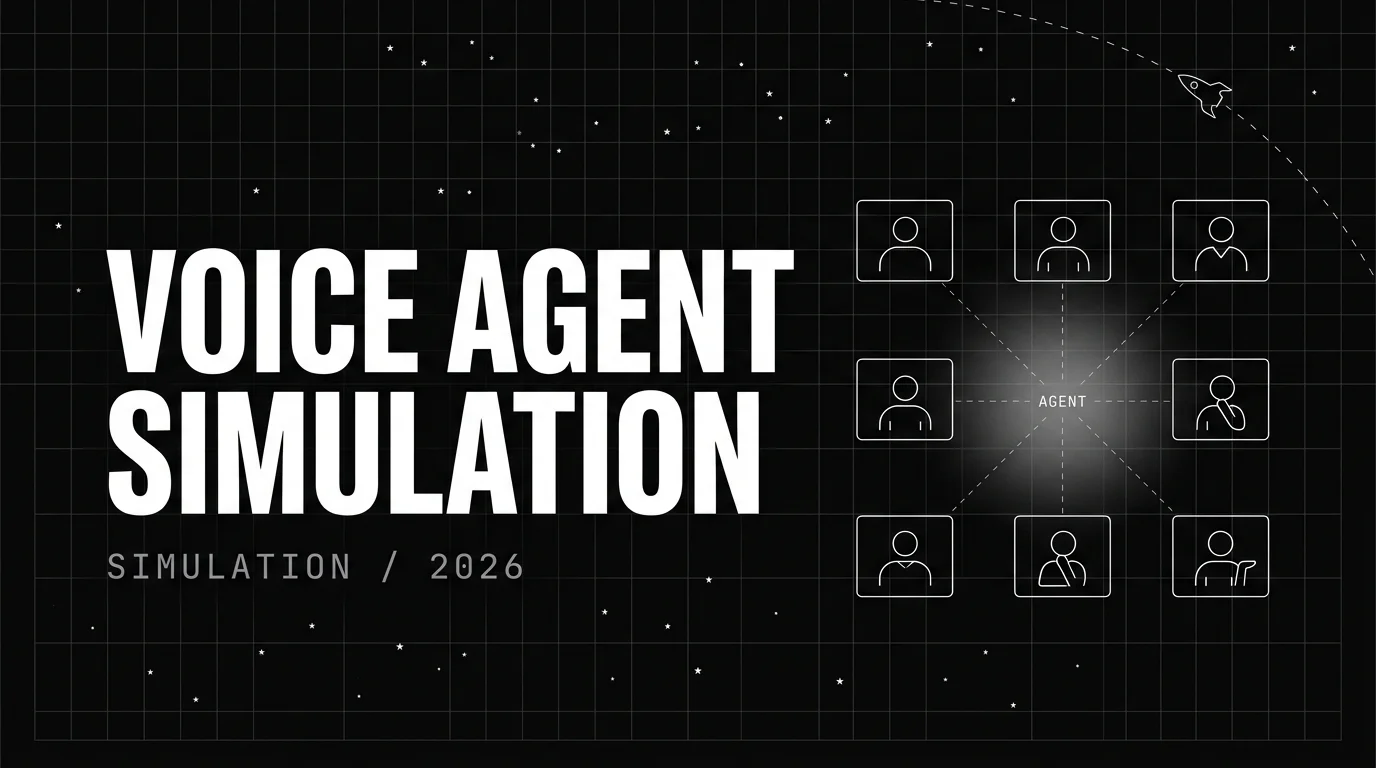
Spawning 10,000 parallel personas
The Simulate product’s scenario generation surface supports documented auto-generation row counts of 20, 50, and 100; programmatic eval automation re-executes those generated scenarios across larger concurrency targets.
The mechanics:
- Agent Definition. Same as pre-launch. Name, behavior, capabilities, constraints. The Agent Definition is reused across all test runs.
- Persona matrix. Pick from the 18 pre-built personas (first-time caller, repeat caller, frustrated caller, elderly caller, distracted caller, polite escalator, information-gatherer, direct purchaser, etc.) plus any custom personas authored for your industry.
- Scenario generation. Auto-Generate Graph in Workflow Builder. Plain-text scenario description, persona matrix, row count. For a load test, set row count to 10,000+ depending on your peak concurrency target.
- Branch visibility check. The branch visualization (released November 2025) shows the distribution across conversation paths. Confirm coverage looks balanced before running.
- Run Tests wizard. Step 1: test config (name, concurrency, retry policy, recording). Step 2: scenario select. Step 3: eval config (rubric package). Step 4: review and execute.
Each row spawns an independent simulator. The simulator places a synthetic audio call into your voice agent’s phone number (via the Enable Others mode for any agent reachable by phone) or directly to your agent’s API endpoint (for natively-integrated Vapi, Retell, and LiveKit agents). Concurrency is configurable per test run: 100, 1,000, 10,000+ parallel simulators.
The eval engine scores each turn and each conversation against the rubric package. Results stream live to the dashboard as the test executes.
Concurrency: the configurable ceiling
The concurrency setting in the Run Tests wizard caps how many simulators run in parallel. Three considerations.
Your agent’s capacity. If your voice agent has a stated capacity of 500 concurrent calls in production, running a 5,000-concurrent load test will saturate it. That’s the point. The test surfaces the saturation behavior.
Your provider’s rate limits. STT, LLM, TTS providers all have rate limits. Some are per-second, some per-minute, some per-concurrent. A load test at 10,000 concurrent may hit the LLM provider’s per-second rate limit before hitting your agent’s capacity ceiling. The rate-limit behavior (retries, fallbacks, errors) is part of what the load test measures.
Your own telemetry capacity. traceAI ingest, eval API throughput, dashboard rendering all have ceilings. At very high concurrency the observability stack itself can become the bottleneck. Most teams haven’t hit this; the typical bottleneck is upstream providers.
A common pattern is a ramp-up: start at 100 concurrent for 5 minutes, ramp to 1,000 over the next 10 minutes, ramp to 10,000+ over the next 20. The ramp surfaces capacity ceilings as they hit instead of all at once.
What you find at scale
The failures that show up only at scale fall into five clusters.
Cluster 1: provider capacity ceilings
The most common scale-only failure. Your STT provider’s regional capacity hits its ceiling and first-partial latency jumps from 120ms P50 to 350ms P50. The agent’s pipeline budget breaks. Users perceive the agent as slow.
The fix is usually one of: provider capacity reservation, multi-provider failover, or regional fanout. The load test surfaces which provider is the constraint.
Cluster 2: prompt cache invalidation
When concurrency is high, the LLM provider’s prompt cache hit rate drops. Each cache miss adds 200-400ms to TTFT. At 10,000 concurrent the cache hit rate can drop from 75% to 45% as the cache thrashes.
The fix is usually to reduce the system prompt size, partition the cache by tenant, or pre-warm the cache before peak load. The load test surfaces the cache miss rate as a span attribute.
Cluster 3: tool call cascade failures
A tool call that times out at low load (rare) becomes common at peak load (every 50th call). The agent’s fallback path engages. The fallback path produces a less helpful response. The eval pass rate drops.
The Error Feed clusters the tool failures into named issues. The fix is usually to increase tool timeouts, add a retry layer, or improve the fallback prompt.
Cluster 4: TTS WebSocket exhaustion
Streaming TTS uses WebSocket connections. At peak load the connection pool exhausts and new sessions fall back to non-streaming or queue behind closed connections. TTS first-audio latency spikes.
The fix is usually to grow the pool, add a second TTS provider for overflow, or batch-prewarm WebSockets at session start.
Cluster 5: stateful conversation drift
Long conversations build up state. At low load each conversation’s state is small (5-10 turns). At peak load, conversations stay open longer because users wait through latency, and state grows (15-25 turns). The longer state hits LLM context length limits or context-fading where early turns get dropped.
The eval drift here is real: pass rate on conversation_resolution drops because the agent forgets context the user mentioned 15 turns ago. The fix is usually to summarize older turns, cap conversation length, or use a context-management pattern.
A worked load test: customer support voice agent
A SaaS customer support voice agent, designed for 200 concurrent calls in production, with a peak hour at 400 concurrent. The team wants to load test at 4,000 concurrent (10x headroom) before a major release.
Step 1: Agent Definition. “Customer support voice agent for a B2B SaaS product. Handles account questions, billing questions, technical questions, and escalation to a human. Tool calls: get_account_info, get_billing_status, get_open_tickets, create_ticket, escalate_to_human.”
Step 2: Persona matrix. 4 custom personas (small-business admin, mid-market IT manager, enterprise security officer, technical end-user) + 6 pre-built personas (in-a-hurry, frustrated, polite escalator, information-gatherer, skeptical, complaint-caller).
Step 3: Scenario generation. Auto-Generate Graph. Description: “Customer calls support for account, billing, or technical issue. Agent qualifies the issue, looks up account context, attempts resolution, escalates if needed.” Row count: 10,000. Persona matrix: 10 personas above.
Auto-generator produces 14 conversation paths covering account types (account question, billing question, technical question, escalation request), resolution outcomes (resolved, ticket created, escalated), and persona-specific behavior. 10,000 rows distributed across the 14 paths.
Step 4: Run Tests wizard. Test config: concurrency 4,000, retry on transient failures, recording on for failures. Scenario select: all 14 paths. Eval config: 5-rubric package (conversation_resolution, task_completion, is_polite, is_helpful, is_concise). Review and execute.
Step 5: Execute. Ramp-up over 30 minutes from 100 concurrent to 4,000 concurrent. Hold at 4,000 for 60 minutes. Ramp-down over 15 minutes. Total wall-clock: about 2 hours. Total scenarios completed: roughly 30,000 (each scenario runs once per persona-situation pair).
Step 6: Findings.
Latency under load:
| Stage | P95 at 100 concurrent | P95 at 4,000 concurrent | Delta |
|---|---|---|---|
| STT TTFT | 130ms | 280ms | +150ms |
| LLM TTFT | 250ms | 410ms | +160ms |
| TTS first-audio | 110ms | 145ms | +35ms |
| Tool call | 180ms | 320ms | +140ms |
| User-perceived gap | 410ms | 760ms | +350ms |
Quality under load:
| Rubric | Pass rate at 100 | Pass rate at 4,000 | Delta |
|---|---|---|---|
| conversation_resolution | 88% | 79% | -9 |
| task_completion | 91% | 84% | -7 |
| is_polite | 96% | 94% | -2 |
| is_helpful | 89% | 82% | -7 |
| is_concise | 92% | 88% | -4 |
Error clusters (top 5 named issues from Error Feed):
- STT regional capacity ceiling (38% of failures). Deepgram us-east-1 hits its regional concurrency cap at 2,800+. STT TTFT spikes, pipeline budget breaks. Quick fix: add us-east-2 failover. Long-term: capacity reservation contract.
- LLM prompt cache miss spike (24% of failures). Cache hit rate drops from 78% at low load to 51% at peak. TTFT jumps. Quick fix: reduce system prompt by 600 tokens. Long-term: partition cache per tenant.
- Tool call timeout cascade (18% of failures).
get_open_ticketstimes out at peak. Agent falls back to “let me check that” without retrying. Quick fix: retry with 500ms backoff. Long-term: tool budget caps with explicit fallback prompts. - TTS WebSocket pool exhaustion (12% of failures). Cartesia connection pool maxed at 3,200. New calls queue behind closed connections. Quick fix: grow pool to 5,000. Long-term: add ElevenLabs as overflow provider.
- Long-conversation context fade (8% of failures). Conversations that go past 18 turns lose early context. Pass rate on
conversation_resolutiondrops sharply. Quick fix: turn-15 summarization step. Long-term: structured conversation state.
Step 7: Patch and re-run. Engineer ships the five quick-fixes over the next week. Re-run the same load test via the programmatic eval API:
from fi.evals import EvalAPI

api = EvalAPI(fi_api_key="...", fi_secret_key="...")

results = api.run_simulation(
    agent_definition_id="support_agent_v17",
    scenario_ids=["support_load_test_10k"],
    eval_templates=[
        "conversation_resolution",
        "task_completion",
        "is_polite",
        "is_helpful",
        "is_concise",
    ],
    concurrency=4000,
    ramp_up_minutes=30,
    hold_minutes=60,
    ramp_down_minutes=15,
)

print(f"Pass rate: {results.pass_rate:.2%}")
Re-test results: latency P95 at 4,000 concurrent drops from 760ms to 520ms. Pass rate on conversation_resolution lifts from 79% to 86%. The release gate (80% pass rate on conversation_resolution at peak load) clears.
The whole cycle takes about a week. Without the simulation surface the same engineering work would happen during canary rollout, with real user impact.
Latency degradation: what to plot
The latency-degradation curve is the most useful single visualization for a voice load test. Plot per-stage P95 against concurrency.
from fi_instrumentation import FITracer

tracer = FITracer(tracer_provider.get_tracer(__name__))

def record_stage_latency(stage, latency_ms, concurrency):
    with tracer.start_as_current_span(
        f"stage_latency_{stage}",
        attributes={
            "stage": stage,
            "latency_ms": latency_ms,
            "concurrency": concurrency,
        },
    ):
        pass
The dashboard slice that matters is SELECT stage, concurrency, P95(latency_ms) GROUP BY stage, concurrency. Plot as a multi-line chart with concurrency on the X axis and P95 on the Y axis, one line per stage.
The shape of the curve tells you the bottleneck:
- Flat curve. No bottleneck. The agent has headroom.
- Linear curve. Steady degradation. Capacity is keeping up but with growing queue depth.
- Knee curve. Flat until a threshold, then sharp climb. A capacity ceiling was hit.
- Cliff curve. Sharp climb at low concurrency. Something is misconfigured.
A knee curve at 2,800 concurrent on STT TTFT means the STT provider is the constraint at 2,800. A linear curve on LLM TTFT means the LLM is keeping up but the queue is growing. A cliff curve on tool calls means a tool dependency is misconfigured.
Eval drift: what to plot
The eval-drift curve is the second most useful visualization. Plot pass rate per rubric against concurrency.
def record_eval_at_concurrency(rubric, score, concurrency):
    with tracer.start_as_current_span(
        f"eval_{rubric}_at_concurrency",
        attributes={
            "rubric": rubric,
            "score": score,
            "concurrency": concurrency,
        },
    ):
        pass
The drift surfaces three patterns:
- No drift. Pass rate flat across concurrency. The agent behaves consistently under load.
- Soft drift. Pass rate drops 2-5 percentage points at peak. Usually caused by latency-induced timeout fallbacks.
- Hard drift. Pass rate drops 10+ percentage points at peak. Something fundamental breaks at scale.
Hard drift on conversation_resolution means conversations are unfinished at peak. Hard drift on task_completion means tools are failing. Hard drift on is_polite means the fallback prompts are abrupt.
Each drift pattern has a known fix. Error Localization pinpoints which turn drops the score, and Error Feed clusters the patterns into named issues.
Error clusters: what shows up at scale
Beyond the latency and quality curves, the cluster surface in Error Feed produces the named failure modes. At scale, these tend to dominate:
- Provider rate-limit errors. STT, LLM, or TTS 429 responses. The provider response strategy (retry, fallback, error) determines what users see.
- Gateway timeouts. The voice gateway times out on slow upstream responses. Affects mostly long-tail latency outliers.
- Tool call failures. Downstream services fail at higher rates under their own load. Cascades into agent response quality.
- WebSocket churn. Streaming connections drop and reconnect. Each reconnection adds 100-300ms of latency.
- DNS resolution storms. Each new call resolves DNS. At very high call rates, DNS cache TTL becomes a factor.
The Error Feed cluster surface auto-clusters each pattern into a named issue with auto-written root cause, quick fix, and long-term recommendation. The output replaces the manual incident triage cycle.
CI integration: load test as a gate
The programmatic eval API turns the load test into a release gate. Common patterns:
Per-release-candidate load test. Run the full 10,000+ concurrent test on every release candidate. Pass rate threshold: 80% on conversation_resolution at peak concurrency. Latency P95 threshold: under 800ms user-perceived gap at peak. Total wall-clock: 2 hours. Blocks release if below threshold.
Weekly drift load test. Run a 1,000-concurrent test against the rolling 7-day baseline. Surface any rubric regression above 3 percentage points. Surface any latency P95 regression above 50ms. Investigate any drift before it becomes the production incident.
Provider switch test. Before switching STT, LLM, or TTS providers, run the load test on both the current and the proposed configuration. Compare latency, eval pass rate, and error rate. Pick the winner on data, not on the vendor pitch.
Each pattern is a few lines of API code plus a CI workflow. The cost is the eval API cost; the savings are the production incidents that don’t happen.
Cost economics of voice load testing
Real-call load testing at 10,000 concurrent costs $80-200 per run plus the telephony number rental, plus any per-minute or per-call markup. Run it on every release candidate and the bill exceeds $10K per month.
Simulated load testing at 10,000 concurrent costs the eval API charges for the rubric scoring across the call volume, plus the underlying LLM and TTS costs for the agent under test (which you pay anyway in production). The marginal QA cost is the eval rubric cost.
For a typical 5-rubric package on 30,000 scored conversations, the eval cost is on the order of $50-200 per run depending on which rubrics are LLM-as-judge versus in-house classifier. Running the same test weekly is $200-800/month. The cost is small relative to the production incidents the testing prevents.
ai-evaluation tunes the in-house classifier family for the LLM-as-judge cost/latency tradeoff. The classifier family scores at a fraction of the LLM-as-judge cost so high-volume eval stays affordable.
Future AGI on voice load testing
Simulate is the surface. 18 pre-built personas plus unlimited custom-persona authoring with controls for gender, age, location, accent, communication style, background noise, and multilingual. Workflow Builder auto-generates branching scenarios at documented row counts of 20, 50, or 100, and programmatic eval automation re-executes those scenarios across higher concurrency targets. The 4-step Run Tests wizard scales without process change. Error Localization pinpoints the failing turn. Programmatic eval API for CI integration. Enable Others mode supports any voice provider via real-telephony simulation. Indian phone number support added November 2025. Custom voices from ElevenLabs and Cartesia for highest-fidelity simulation.
traceAI captures per-stage latency (STT TTFT, LLM TTFT, TTS first-audio, tool call duration) as OpenInference span attributes on every simulated call. 30+ documented integrations across Python and TypeScript, including dedicated traceAI-pipecat and traceai-livekit packages. Apache 2.0.
ai-evaluation ships 70+ built-in eval templates including conversation_resolution, task_completion, is_polite, is_helpful, is_concise, audio_transcription, and audio_quality. The MLLMAudio test case handles seven audio formats. Custom evaluators authored by an in-product agent. Per-route eval gating so async eval never blocks the critical voice path. Programmatic eval API for configure plus re-run. Apache 2.0.
Future AGI Protect runs sub-100ms inline on Gemma 3n with LoRA-trained adapters per arXiv 2510.13351. Multi-modal across text, image, and audio. ProtectFlash for single-call binary classification. Inline guardrails scan every simulated turn the same way they scan production traffic.
Error Feed auto-clusters load-test failures into named issues with auto-written root cause, quick fix, and long-term recommendation. Provider capacity ceilings, cache miss spikes, tool timeout cascades, WebSocket pool exhaustion, long-conversation context fade each become their own named cluster.
Agent Command Center hosts the stack with RBAC, SOC 2 Type II, HIPAA, GDPR, CCPA, and ISO 27001 certified per the trust page. AWS Marketplace, multi-region hosted, BYOC for regulated workloads.
The whole load-test surface is one product flow: define agent, generate scenarios, run tests, triage failures, fix, re-run. Each step is dashboard-first plus API-callable. The cycle that used to take six weeks with real-call load testing runs in days with simulation.
Where simulation hands off to production
Telephony codec fidelity routes through the right path. Synthetic personas placing calls via real telephony (Enable Others mode) hit real codecs. Synthetic calls into a Vapi/Retell/LiveKit API endpoint use the provider’s standard audio path, which differs from real-world phone codec degradation. Codec-sensitive testing (PSTN audio quality, regional carrier behavior) runs via Enable Others mode plus the Indian phone number region; everything else uses the API endpoint and runs cheaper at scale.
Network condition coverage routes to production observability. Simulation focuses on agent-processing latency; real-world network jitter, packet loss, and mobile-network latency get measured by production observability via traceAI. The native voice observability for Vapi, Retell, and LiveKit captures the production-side latency distribution that simulation deliberately abstracts away. The two surfaces complement each other.
Persona realism scales with the LLM driver, then loops back into simulation. Synthetic personas are LLM-driven and behave reasonably but they’re not real users. Uniquely human edge cases (a caller who hangs up at exactly the wrong moment, a caller who answers an unrelated question with their grocery list) surface in production observability via traceAI; the Error Feed clusters those failures into named issues and feeds them back into the simulation library as candidate scenarios. The library grows with usage.
Related reading
- Voice Agent Simulation: A 2026 Engineering Guide
- Voice AI Barge-In and Turn-Taking: A 2026 Implementation Guide
- Sub-500ms Voice AI: The Complete Latency Budget Guide for 2026
- How to Implement Voice AI Observability in 2026
Sources and references
- Future AGI Protect: arXiv 2510.13351
- OpenInference span specification: github.com/Arize-ai/openinference
- Future AGI trust and compliance: futureagi.com/trust
- Future AGI Simulate documentation: docs.futureagi.com/docs/simulate
- ai-evaluation repository: github.com/future-agi/ai-evaluation
- traceAI repository: github.com/future-agi/traceAI
- Deepgram regional capacity documentation: deepgram.com vendor docs
- OpenAI prompt caching documentation: platform.openai.com/docs
Frequently asked questions
Why can't I load-test voice AI with real phone calls?
How does the load-test simulation actually work?
What infrastructure does FAGI use to scale to 10,000 concurrent simulators?
What do you actually find at 10,000 concurrent calls that you don't find at 100?
How do you find latency degradation under load?
How do you find eval drift under load?
How does Future AGI score success at 10,000-call scale?
Engineer voice agent simulation: 18 personas, auto-generated branching scenarios, four-step test wizard, Error Localization, programmatic eval API.

The 2026 voice testing pattern: regression on golden conversations, adversarial red-team personas, production-derived replays. Engineering build guide.

Future AGI vs Coval on simulation, native voice observability, eval, inline guardrails, optimization, pricing, compliance. Honest verdict, May 2026.
