OTel Collector Setup for LLM Traces With Sampling and Redaction
Set up an OTel collector for LLM traces: tail sampling that keeps failed and flagged runs, prompt and output redaction, batching, and two OTLP backends.
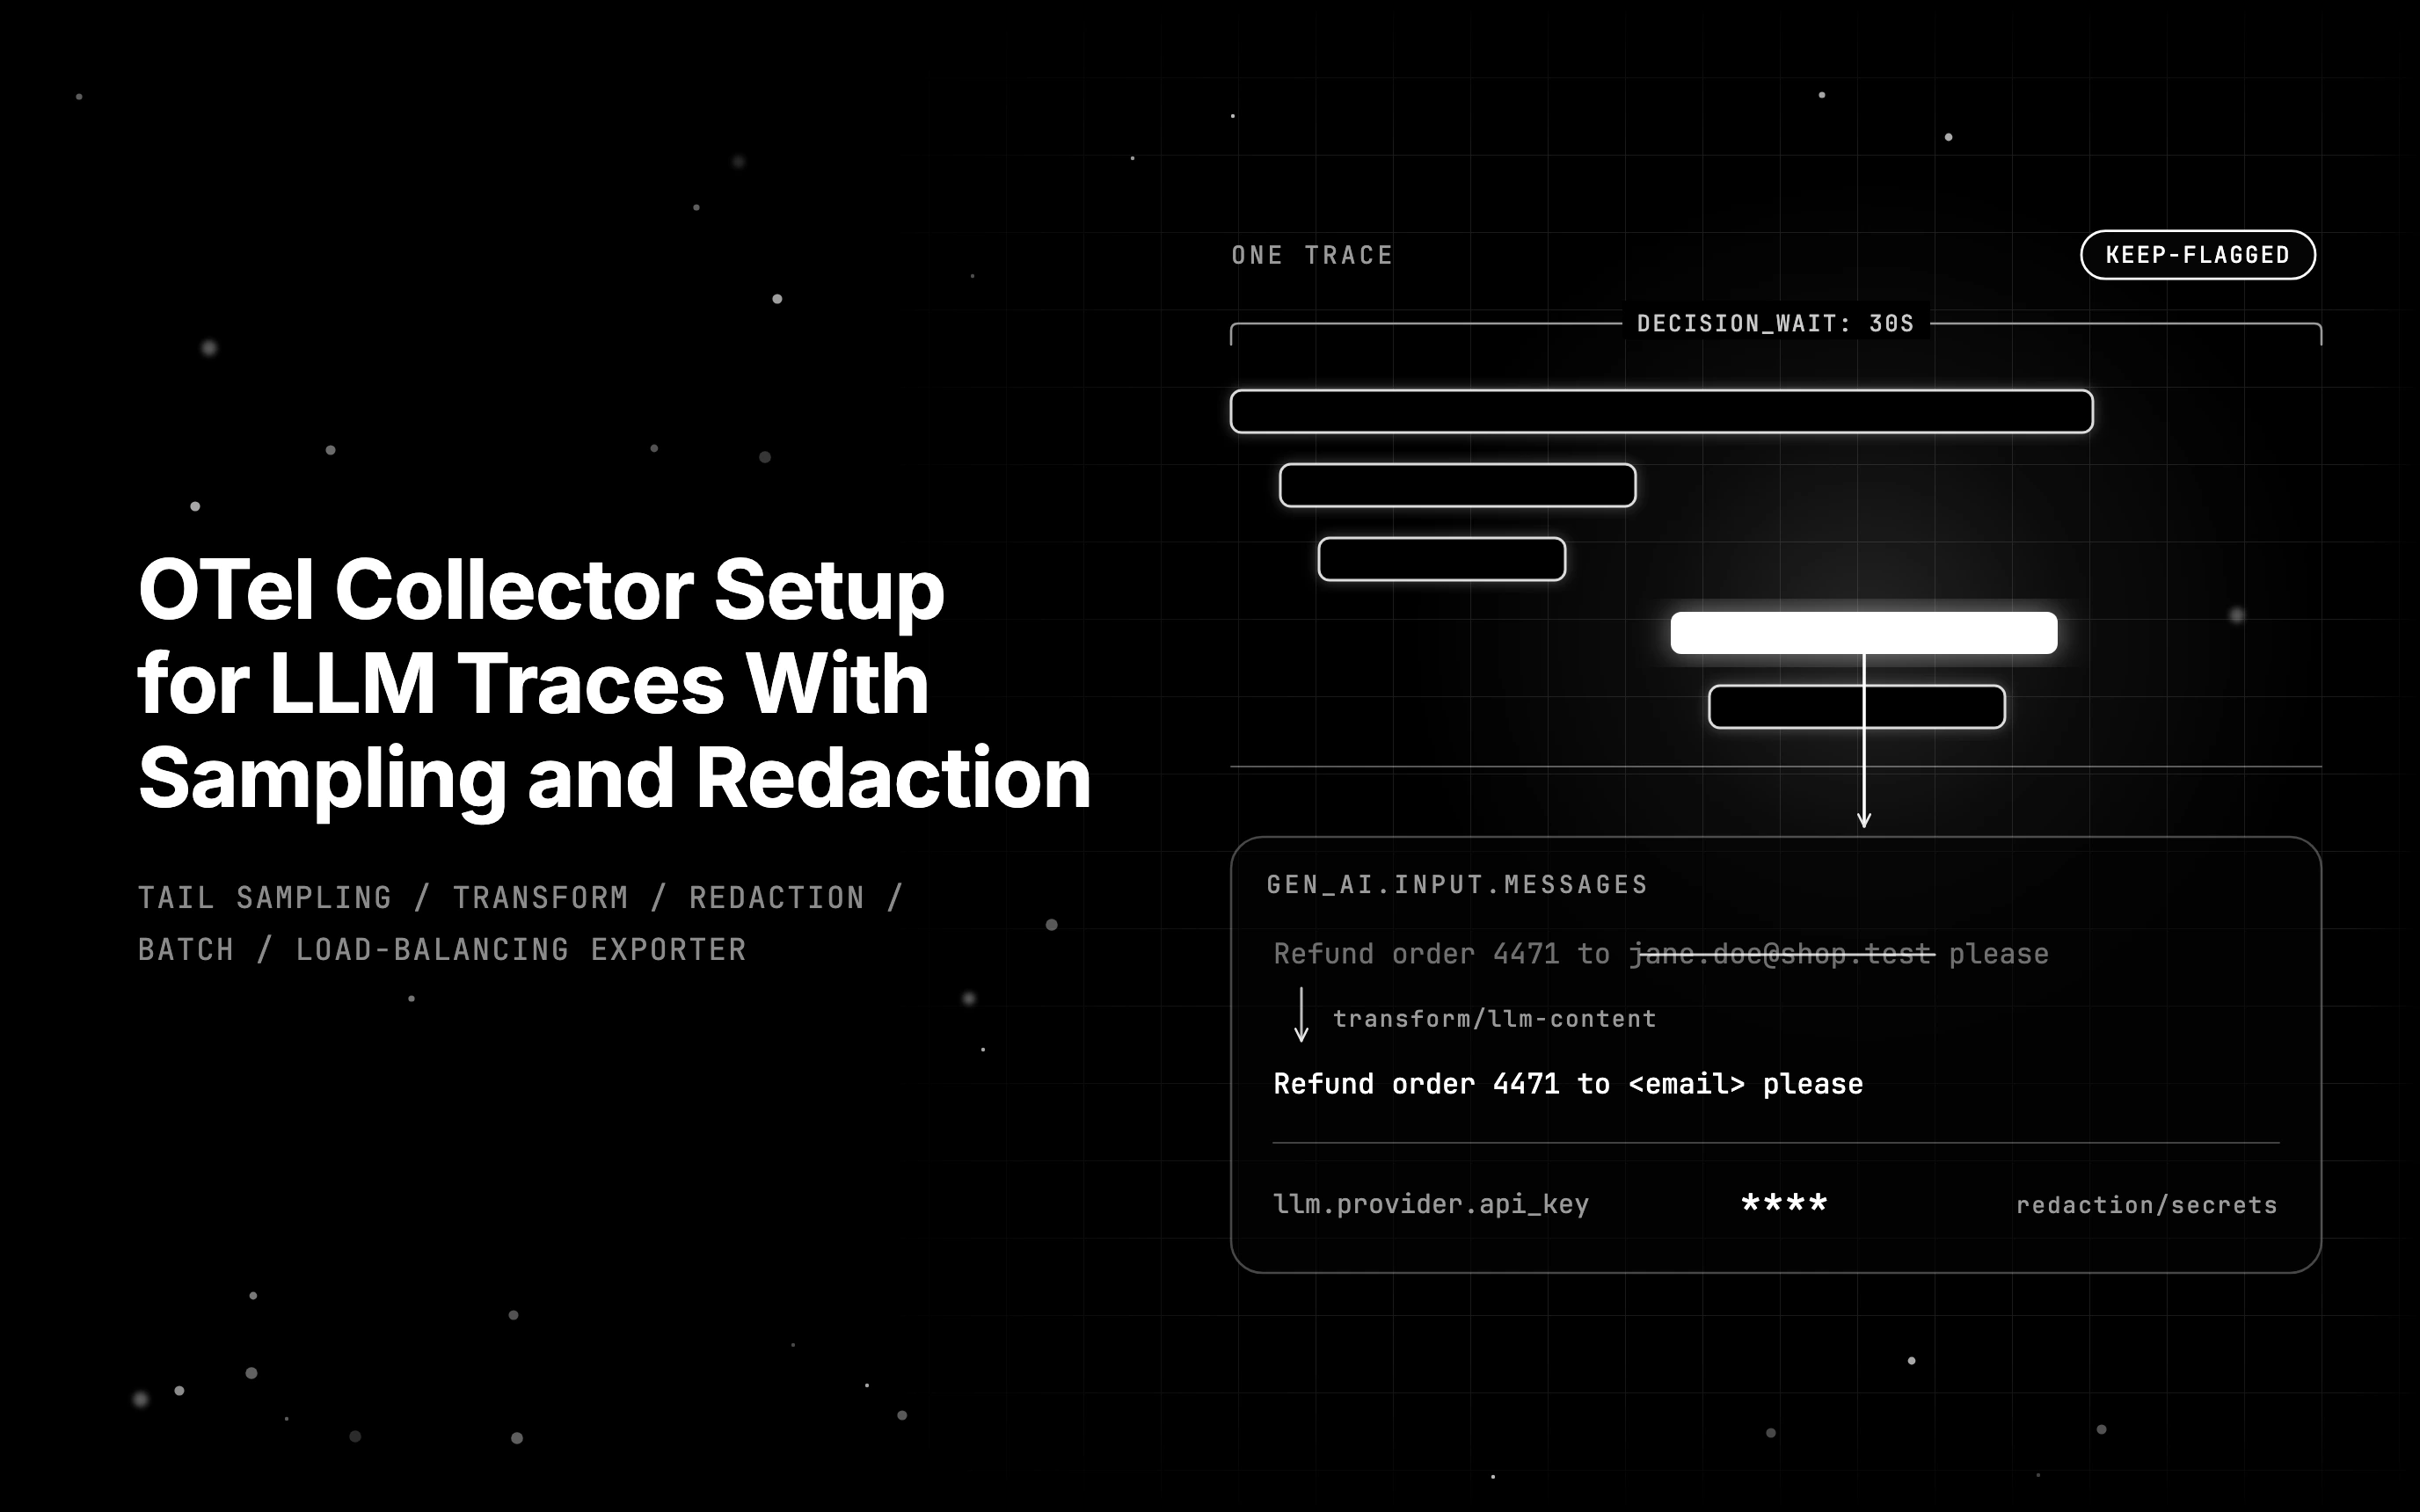
Table of Contents
A support team already runs a collector for its web app traces, and last month it added an LLM agent that answers refund questions. Then a customer escalates a wrong refund answer, and the otel collector has nothing to show. A head sampler in the SDK dropped that run at its first span, before anyone knew it would fail.
The traces that were kept have a second problem. The collector forwarded them untouched, so customers’ email addresses sit inside the prompt attribute on a third-party backend. The run the team needs is missing, and the runs it does have carry personal data that should never have left the cluster.
This guide fixes both inside the collector you already run. It covers the pipeline for LLM spans, a tail sampling policy that keeps failed and flagged runs, collector-side redaction, batching, two exporters, and the agent and gateway layout. The final config was tested end to end.
TL;DR
- An otel collector already in your stack can carry LLM spans; add processors to the pipeline you already run.
- Head sampling decides before the run fails, so keep failed and flagged LLM runs with tail sampling in the collector.
- Scrub prompt and output attributes with the transform and redaction processors before any exporter sends them.
- Batch after sampling, then fan out the same traces to two OTLP backends from one pipeline.
- Tail sampling needs every span of a trace on one collector, so run a load-balancing tier in front of it.
The OTel collector pipeline for LLM spans
An OTel collector is a vendor-neutral service that receives telemetry, processes it, and exports it to one or more backends. Receivers take spans in, processors change or drop them, and exporters send them out. LLM spans reuse your OTLP receiver; only the processor chain changes, because prompts are large and sensitive.
You do not need a second collector. The OTLP receiver listens on 4317 for gRPC and 4318 for HTTP, and an instrumented agent sends to it like any service. What differs is the span itself: a payload that can hold a whole message history, raw customer text, and rare high-value failures that a random sample is likely to miss.
If you are still deciding where the collector sits, start with self-hosting an LLM observability stack.
For the producer side of the same pipeline, see how traceAI emits OpenTelemetry spans.
Check your distribution first. The tail sampling and redaction processors, and the load-balancing exporter used later, ship in the contrib and Kubernetes distributions, not in core. A core build will refuse a config that names them, so confirm the image first.
OTel collector architecture in three stages
The receiver accepts OTLP, the processor chain runs each processor in the order you list it, and the exporters fan the result out to every backend in the pipeline. Every processor sees only what earlier ones let through, so list order matters more than any single setting. One receiver can also feed several pipelines when destinations need different data.
Which attributes make LLM spans different
The GenAI conventions, now in the semantic-conventions-genai repository, define gen_ai.input.messages and gen_ai.output.messages as opt-in attributes for prompt and reply. Some instrumentors also write input.value and output.value, and traceAI defines all four keys. Redaction must target every one of them, or the uncovered keys still leak raw text.
The GenAI span conventions warn that this content is likely to be large and may exceed backend limits.
Head vs tail sampling for LLM traces
Head sampling decides at the root span, before the model call runs, so it cannot know a run will fail. Tail sampling waits until the trace is complete and then applies policies. For opentelemetry llm tracing, let the SDK drop only known noise by rule and make every keep-or-drop decision in the collector.
A head sampler sees only the span name and the attributes set at start. At that moment the refund agent’s bad run looks like every healthy one, because the wrong answer, the error status and any guardrail hit come later. A random head sample keeps those failures only by luck, which is the blind spot of head-based trace sampling.
The tail sampling processor holds each trace for decision_wait, 30 seconds by default, and keeps up to num_traces, 50,000 by default, in memory. Then it runs your policies against the finished trace. The price is memory for those large prompt attributes, plus a placement rule: every span of a trace must reach one instance.
This guide stays on the collector side, so for SDK-side setup with register() and span enrichment, read LLM app observability with OpenTelemetry.
| Dimension | Head sampling (SDK) | Tail sampling (collector) |
|---|---|---|
| When the decision happens | At root span start | After decision_wait, on the whole trace |
| Can it keep failed runs | Not by outcome | Yes, status_code policy |
| Can it keep runs flagged by an attribute | Only if set at span start | Yes, boolean_attribute policy |
| Memory cost | None in the collector | Up to num_traces held |
| Where it is configured | Application or SDK | Collector YAML |
| Scaling requirement | None | All spans of a trace on one instance |
What head sampling is still good for
Head sampling still suits traffic you never want to see. Drop health checks, load tests and synthetic probes at the SDK by rule, matched on the span name or a start attribute such as a synthetic-traffic flag. Everything else goes to the collector unsampled, where the full trace decides.
A tail sampling policy that keeps every failed and flagged run
Write the policy as a list where any match keeps the trace. A status_code policy keeps errors, a boolean_attribute policy keeps runs your app flagged, a latency policy keeps slow runs, and a probabilistic policy keeps a slice of the rest. The processor samples a trace when any policy says sample.
Our four policies are keep-errors (status ERROR), keep-flagged (app.llm.flagged is true), keep-slow (over 20,000 ms) and sample-the-rest (10 percent). A drop decision from any policy discards the trace; otherwise one sample decision keeps it. If nothing matches, the trace is dropped, so you can predict outcomes by reading the list.
The tail sampling processor README documents this decision flow and every policy type.
app.llm.flagged must be on a span before decision_wait ends, so feedback that arrives days later cannot rescue a dropped trace. Set it in-process on a low-confidence answer, a guardrail hit or a failed inline eval. The probabilistic policy hashes the trace ID with FNV-1a and a configurable hash_salt, so traces stay whole.
Ordering policies and the drop policy
Exclude health checks with a drop policy, because invert_match on attribute policies is deprecated. A drop decision beats every sample decision. sample_on_first_match stops at the first matching policy and saves CPU, but then list order decides outcomes, so leave it off until profiling says otherwise.
Late spans and decision_wait
A span that arrives after its trace was decided is late. By default, once the decision leaves memory, late spans get a fresh decision, which can split one run. Contrib issue #31498 asks for smarter waiting on late spans for the same reason. Set decision_cache.sampled_cache_size and decision_cache.non_sampled_cache_size, both 0 by default, well above num_traces.
Redacting prompt and output attributes before export
Redact in the collector so no exporter ever sees raw prompts. The transform processor rewrites the content attributes with replace_pattern and caps size with truncate_all. The redaction processor then masks secrets by key pattern and value regex. Both run after tail sampling, so you only pay CPU for traces you keep.
The transform processor runs OTTL statements against each span.
Our transform/llm-content block applies one email pattern with replace_pattern to string values on all four content keys. Native GenAI message arrays are not strings, so this recipe drops those content attributes rather than exporting them unmasked. The rest of the trace stays intact. To keep structured content, scrub it in an SDK content hook before collection.
The block uses error_mode: propagate, so a processing error rejects the payload instead of silently forwarding raw content. It then calls truncate_all(span.attributes, 16384), which caps each string attribute value at 16,384 bytes, not the span as a whole. A cut JSON message string no longer parses, so set the cap above your longest normal prompt.
The redaction processor then works across every attribute key.
Set allow_all_keys: true, because an empty allowed_keys list removes every attribute. Then blocked_key_patterns masks keys matching api_key and authorization, and blocked_values masks key-shaped and card-shaped strings. Finally, summary: info adds counts such as redaction.masked.count, so you can audit what changed.
Watch two redaction behaviours. allowed_values takes precedence over blocked_values, the root of contrib issue #43826, and numbers are skipped unless redact_all_types is set, the fix for #36684. Treat regex scrubbing as the second line of defence. The first is not capturing content at the SDK.
Transform for content, redaction for secrets
OTTL in the transform processor targets named keys and rewrites part of a string value, including a JSON-encoded message array. The GenAI conventions require structured message values; replace_pattern does not walk those arrays. The type guards below drop them. The redaction processor then masks key-shaped secrets in the remaining string attributes.
Masking vs dropping the content attribute
Masking keeps the prompt readable minus the sensitive part. When a backend must never hold content, remove the attribute with delete_key in the transform processor. When you need joinable values, set hash_function: hmac-sha256 with an hmac_key from an environment variable, so equal inputs stay equal and raw values never leave.
One prompt attribute before and after the collector
This refund span uses a JSON-encoded string for its message attribute. Transform masked the email, and redaction masked the provider key and the card number. A native message array instead loses its content attribute, not the span. The redaction.masked.count attribute records the two values masked by the redaction processor, so you can audit each span.
# before the collector
gen_ai.input.messages   = [{"role":"user","parts":[{"type":"text","content":"Refund order 4471 to jane.doe@shop.test please"}]}]
llm.provider.api_key    = sk-live-abcdefghijklmnopqrstuvwx
payment.note            = card 4111111111111111 on file

# after transform/llm-content and redaction/secrets
gen_ai.input.messages   = [{"role":"user","parts":[{"type":"text","content":"Refund order 4471 to <email> please"}]}]
llm.provider.api_key    = ****
payment.note            = card **** on file
redaction.masked.count  = 2
Batching large span payloads and fanning out to two backends
Put the batch processor last in the chain so it groups only spans that survived sampling and redaction. Set send_batch_max_size so one long agent trace cannot build an oversized request. Then list two exporters in the pipeline; the collector sends every batch to each of them.
The batch processor README in core v0.165.0 sets the defaults.
send_batch_size defaults to 8192, timeout to 200ms, and send_batch_max_size to 0, meaning no cap. LLM spans are heavy, so this config uses 512, a cap of 1024 and a 5s timeout. If you batch in the exporter’s sending queue instead, pick one, because the collector warns at startup when both are on.
Fan-out needs no extra component: list otlp_http/futureagi and otlp_grpc/archive in the pipeline and every batch goes to both, gzip-compressed by default. Collector v0.144.0 renamed otlp to otlp_grpc and otlphttp to otlp_http, keeping deprecated aliases. Contrib issue #45339 tracks the same naming change across the contrib components.
When each backend needs different data
When an archive must hold no prompts while your debugging backend keeps masked ones, define two pipelines that share the one OTLP receiver. Give each its own transform processor and exporter, and keep tail sampling identical in both. Otherwise the two backends will disagree about which runs exist.
Agent vs gateway deployment and the OTel collector Helm chart
Run an agent collector next to each app for local batching, and a gateway tier for tail sampling, because tail sampling needs every span of a trace on the same instance. A load-balancing exporter keyed on traceID routes spans to the right gateway pod. The Helm chart deploys either shape.
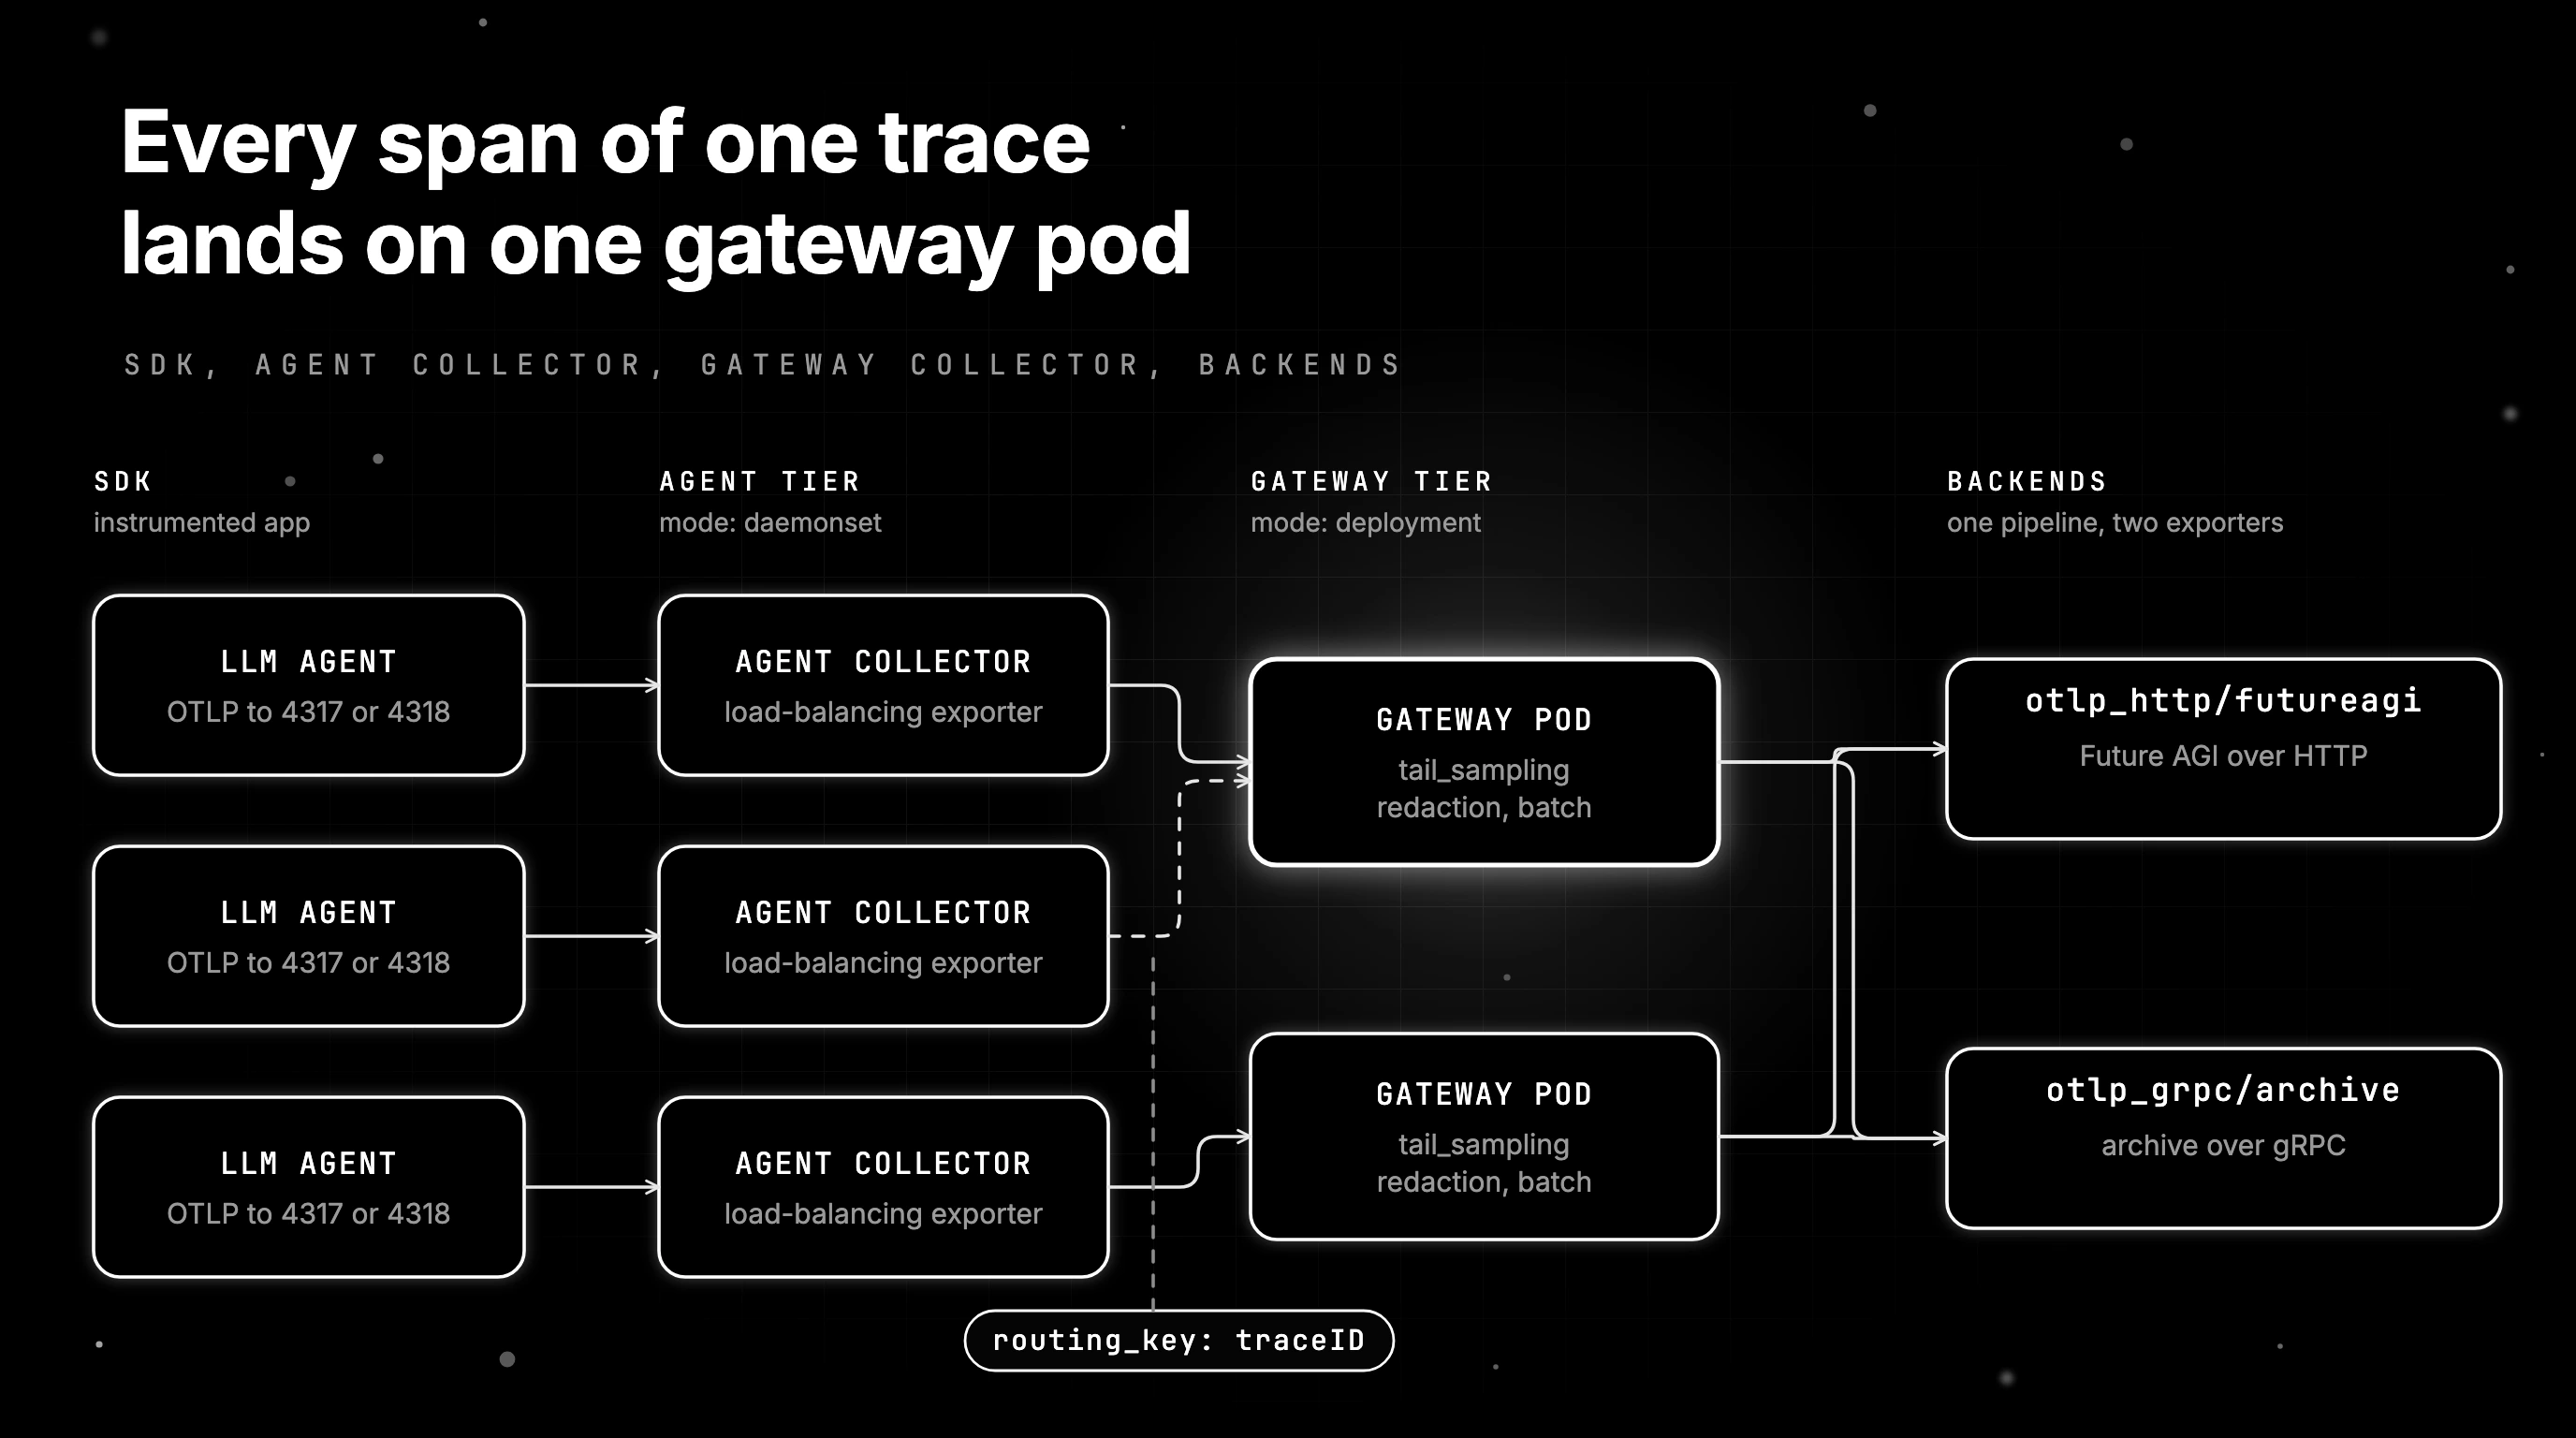
The agent deployment pattern runs a collector beside the application, as a sidecar or DaemonSet.
The gateway deployment pattern puts a central tier behind those agents.
In the agent tier, the load-balancing exporter sends each trace to one gateway pod.
Its routing_key defaults to traceID for traces, so every span of one run lands on the same pod. Point the resolver at a dns headless service, or use the k8s resolver, which picks up pod changes faster. Without this tier, two replicas each see half a trace and decide twice.
The OpenTelemetry Collector Helm chart deploys both tiers from one chart.
Add the open-telemetry repo with helm repo add, then set mode to daemonset for agents and deployment or statefulset for the gateway. The chart leaves image.repository empty. Its README example uses the Kubernetes distribution image with command.name set to otelcol-k8s, which includes every component this guide needs.
Chart 0.178.2, published 2026-11-02, ships appVersion 0.163.2. As of 2026-11-11, pin image.tag to 0.165.0, the newest collector release build, because contrib v0.165.1 only fixed resourcedetection and shipped no new image. Pinning also stops a chart upgrade from swapping the collector version under your config.
Helm values that matter for LLM traces
Five values carry the weight: mode, image.repository, command.name, a config override holding the pipeline below, and memory limits. The first three pick the tier and distribution. Size memory for decision_wait multiplied by your span rate, then set memory_limiter below the container limit, so the collector refuses data instead of being killed mid-decision.
The complete OTel collector config, tested end to end
The full config below wires one traces pipeline: an OTLP receiver, memory_limiter first, tail_sampling, transform, redaction, batch last, and two OTLP exporters. It was tested end to end. Run otelcol-contrib validate on it before you deploy to your own cluster.
The components match opentelemetry-collector-contrib v0.165.1, the latest contrib release as of 2026-11-11.
# OTel Collector config for LLM traces: tail sampling, prompt/output redaction, batching, two OTLP backends.
receivers:
  otlp:
    protocols:
      grpc:
        endpoint: 0.0.0.0:4317
      http:
        endpoint: 0.0.0.0:4318

processors:
  memory_limiter:
    check_interval: 1s
    limit_percentage: 80
    spike_limit_percentage: 20

  tail_sampling:
    decision_wait: 30s
    num_traces: 50000
    policies:
      - name: keep-errors
        type: status_code
        status_code: {status_codes: [ERROR]}
      - name: keep-flagged
        type: boolean_attribute
        boolean_attribute: {key: app.llm.flagged, value: true}
      - name: keep-slow
        type: latency
        latency: {threshold_ms: 20000}
      - name: sample-the-rest
        type: probabilistic
        probabilistic: {sampling_percentage: 10}

  transform/llm-content:
    error_mode: propagate
    trace_statements:
      # replace_pattern only scrubs strings. Drop unsupported shapes, not the trace.
      - delete_key(span.attributes, "gen_ai.input.messages") where not IsString(span.attributes["gen_ai.input.messages"])
      - delete_key(span.attributes, "gen_ai.output.messages") where not IsString(span.attributes["gen_ai.output.messages"])
      - delete_key(span.attributes, "input.value") where not IsString(span.attributes["input.value"])
      - delete_key(span.attributes, "output.value") where not IsString(span.attributes["output.value"])
      - replace_pattern(span.attributes["gen_ai.input.messages"], "[A-Za-z0-9._%+-]+@[A-Za-z0-9.-]+\\.[A-Za-z]{2,}", "<email>") where IsString(span.attributes["gen_ai.input.messages"])
      - replace_pattern(span.attributes["gen_ai.output.messages"], "[A-Za-z0-9._%+-]+@[A-Za-z0-9.-]+\\.[A-Za-z]{2,}", "<email>") where IsString(span.attributes["gen_ai.output.messages"])
      - replace_pattern(span.attributes["input.value"], "[A-Za-z0-9._%+-]+@[A-Za-z0-9.-]+\\.[A-Za-z]{2,}", "<email>") where IsString(span.attributes["input.value"])
      - replace_pattern(span.attributes["output.value"], "[A-Za-z0-9._%+-]+@[A-Za-z0-9.-]+\\.[A-Za-z]{2,}", "<email>") where IsString(span.attributes["output.value"])
      - truncate_all(span.attributes, 16384)
      - set(resource.attributes["project_name"], "support-agent") where resource.attributes["project_name"] == nil
      - set(resource.attributes["project_type"], "observe") where resource.attributes["project_type"] == nil

  redaction/secrets:
    allow_all_keys: true
    blocked_key_patterns:
      - ".*api_key.*"
      - ".*authorization.*"
    blocked_values:
      - "sk-[A-Za-z0-9_-]{20,}"
      - "4[0-9]{12}(?:[0-9]{3})?"
    summary: info

  batch:
    send_batch_size: 512
    send_batch_max_size: 1024
    timeout: 5s

exporters:
  otlp_http/futureagi:
    traces_endpoint: https://api.futureagi.com/tracer/v1/traces
    headers:
      x-api-key: ${env:FI_API_KEY}
      x-secret-key: ${env:FI_SECRET_KEY}
  otlp_grpc/archive:
    endpoint: trace-archive.internal:4317
    tls:
      insecure: true

service:
  pipelines:
    traces:
      receivers: [otlp]
      processors: [memory_limiter, tail_sampling, transform/llm-content, redaction/secrets, batch]
      exporters: [otlp_http/futureagi, otlp_grpc/archive]
The ${env:FI_API_KEY} syntax reads each secret from the environment at startup, so the YAML can live in Git. Replace trace-archive.internal:4317 with your own archive endpoint. Turn on TLS for that exporter unless the address stays inside your private cluster network.
Run otelcol-contrib validate --config collector.yaml, which checks the config without running the collector. Then add a debug exporter, send one flagged trace and one clean trace, and confirm the flagged run survives with its email masked. The clean one may or may not appear, since it falls to the 10 percent policy.
| Component | Type | Job in the LLM pipeline | Key settings used |
|---|---|---|---|
otlp | Receiver | Accepts spans | gRPC 4317, HTTP 4318 |
memory_limiter | Processor | Refuses data under memory pressure | limit_percentage 80 |
tail_sampling | Processor | Keeps failed, flagged, slow and sampled runs | decision_wait 30s, four policies |
transform/llm-content | Processor | Masks string emails, drops unsupported content, caps size, sets project | IsString, delete_key, replace_pattern, truncate_all |
redaction/secrets | Processor | Masks secrets on all keys | allow_all_keys, blocked_values |
batch | Processor | Bounded requests | 512, max 1024, 5s |
otlp_http/futureagi | Exporter | Future AGI over HTTP | traces_endpoint, key headers |
otlp_grpc/archive | Exporter | Archive over gRPC | endpoint, tls |
Processor order and why it matters
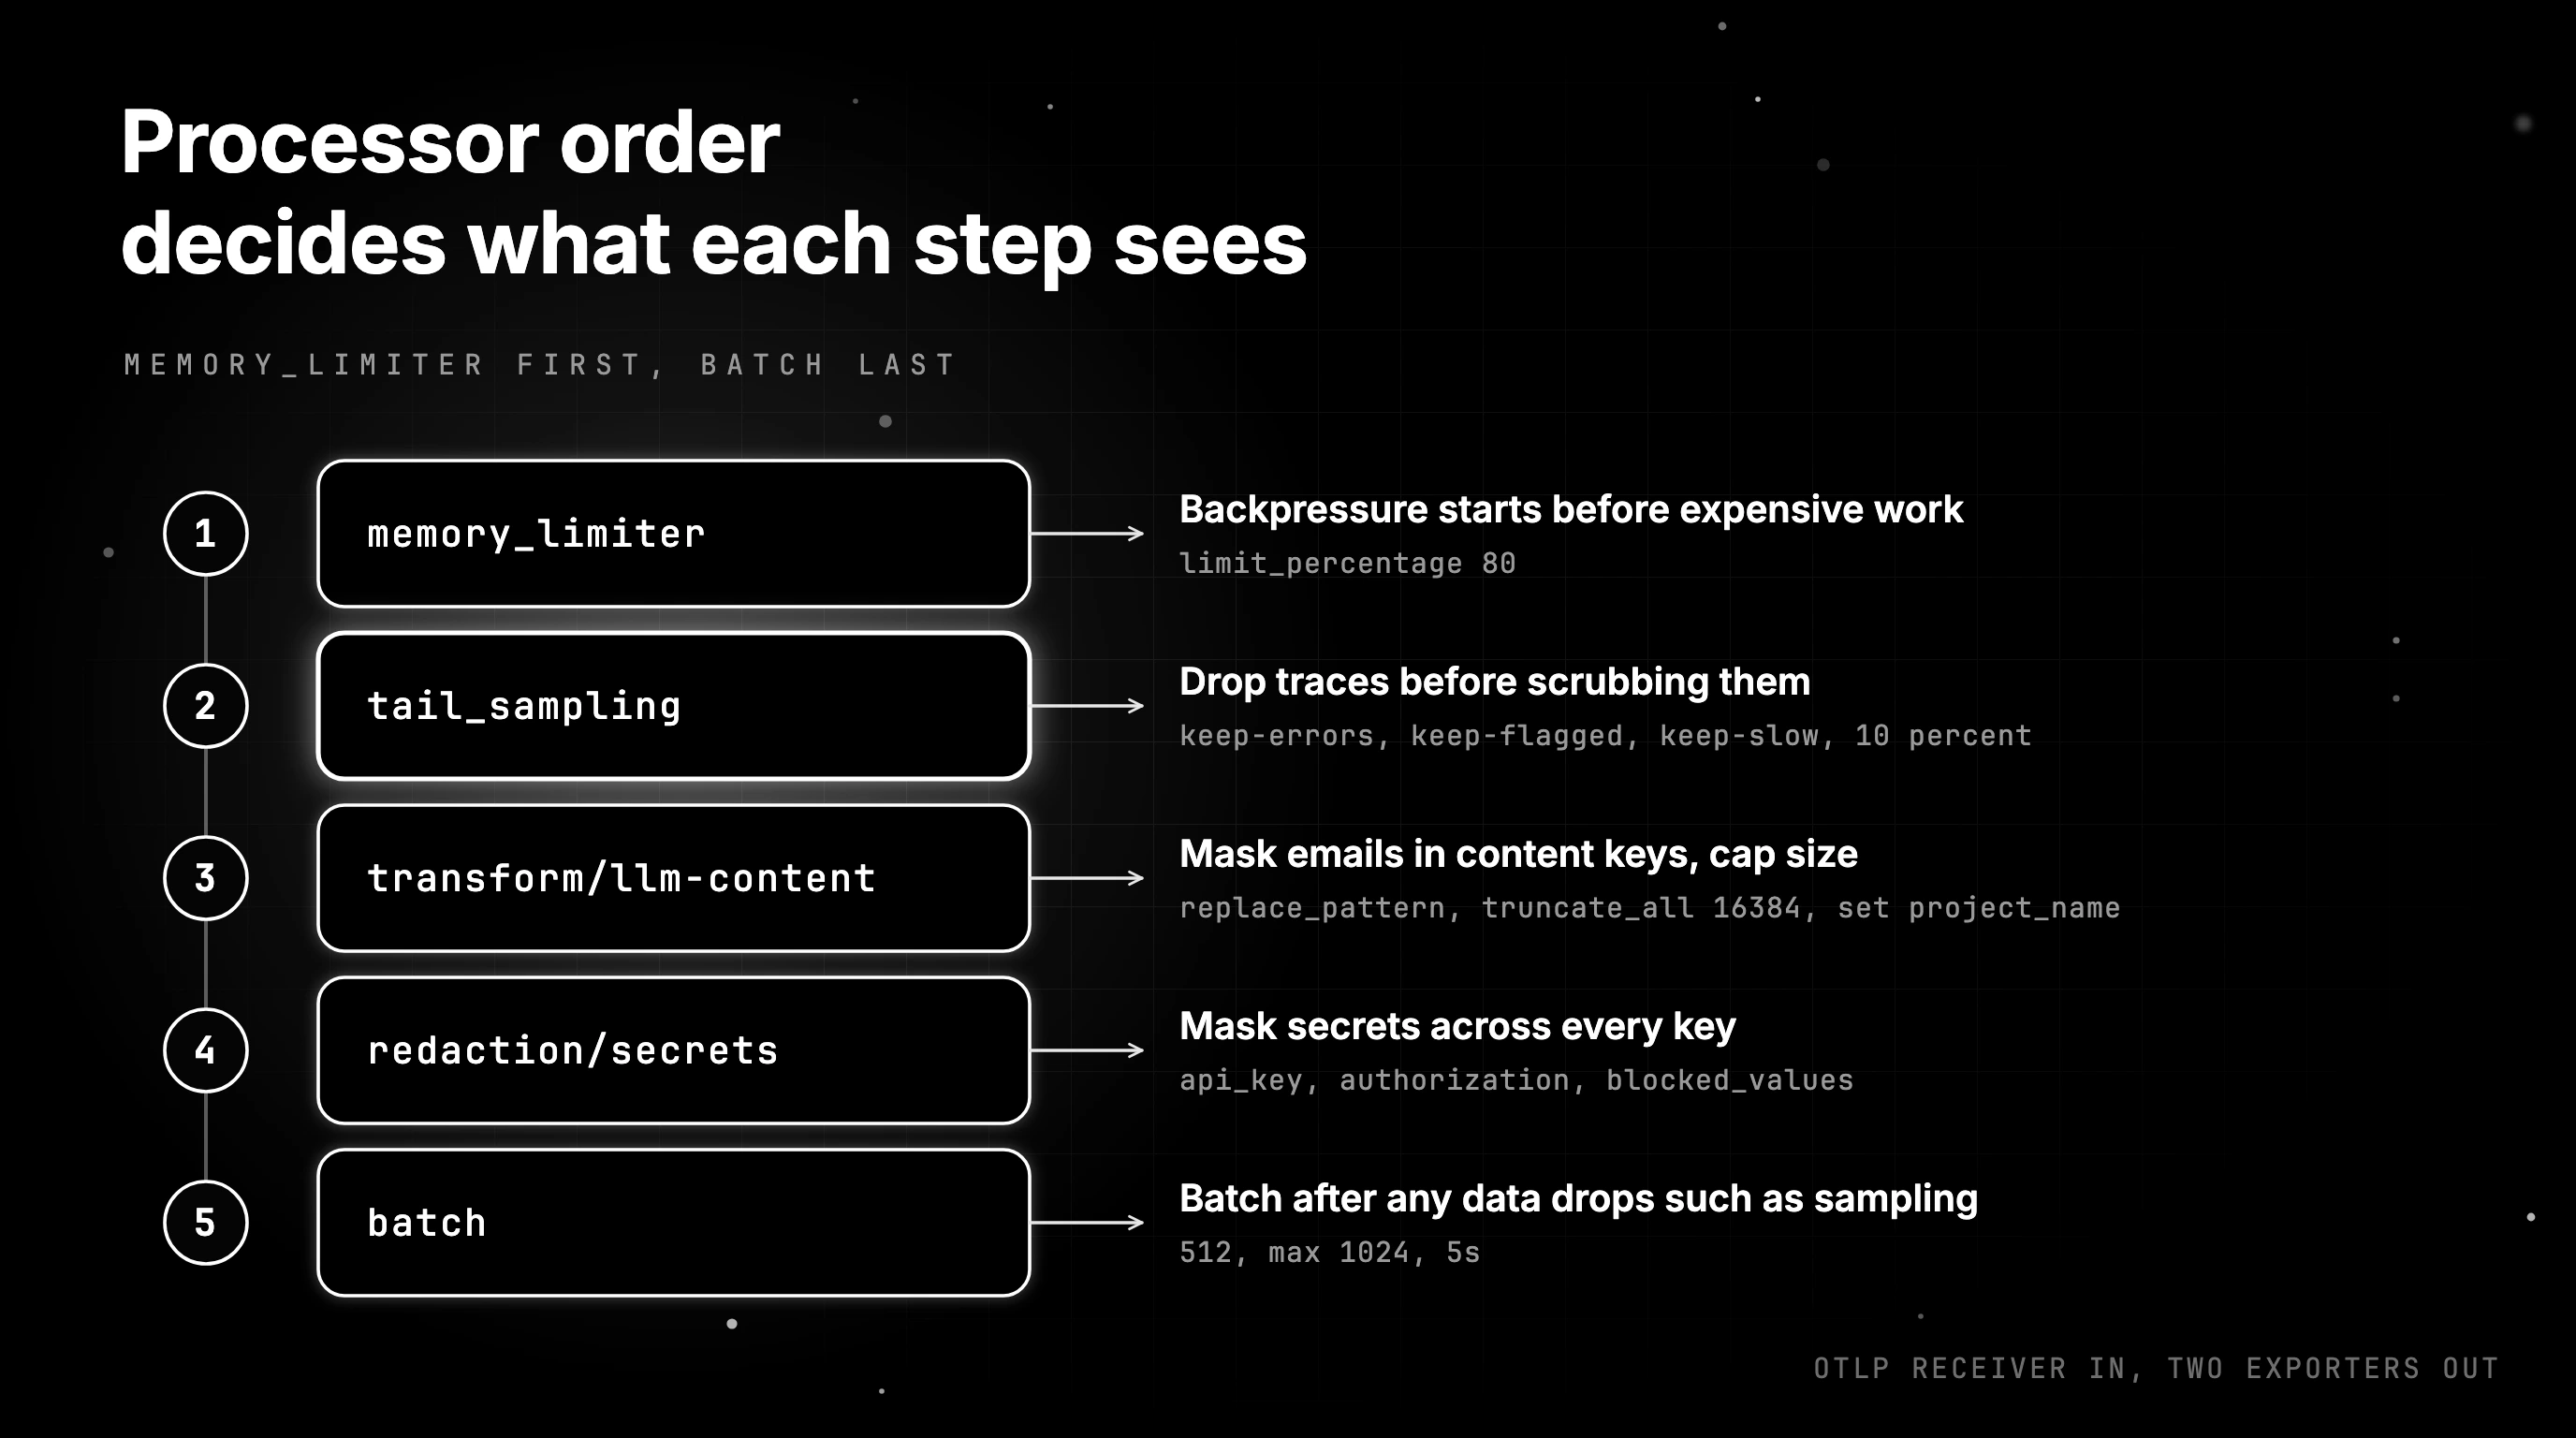
memory_limiter goes first so backpressure starts before expensive work. Sampling comes next, since scrubbing a trace you will drop is wasted CPU. batch goes last because, as its README says, batching should happen after any data drops such as sampling. Keep this order when you add processors of your own.
Sending collector traces to Future AGI
Future AGI accepts standard OTLP, so the collector needs only one more exporter. Point otlp_http at the Future AGI tracer endpoint, send your API key and secret key as headers, and make sure every batch carries a project_name resource attribute. The transform processor can set it when your SDK did not.
Future AGI rejects a batch whose resource has no project_name with HTTP 400 and creates the project on first use. That is why the config’s last two set statements fill project_name and set project_type to observe only where they are nil. Spans from a traceAI app keep the project they already set.
The docs page on the OTLP endpoint, headers and project_name documents this contract.
traceAI SDKs can also export directly: FI_BASE_URL defaults to https://api.futureagi.com for HTTP and FI_GRPC_URL to https://grpc.futureagi.com for gRPC. register() accepts an OpenTelemetry sampler through its sampler argument, but keep ratio decisions in the collector’s probabilistic policy. While the collector forwards your spans, skip a direct SDK export, or every run lands twice.
Both defaults are listed under FI_BASE_URL and FI_GRPC_URL.
The remaining setup arguments are in register() parameters, and the source is traceAI on GitHub.
If your agents run on Bedrock AgentCore, the same exporter contract applies to tracing Strands agents on Bedrock AgentCore.
The exporter block for Future AGI
This verbatim excerpt from the full config is the exporter you paste into an existing collector. It sits next to the exporters you already run. Add otlp_http/futureagi to the pipeline’s exporters list, keep the two set statements in your transform processor, and export both keys in the collector’s environment.
  otlp_http/futureagi:
    traces_endpoint: https://api.futureagi.com/tracer/v1/traces
    headers:
      x-api-key: ${env:FI_API_KEY}
      x-secret-key: ${env:FI_SECRET_KEY}
Getting the escalated support trace back, without the email
Replay the intro incident through this pipeline. The wrong refund answer was flagged in-process, so the keep-flagged policy holds the whole trace. Transform masks the customer email in the prompt before export, and both backends receive the same masked copy. Your team opens the trace instead of guessing what the agent saw.
Start with the gateway tier from the Helm chart, run validate against the config above, and push one test trace through the debug exporter. Then add the otlp_http/futureagi exporter and point it at a Future AGI project. Watch the next flagged refund run arrive whole, with every email masked.
A rollout order that avoids dropped traces
Ship redaction first with summary: info and read the masked counts for a day. Next, turn on tail sampling with the probabilistic policy at 100 percent, so nothing is dropped while you confirm the keep rules fire. Only then lower the probabilistic share to what you can afford to store.
Frequently Asked Questions
What is otel collector used for?
What is the difference between OTLP ports 4317 and 4318?
What is otel collector contrib?
How to deploy otel collector?
How to test otel collector?
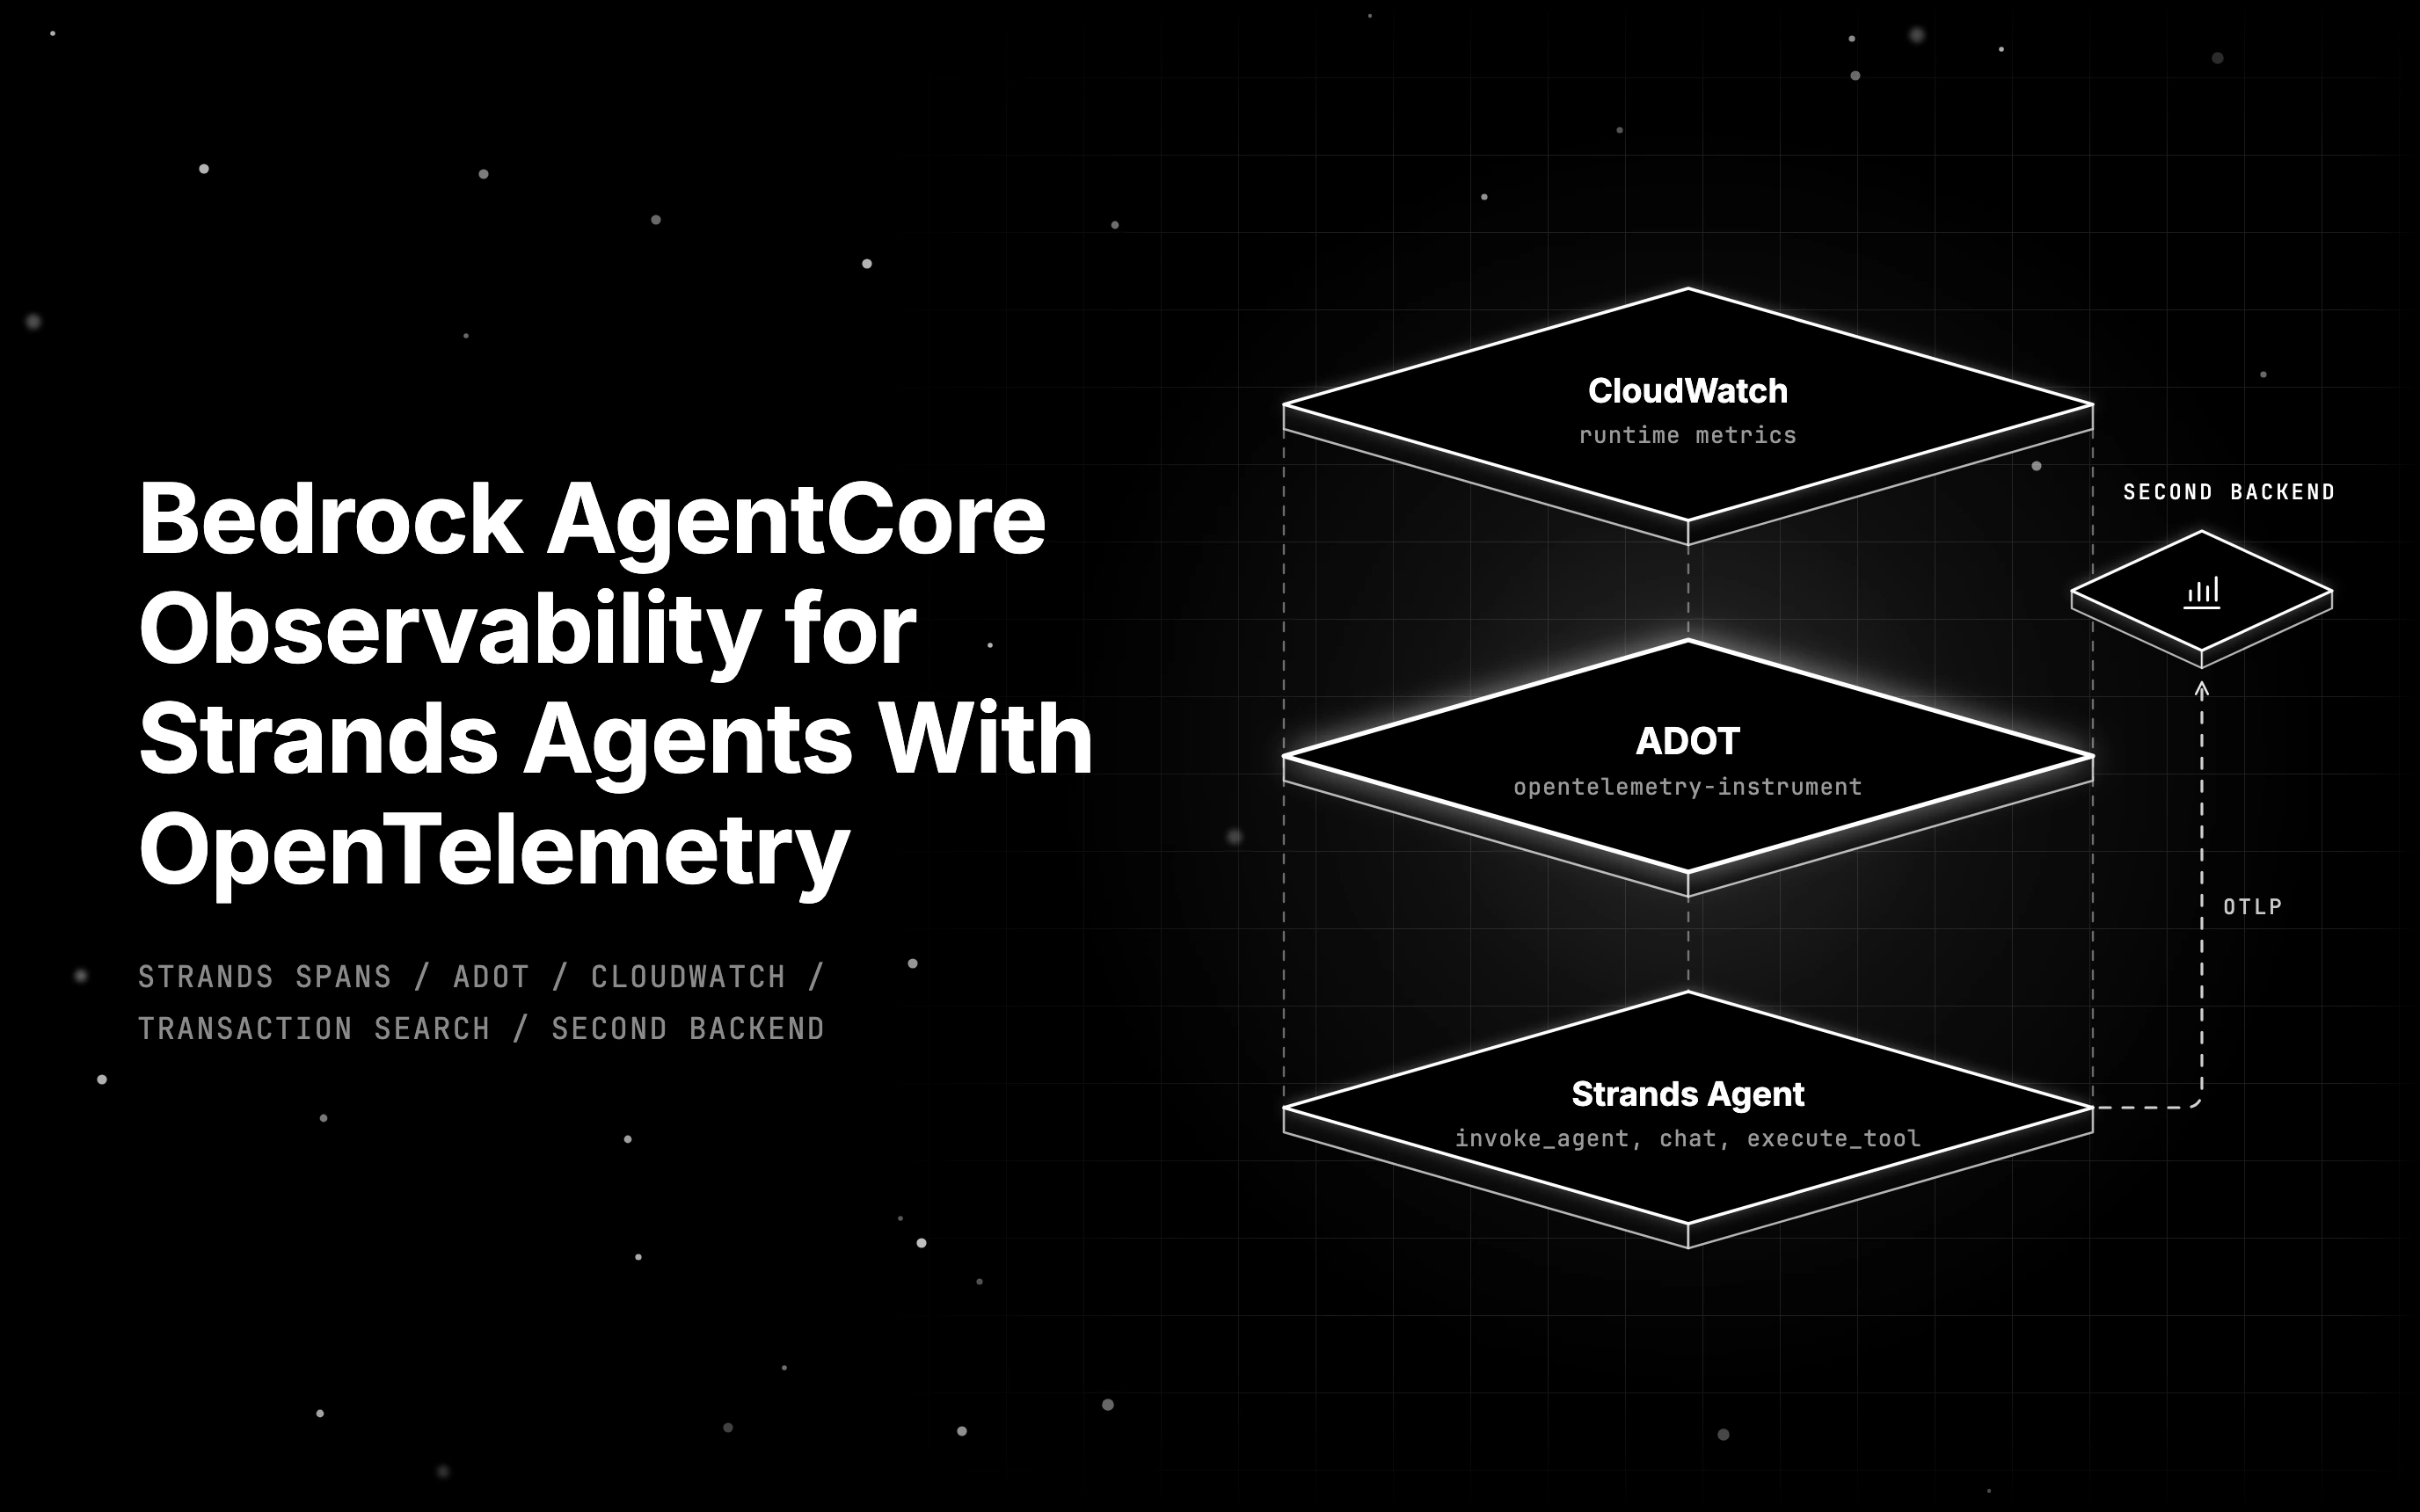
Bedrock AgentCore observability sends Strands spans to CloudWatch by default. See what ADOT captures, what CLI 1.0 changed, and how to run evals on those spans.

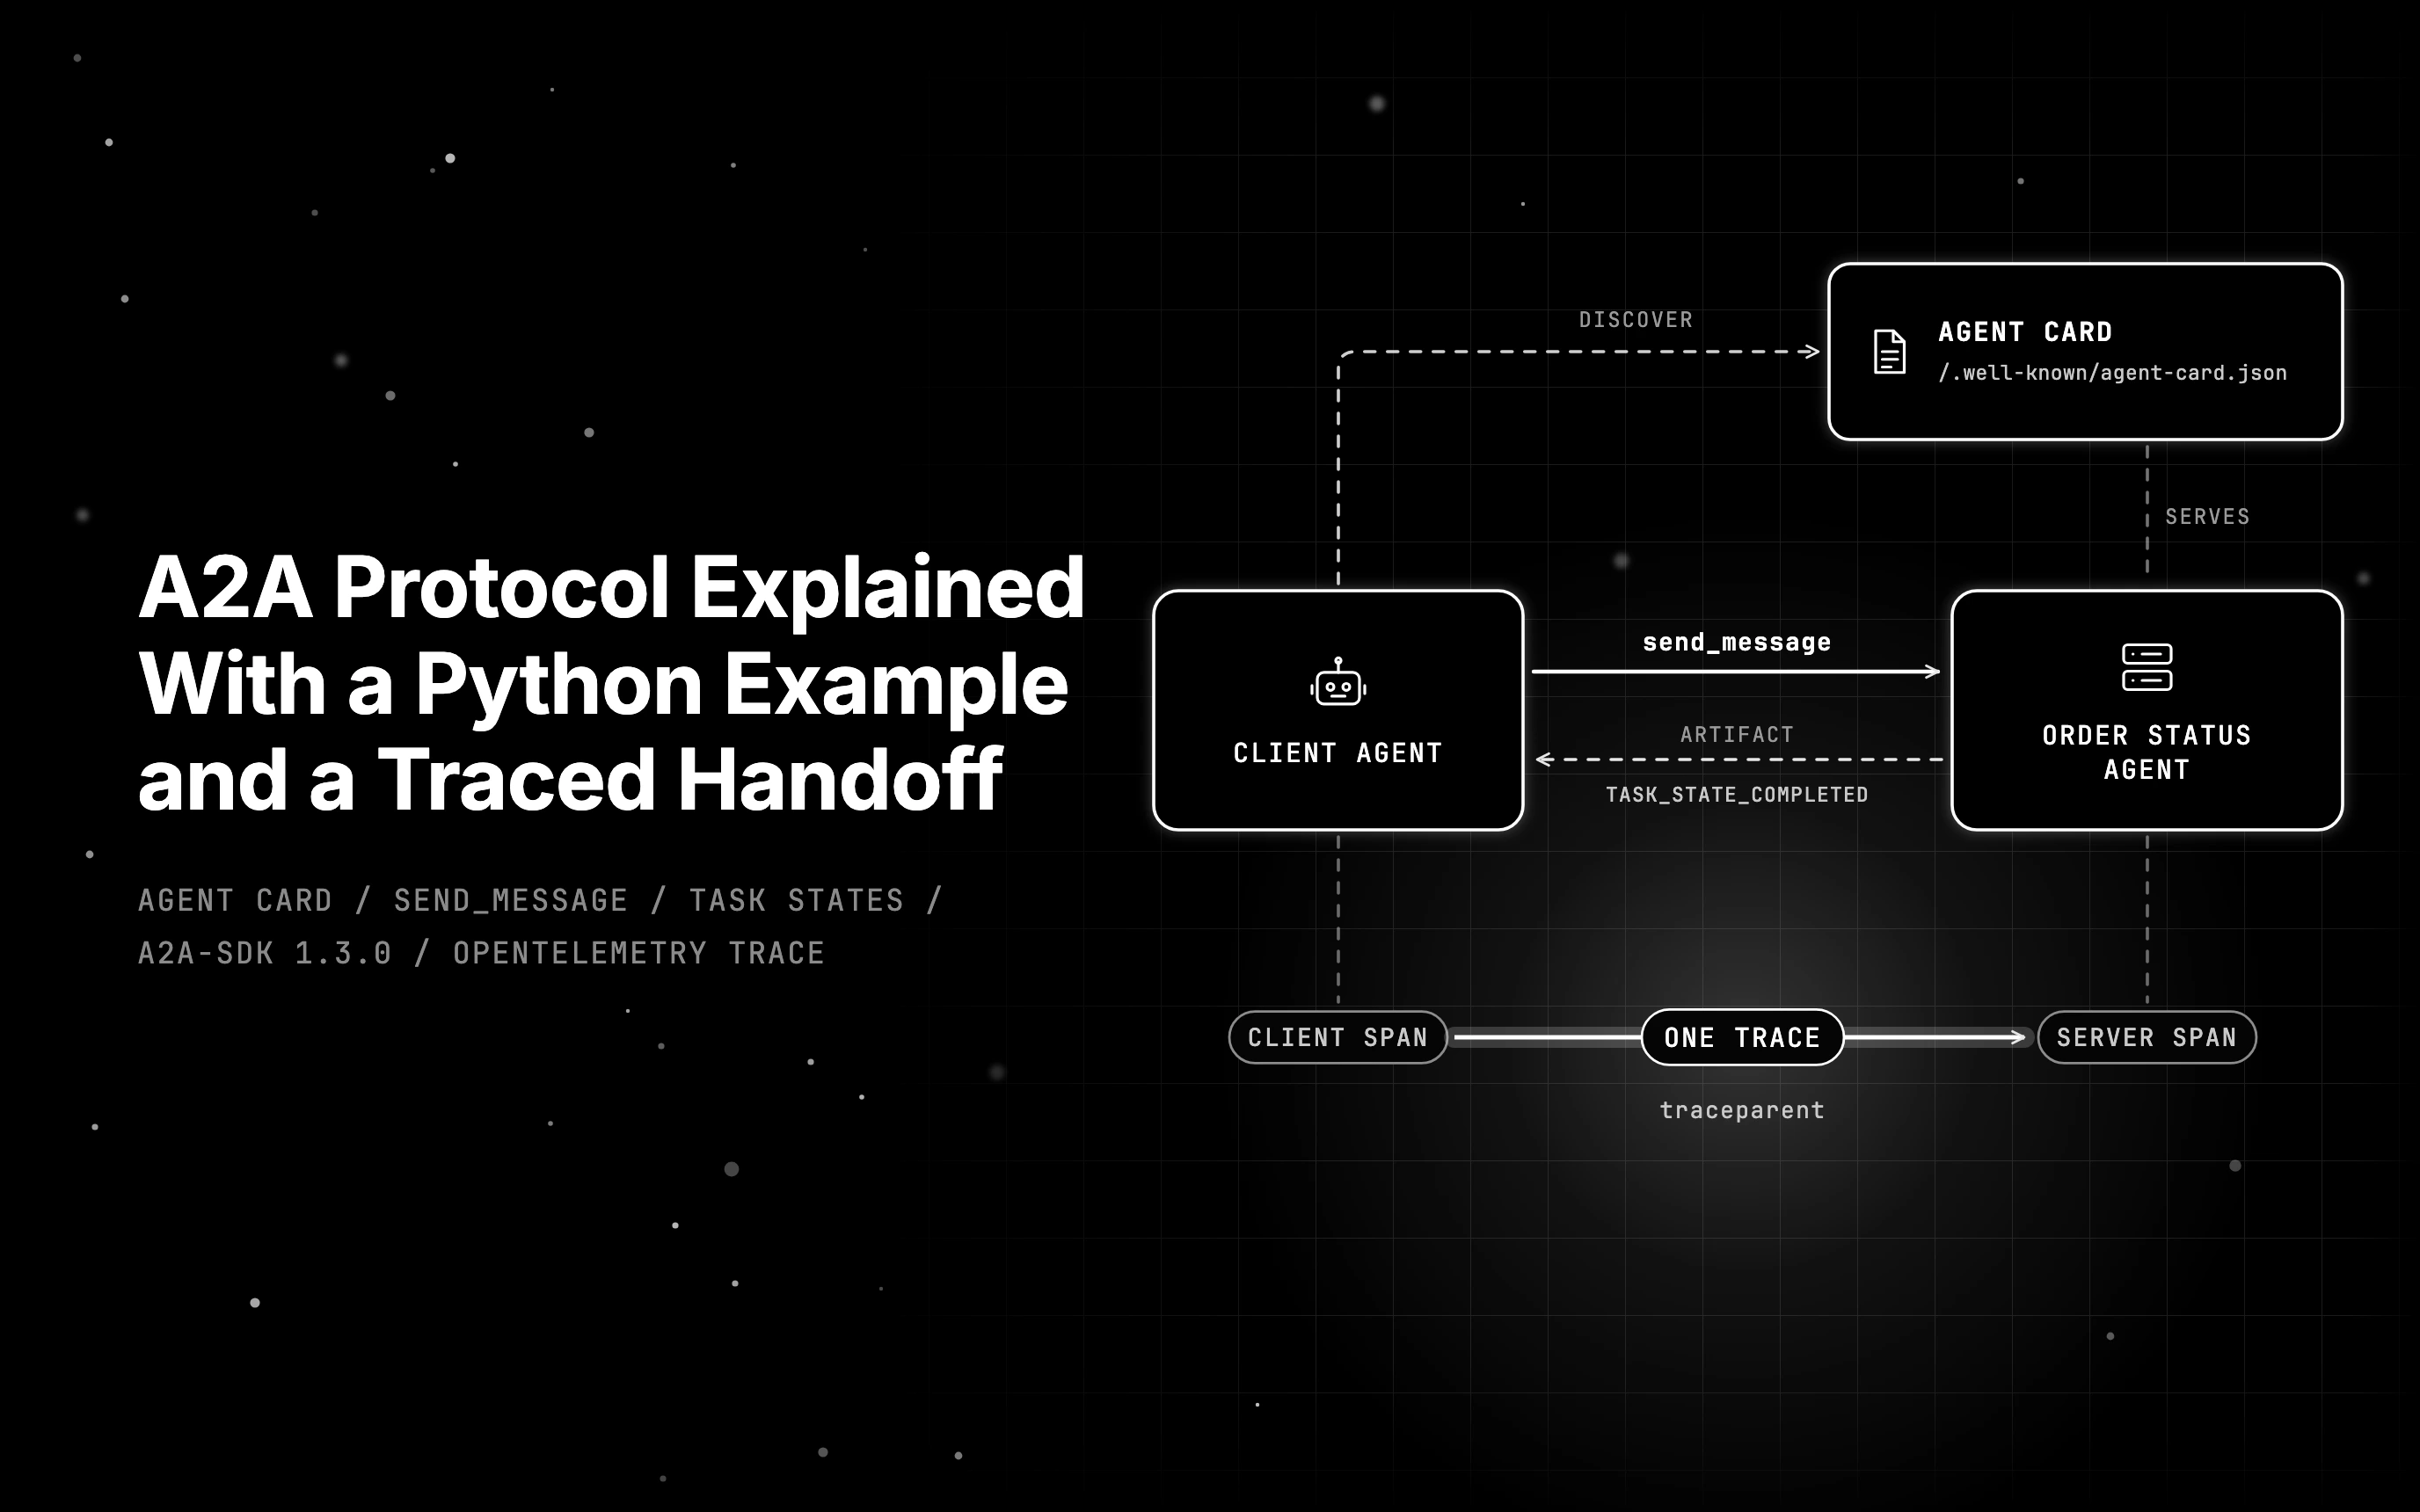
Learn the a2a protocol at v1.0: Agent Cards, task states, auth schemes, and a runnable Python handoff between two agents, traced end to end in one trace.

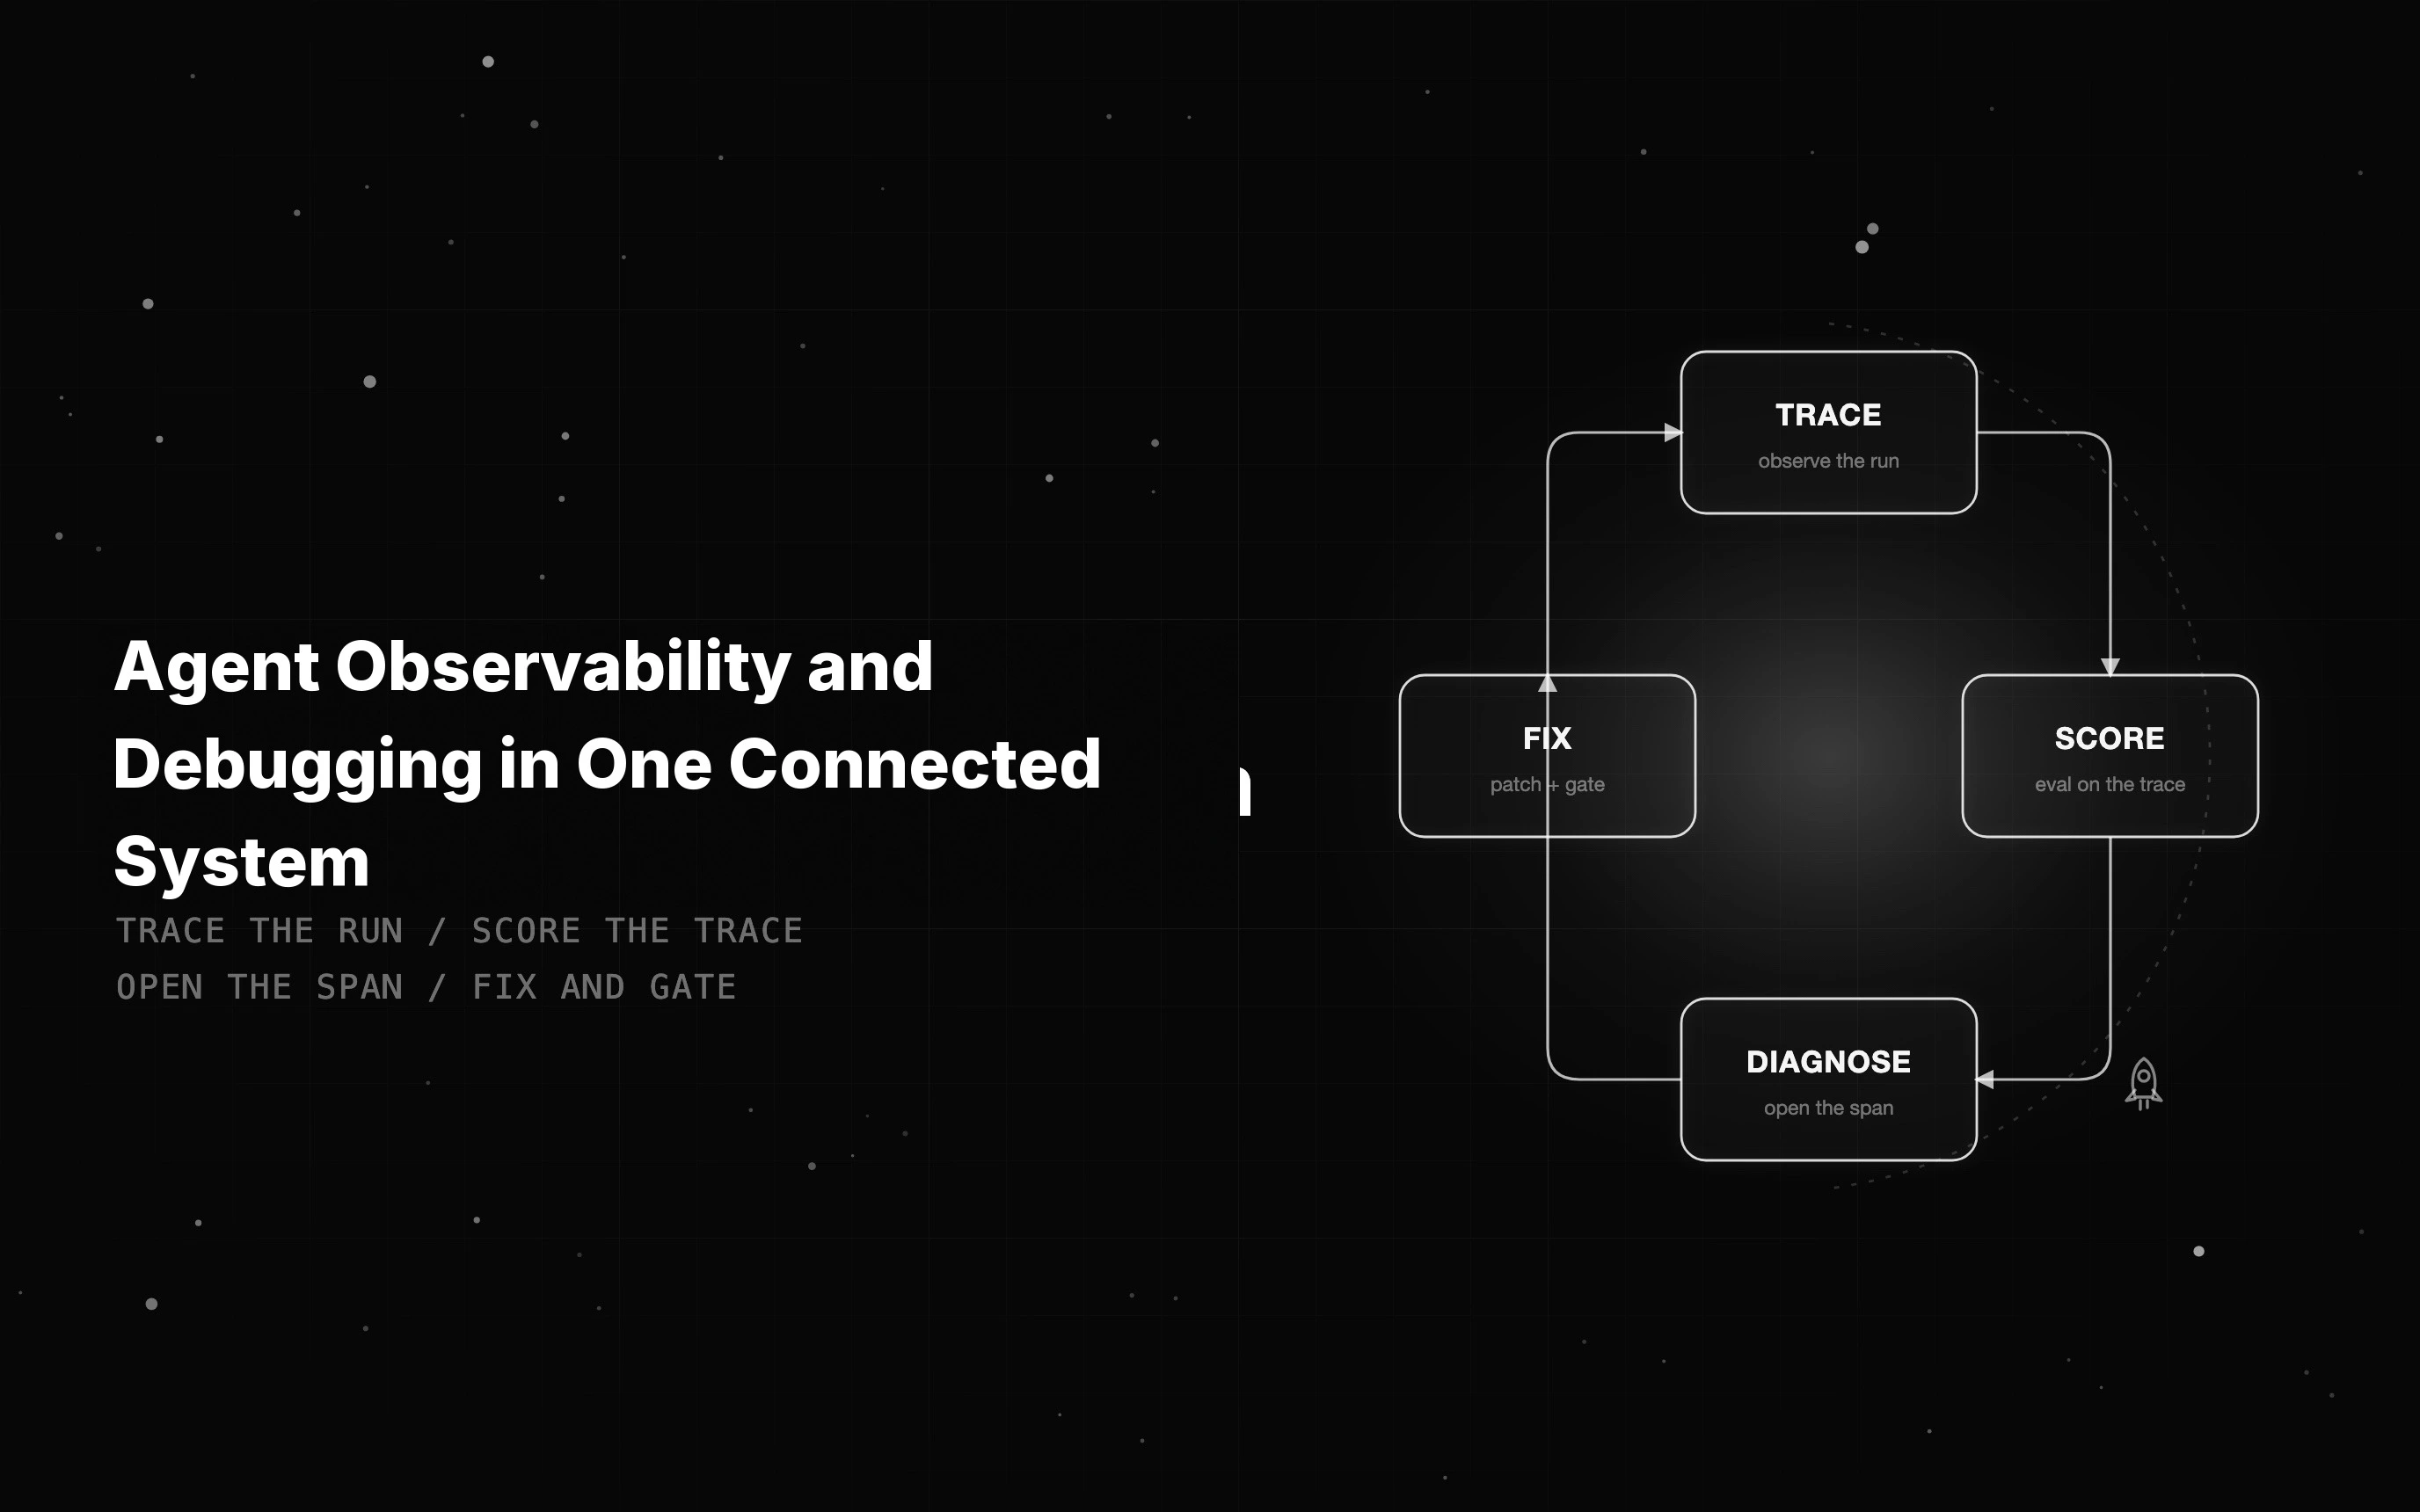
Agent observability shows what an agent did; debugging fixes it. See what to instrument and how tracing, evals, and fixes meet on one trace to close the gap.