How to Measure Voice AI Latency: The Complete 2026 Guide
Measure voice AI latency end-to-end in 2026. Per-stage budgets for STT, LLM, TTS, network. OpenInference spans, P95 SLOs, runnable traceAI code.
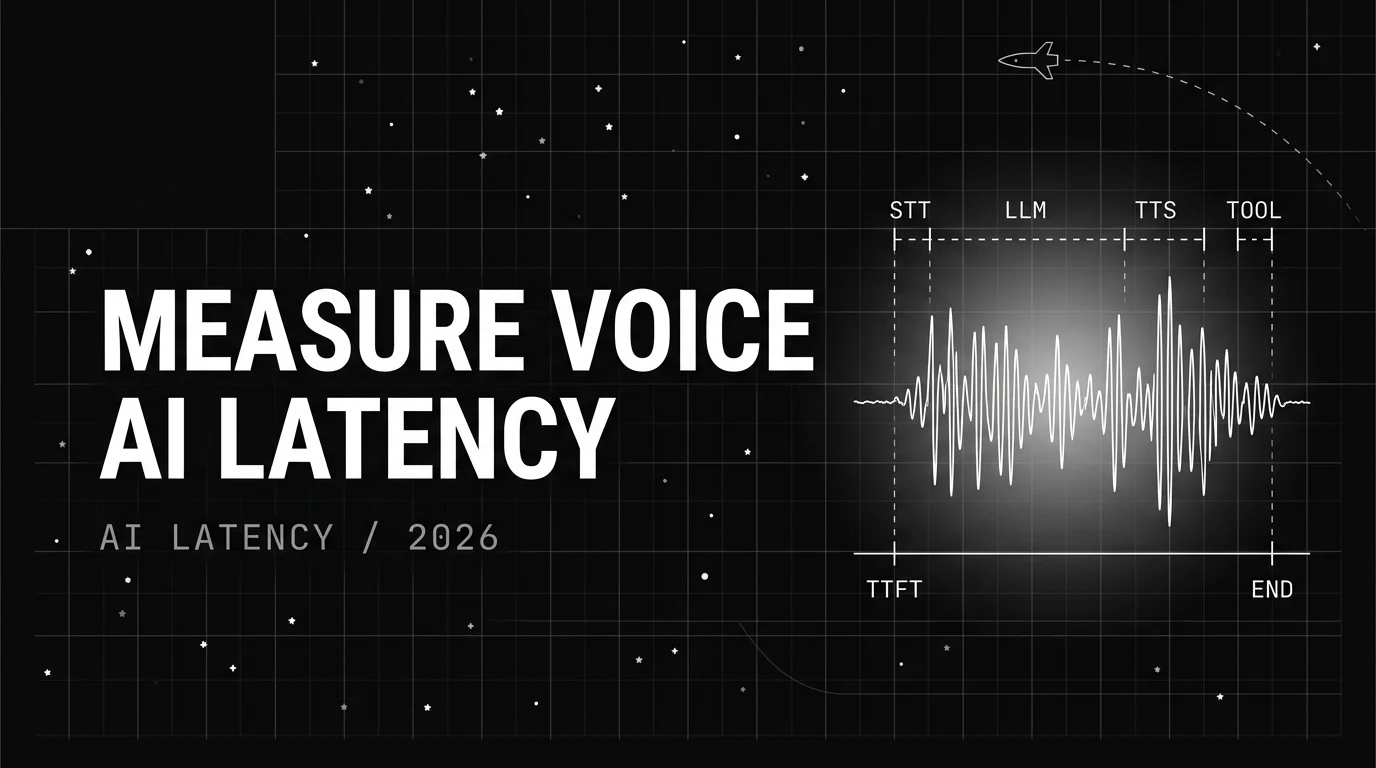
Table of Contents
How to Measure Voice AI Latency: The Complete 2026 Guide
Voice AI in 2026 lives or dies on latency. A 200ms increase on the wrong stage can materially reduce containment and hurt CSAT. Yet most teams still measure latency the way they measured a REST endpoint, with one timer around the whole call. That hides the stage that actually broke. This guide breaks the voice turn into its real stages, sets per-stage budgets, and walks through OpenInference span instrumentation with code you can run today.
TL;DR
- Decide the budget. Pick a P95 turn-latency SLO based on the use case: 500ms for sales and support, 800ms for general conversational flow, 1200-1500ms for clinical or complex tool turns.
- Decompose the budget. Allocate per stage: STT 100-300ms, LLM TTFT 200-600ms, TTS first-audio 150-400ms, network 20-100ms, orchestration 20-50ms.
- Instrument with OpenInference spans. One conversation root, one turn span per exchange, child spans for STT, LLM, TTS, tool calls. Carry the documented Future AGI voice namespace:
gen_ai.voice.latency.transcriber_avg_ms,gen_ai.voice.latency.voice_avg_ms,gen_ai.voice.latency.turn_avg_ms,gen_ai.voice.latency.ttfb_ms,gen_ai.voice.stt.provider,gen_ai.voice.tts.provider,gen_ai.voice.tts.voice_id, plus the OpenInference standardsession.idfor the conversation. - Measure P95 and P99, never average. Average hides the hang-up tail.
- Stream everything. Partial STT, streaming LLM tokens, streaming TTS. Sequential blocking pipelines cannot hit sub-800ms.
- Alert on sustained P95 breach. Page on a 5-10 minute window, not on a single blip.
Why voice latency is harder than text latency
Text chat is forgiving. Users tolerate a 3-second pause because they see a typing indicator. Voice is not. A 600ms pause after end-of-speech reads as the agent being lost. A 1.2-second pause and the user starts talking again, which now triggers barge-in handling, which adds another 300ms.
Voice latency has four properties that text latency does not.
- It is multi-stage. Every turn pays STT, LLM, TTS, and network. A regression in any one stage shows up as a single end-to-end number unless you decomposed the spans.
- It is streamable. Streaming STT, streaming LLM tokens, and streaming TTS can run in parallel so the user hears the first word while the agent is still generating. Sequential blocking pipelines waste 400-800ms.
- It is human-perceived. The metric the user cares about is the gap between end-of-speech and first audible audio. That gap is not the sum of stage latencies if streaming is wired correctly.
- It is non-uniform. Per-stage latency drifts with provider load, geography, codec, and the prompt length. The same agent that hits 600ms P95 at 9am US can hit 1100ms P95 at 3pm EU peak.
Measure the wrong number and you tune the wrong thing.
The voice turn budget breakdown
A useful budget for a sub-800ms P95 turn:
| Stage | Budget range | What dominates |
|---|---|---|
| Network round-trip | 20-100ms | Region, edge POP, codec, jitter |
| STT first-partial | 100-300ms | Streaming model, audio chunk size, accent |
| LLM TTFT | 200-600ms | Model size, prompt length, prefix-cache hit |
| TTS first-audio | 150-400ms | Voice provider, chunk size, prosody pre-roll |
| Orchestration | 20-50ms | Framework overhead, guardrail check |
| Total worst case | ~1450ms | Why streaming is non-negotiable |
Notice the worst case exceeds 1400ms. The reason a real voice agent hits 600-800ms is that streaming runs the stages in parallel. The LLM starts generating before STT has finished. TTS starts speaking before the LLM has finished. The user-perceived gap is roughly max(STT_first_partial, LLM_TTFT) plus TTS_first_audio plus the orchestration slice. Not the sum.
That overlap is exactly what your spans need to show.
Where each stage gets pulled longer
- STT gets pulled by background noise, regional accents, and large chunk sizes. Streaming models like Deepgram Nova-3 or AssemblyAI Universal-1 ship first partials in 100-200ms. Batch STT can take 800-1500ms and is unusable for real-time voice.
- LLM TTFT gets pulled by long system prompts (every token in the prompt is processed before the first output token), no prefix cache hit, and routing to a smaller-region GPU. Provider-side prompt caching, anchored system prompts, and short conversation contexts cut TTFT by 30-60%.
- TTS first-audio gets pulled by prosody pre-roll, voice cloning quality settings, and SSML complexity. Cartesia Sonic streams first audio in 80-180ms. ElevenLabs Turbo v2.5 lands at 250-400ms. Pick the provider that fits the budget, not the one with the prettiest demo voice.
- Network gets pulled by routing through the wrong region. Run the voice gateway in the user’s region. A 90ms RTT from EU to US-East compounds across STT, LLM, and TTS calls.
- Orchestration gets pulled by synchronous guardrail checks. If your safety layer adds 200ms per turn, the budget is dead. Inline guardrails need to run in under 100ms or run async.
What to measure: real Future AGI voice span namespace
For every turn span, capture the documented Future AGI voice attribute namespace plus the OpenInference standard session.id for the conversation. These are the actual keys the traceAI voice packages and native dashboard emit:
| Attribute | What it captures |
|---|---|
session.id | OpenInference standard for the conversation/call ID. |
gen_ai.voice.stt.provider | STT provider in use (Deepgram, AssemblyAI, etc.). |
gen_ai.voice.stt.language | Detected or configured STT language. |
gen_ai.voice.tts.provider | TTS provider (Cartesia, ElevenLabs, etc.). |
gen_ai.voice.tts.voice_id | Specific voice in use for the turn. |
gen_ai.voice.latency.transcriber_avg_ms | Average STT latency across the call. |
gen_ai.voice.latency.voice_avg_ms | Average TTS latency across the call. |
gen_ai.voice.latency.turn_avg_ms | Average end-to-end turn latency. |
gen_ai.voice.latency.ttfb_ms | Time-to-first-byte for the assistant response. |
gen_ai.voice.interruptions.user_count | Times the user interrupted the assistant. |
gen_ai.voice.interruptions.assistant_count | Times the assistant interrupted the user. |
gen_ai.voice.recording.assistant_url | Downloadable assistant-only audio. |
gen_ai.voice.recording.customer_url | Downloadable customer-only audio. |
gen_ai.voice.recording.stereo_url | Stereo recording with both channels. |
Anchor the user-perceived gap by deriving end_of_speech_ts and first_audio_ts locally and emitting one rolled-up user_perceived_latency_ms on the turn span. That is the only number the user actually feels. If that is healthy but the per-stage latency attributes show STT slow, your streaming pipeline is masking the issue. That is fine, but you need to know.
How to measure: OpenInference spans with traceAI
traceAI is the Apache 2.0 instrumentation library that emits OpenInference-compatible OpenTelemetry spans. It ships 30+ documented integrations across Python + TypeScript covering OpenAI, Anthropic, LiteLLM, Vertex AI, plus dedicated voice-stack packages traceai-livekit (pip install traceai-livekit) and traceAI-pipecat (pip install traceAI-pipecat). One register call and every LLM call lands as a span. For Vapi, Retell, or LiveKit production deployments, FAGI also ships native voice observability. No SDK required, just add the provider API key + Assistant ID to a FAGI Agent Definition and call logs, separate assistant + customer audio downloads, and transcripts stream in automatically.
Step 1: Install and register
# pip install traceAI-openai ai-evaluation fi-instrumentation
import os
from fi_instrumentation import register
from fi_instrumentation.fi_types import ProjectType
from traceai_openai import OpenAIInstrumentor

os.environ["FI_API_KEY"] = "your-fi-api-key"
os.environ["FI_SECRET_KEY"] = "your-fi-secret-key"

tracer_provider = register(
    project_type=ProjectType.OBSERVE,
    project_name="voice_support_agent",
)

OpenAIInstrumentor().instrument(tracer_provider=tracer_provider)
Step 2: Open the conversation root span
from fi_instrumentation import FITracer

tracer = FITracer(tracer_provider.get_tracer(__name__))

def handle_call(call_id, user_phone, region):
    with tracer.start_as_current_span(
        "voice_conversation",
        attributes={
            "session.id": call_id,
            "user_phone_hash": hash_pii(user_phone),
            "region": region,
            "channel": "voice",
        },
    ):
        run_voice_loop(call_id)
Step 3: Time the user-perceived gap
import time

def handle_turn(turn_id):
    with tracer.start_as_current_span(
        "voice_turn",
        attributes={"turn_id": turn_id},
    ) as turn_span:
        end_of_speech_ts = time.monotonic()
        turn_span.set_attribute("end_of_speech_ts", end_of_speech_ts)

        transcript = run_stt(turn_id, turn_span)
        llm_text = run_llm(transcript, turn_span)
        first_audio_ts = run_tts(llm_text, turn_span)

        user_perceived = (first_audio_ts - end_of_speech_ts) * 1000
        turn_span.set_attribute("user_perceived_latency_ms", user_perceived)
        return user_perceived
Step 4: Capture per-stage span attributes
def run_stt(turn_id, parent_span):
    with tracer.start_as_current_span("stt") as stt_span:
        t0 = time.monotonic()
        stream = stt_provider.stream(audio_chunks(turn_id))
        first_partial_seen = False
        transcript = ""
        for partial in stream:
            if not first_partial_seen:
                stt_span.set_attribute(
                    "gen_ai.voice.latency.transcriber_avg_ms",
                    (time.monotonic() - t0) * 1000,
                )
                first_partial_seen = True
            transcript = partial.text
        stt_span.set_attribute(
            "gen_ai.voice.stt.provider", "deepgram-nova-3"
        )
        stt_span.set_attribute("gen_ai.voice.stt.language", "en-US")
        return transcript
The LLM TTFT span is emitted automatically by OpenAIInstrumentor. For TTS, wrap the provider call:
def run_tts(text, parent_span):
    with tracer.start_as_current_span("tts") as tts_span:
        t0 = time.monotonic()
        audio_stream = tts_provider.stream(text, voice_id="sonic-female")
        first_audio_ts = None
        for chunk in audio_stream:
            if first_audio_ts is None:
                first_audio_ts = time.monotonic()
                tts_span.set_attribute(
                    "gen_ai.voice.latency.ttfb_ms",
                    (first_audio_ts - t0) * 1000,
                )
            send_to_user(chunk)
        tts_span.set_attribute("gen_ai.voice.tts.provider", "cartesia")
        tts_span.set_attribute(
            "gen_ai.voice.tts.voice_id", "sonic-female"
        )
        return first_audio_ts
That is the full instrumentation surface. Every span lands in the Agent Command Center or any OpenTelemetry backend you point traceAI at.
What good looks like: SLOs and how to set them
The right SLO depends on the use case. Use these as starting points.
| Use case | P95 user-perceived | P99 user-perceived | Why |
|---|---|---|---|
| Sales outbound | 400-500ms | 700ms | Hesitation reads as deflection. Tight budget. |
| Support inbound | 500-700ms | 900ms | Users are already frustrated, latency compounds it. |
| Receptionist | 600-800ms | 1100ms | Natural conversational flow is the goal. |
| Clinical intake | 1000-1500ms | 2000ms | Users expect the agent to think. Tool-heavy turns. |
| IVR replacement | 700-1000ms | 1400ms | Better than the old IVR is the bar. |
Alert on sustained P95 breach over a 5-10 minute window. Single-blip alerts get muted within a week. Sustained breach alerts get acted on.
For per-stage SLOs in a sub-800ms target:
- STT first-partial P95 under 300ms.
- LLM TTFT P95 under 500ms.
- TTS first-audio P95 under 300ms.
- Tool-call P95 under 400ms (for turns that hit tools).
- Network RTT P95 under 100ms.
If any single stage breaches its SLO, you have a stage to investigate. The user-perceived metric tells you if the user actually feels it.
Network and codec measurement
Network latency is the cheapest stage to over-spend on and the easiest to fix once you measure it. Capture five attributes per turn.
network_rtt_ms: round-trip from voice gateway to user device.jitter_ms: variance in inter-packet arrival.packet_loss_pct: percentage of packets that did not arrive.codec: Opus, PCMU, PCMA, G722.edge_pop: the POP the user connected through.
A user in Singapore connecting to a US-East voice gateway pays roughly 180-220ms RTT one-way. Each STT, LLM, and TTS round-trip multiplies that. The fix is regional gateways pinned per user region, not raw compute optimization.
def attach_network_metrics(turn_span, rtc_session):
    stats = rtc_session.get_stats()
    turn_span.set_attribute("network_rtt_ms", stats.rtt_ms)
    turn_span.set_attribute("jitter_ms", stats.jitter_ms)
    turn_span.set_attribute("packet_loss_pct", stats.loss_pct)
    turn_span.set_attribute("codec", stats.codec)
    turn_span.set_attribute("edge_pop", stats.pop_id)
Jitter above 30ms and packet loss above 1% will degrade STT quality before they degrade latency. Both show up in the WER scoring on the LLM input. Track them as span attributes and correlate with intent confidence.
Tool-call latency inside the turn budget
Tool calls are the most variable stage. A simple cached lookup runs in 20-50ms. A database query against a remote region runs in 200-600ms. An external API call to a third-party service can run anywhere from 100ms to 2000ms.
Capture three attributes per tool span.
tool_name: the name of the tool called.tool_call_ms: total time spent in the tool call.tool_call_outcome:success,error,timeout.
def call_tool(tool_name, args, parent_span):
    with tracer.start_as_current_span("tool_call") as tool_span:
        tool_span.set_attribute("tool_name", tool_name)
        t0 = time.monotonic()
        try:
            result = tool_registry[tool_name].invoke(args, timeout=0.4)
            tool_span.set_attribute("tool_call_outcome", "success")
        except TimeoutError:
            result = None
            tool_span.set_attribute("tool_call_outcome", "timeout")
        finally:
            tool_span.set_attribute(
                "tool_call_ms", (time.monotonic() - t0) * 1000
            )
        return result
Hard-timeout tools at the budget remaining in the turn. If a tool exceeds the budget, return a graceful “let me get back to you on that” rather than waiting and breaking the 800ms P95.
Capturing latency on the client side
Server-side spans miss the last-mile delay between when the first audio packet leaves the voice gateway and when the user actually hears it. That gap is 30-150ms depending on the client buffer and the device audio stack.
Capture a client-side client_first_audio_played_ms attribute and ship it back to the server in the next user-turn payload. The end-to-end perceived gap is then client_first_audio_played_ts - end_of_speech_ts.
For WebRTC clients, the WebRTC stats API exposes audioOutputLevel and jitterBufferDelay. For SIP and telephony, the RTCP receiver reports carry the timing. Both are span attributes on the turn span.
How to find the slow stage when the budget breaks
Pull spans for the slowest 5% of turns. Look at the per-stage attributes. Three patterns dominate.
Pattern 1: STT first-partial spike. Usually a regional accent shift, a noisy line, or a chunk-size misconfiguration. Fix by switching to a smaller STT chunk size (100-200ms instead of 500ms) and running noise suppression upstream.
Pattern 2: LLM TTFT spike. Usually a long system prompt, no prefix cache hit, or routing to a cold provider region. Fix by anchoring the system prompt for prompt-cache hits, shortening the conversation history, and pinning the provider region.
Pattern 3: TTS first-audio spike. Usually voice prosody pre-roll on a complex voice, SSML overhead, or provider load. Fix by switching to a streaming-first TTS provider, dropping SSML complexity, and pre-warming the connection.
The pattern is visible in the span data. Without per-stage spans you guess and tune the wrong thing.
Guardrails inside a sub-500ms budget
Inline guardrails are the single biggest hidden-latency source. A safety API that adds 200ms per turn breaks any sub-500ms budget. The Future AGI Protect model family runs sub-100ms inline per arXiv 2510.13351. That fits inside the orchestration slice. ProtectFlash gives a single-call binary classifier path for the absolute lowest-latency surface when you can’t afford rule-based scan time.
Protect is built on Gemma 3n foundation with LoRA-trained adapters across 4 safety dimensions (Content Moderation, Bias Detection, Security, Data Privacy Compliance). It is multi-modal across text, image, and audio in a single model family. The same model family is reusable as evaluation metrics for offline batch scoring, so production policy and evaluation rubric stay in sync.
For voice specifically, that means PII redaction, prompt-injection detection, and content moderation run inline without a second round-trip to a closed safety API. You stay inside the budget.
Eval gating: decide which routes need inline scoring
Evaluation is the other latency trap. A 200ms LLM judge inside a 500ms turn breaks the budget. ai-evaluation supports per-route eval gating that decides which routes run inline, which run async, and which run both.
The pattern:
- High-stakes turns (payment, medical advice, legal): run inline guardrail with Protect, run async LLM judge for nuanced quality.
- Standard turns: run async evaluation only. In-house classifier models are tuned for the LLM-as-judge cost/latency tradeoff, so async stays affordable at millions of turns per day.
- Low-stakes turns (greeting, hold confirmation): run sampled async evaluation, maybe 1 in 50.
The ai-evaluation library ships 70+ built-in eval templates including the voice-specific audio_transcription, audio_quality, conversation_coherence, conversation_resolution, task_completion, plus unlimited custom evaluators authored by an in-product agent that reads your code and conversation traces. Async evaluation scores join back to the originating turn span, with documented SDK constants gen_ai.evaluation.name, gen_ai.evaluation.score.value, and gen_ai.evaluation.explanation carrying the result. The platform trace-drawer additionally surfaces score-label and span-link fields when configured. Custom evaluators can be authored in-product, and evaluations can be configured and re-run through the programmatic eval API as traffic flows. For audio inputs, MLLMAudio supports .mp3, .wav, .ogg, .m4a, .aac, .flac, and .wma, so latency/debug datasets can include raw call audio. It is Apache 2.0.
Latency dashboards that engineers actually use
Three dashboards are worth building. Everything else is noise.
Dashboard 1: user-perceived P95 by route. One time series chart. X-axis is time. Y-axis is user_perceived_latency_ms P95 grouped by route or intent. Annotate deploy markers. A regression jumps out within minutes of the deploy that caused it.
Dashboard 2: per-stage latency stacked bar. One panel per stage (network, STT, LLM, TTS, tool, orchestration). Stacked over the same time window. The stage that grew jumps out. The stage that did not change is ignored.
Dashboard 3: tail by region and provider. A scatter plot or heatmap. X-axis is region. Y-axis is user-perceived P99. Each point is a provider configuration. The misrouted region or the broken provider jumps out.
Skip the dashboard for average latency. Average is a vanity metric for voice. The dashboards above answer the only three questions worth asking: did it regress, where, and why.
Synthetic latency probes
Production traces tell you what happened. Synthetic probes tell you what will happen. Run a probe agent against each region every 60 seconds. Capture the same span attributes as a real call: end-of-speech, first-audio, per-stage timings.
def run_latency_probe(region):
    with tracer.start_as_current_span(
        "voice_probe",
        attributes={"region": region, "probe": True},
    ) as probe_span:
        audio = synthetic_audio_clip("can you confirm my balance")
        result = handle_call("probe-" + region, "probe-phone", region)
        probe_span.set_attribute("probe_outcome", "ok" if result else "fail")
Alert on probe failures. A 5-second sustained probe outage in a region is a customer-visible incident. The probe catches it before the customers do.
Combine the probe with synthetic accent and language variations so you also catch accent-driven STT regressions. The probe pays for itself the first time it catches a provider region outage.
Streaming everything: where the 400-800ms savings live
A sequential pipeline that waits for STT final, then waits for LLM final, then waits for TTS final, hits 1400-1800ms on every turn. Nobody ships that in 2026. The savings:
- Streaming STT first-partial. Feed the LLM the partial transcript while the user is still speaking. Reject the LLM call if the final transcript differs significantly. Net savings: 200-400ms.
- Streaming LLM tokens. Pipe tokens into TTS the moment the first sentence boundary lands. Net savings: 200-500ms.
- Streaming TTS. Start playing audio while the LLM is still generating later tokens. Net savings: 100-300ms.
- Tool prefetch. If the user’s intent is high-confidence after the first partial, fire the tool call in parallel with the LLM call. Cancel if intent changed. Net savings: 200-400ms.
The combined effect can drop a 1500ms sequential turn to 600-700ms. The instrumentation has to capture both the per-stage time and the overlap to attribute the savings correctly. Span timestamps do that natively.
Future AGI for voice latency
traceAI auto-instruments any voice stack. OpenInference spans for ASR, LLM, TTS, and tool calls land in one trace per conversation. 30+ documented integrations across Python + TypeScript including dedicated traceAI-pipecat and traceai-livekit packages, and the Apache 2.0 license means no vendor lock on the instrumentation layer. For Vapi, Retell, and LiveKit, native dashboard-driven voice observability skips the SDK entirely.
ai-evaluation ships 70+ built-in eval templates plus an in-product agent that authors unlimited custom evaluators against your own code and traces. In-house classifier models are tuned for the LLM-as-judge cost/latency tradeoff on continuous evaluation. Per-route eval gating keeps evaluation off the critical path so a 200ms judge never breaks a 500ms turn. Configure + re-run evals via the programmatic eval API.
The Future AGI Protect model family delivers sub-100ms inline guardrails per arXiv 2510.13351, multi-modal across text, image, and audio, on Gemma 3n with LoRA-trained safety adapters. ProtectFlash gives a single-call binary classifier path. Either fits a sub-500ms budget without a second safety API round-trip.
Error Feed is the clustering and what-to-fix layer over your traces and evals. It zero-config auto-clusters trace failures into named issues with auto-written root cause, quick fix, and long-term recommendation. Latency outliers show up as named issues, not as 10,000 raw traces.
The Agent Command Center hosts the whole stack with RBAC, SOC 2 Type II, HIPAA, GDPR, CCPA, and ISO 27001 certifications per the trust page. AWS Marketplace and multi-region hosting cover the deployment surface.
Related reading
- How to Implement Voice AI Observability in 2026
- How to Optimize Voice Agent Latency: 12 Techniques That Work in 2026
- Sub-500ms Voice AI: The Complete Latency Budget Guide for 2026
- Audio Caching for Voice AI: A Developer’s Guide to Latency Reduction in 2026
Sources and references
- OpenInference specification: github.com/Arize-ai/openinference
- Future AGI Protect benchmarks: arXiv 2510.13351
- Future AGI trust and compliance: futureagi.com/trust
- OpenTelemetry tracing spec: opentelemetry.io
- Streaming TTS benchmarks: Cartesia Sonic and ElevenLabs Turbo v2.5 vendor docs
- Streaming STT benchmarks: Deepgram Nova-3 and AssemblyAI Universal-1 vendor docs
Frequently asked questions
What is a good end-to-end latency target for voice AI in 2026?
What should the voice AI latency budget look like per stage?
What is TTFT in voice AI and why does it matter more than total latency?
How do I measure voice AI latency end-to-end with OpenInference?
Why should I alert on P95 rather than average voice latency?
How does Future AGI Protect fit a sub-500ms voice latency budget?
Should evaluation block the voice turn or run async?

Walkthrough of a voice agent analytics dashboard: per-call drawer with 5 panels, SLO grid with 3 tiers, span/eval/tag flow, production-to-sim closed loop.

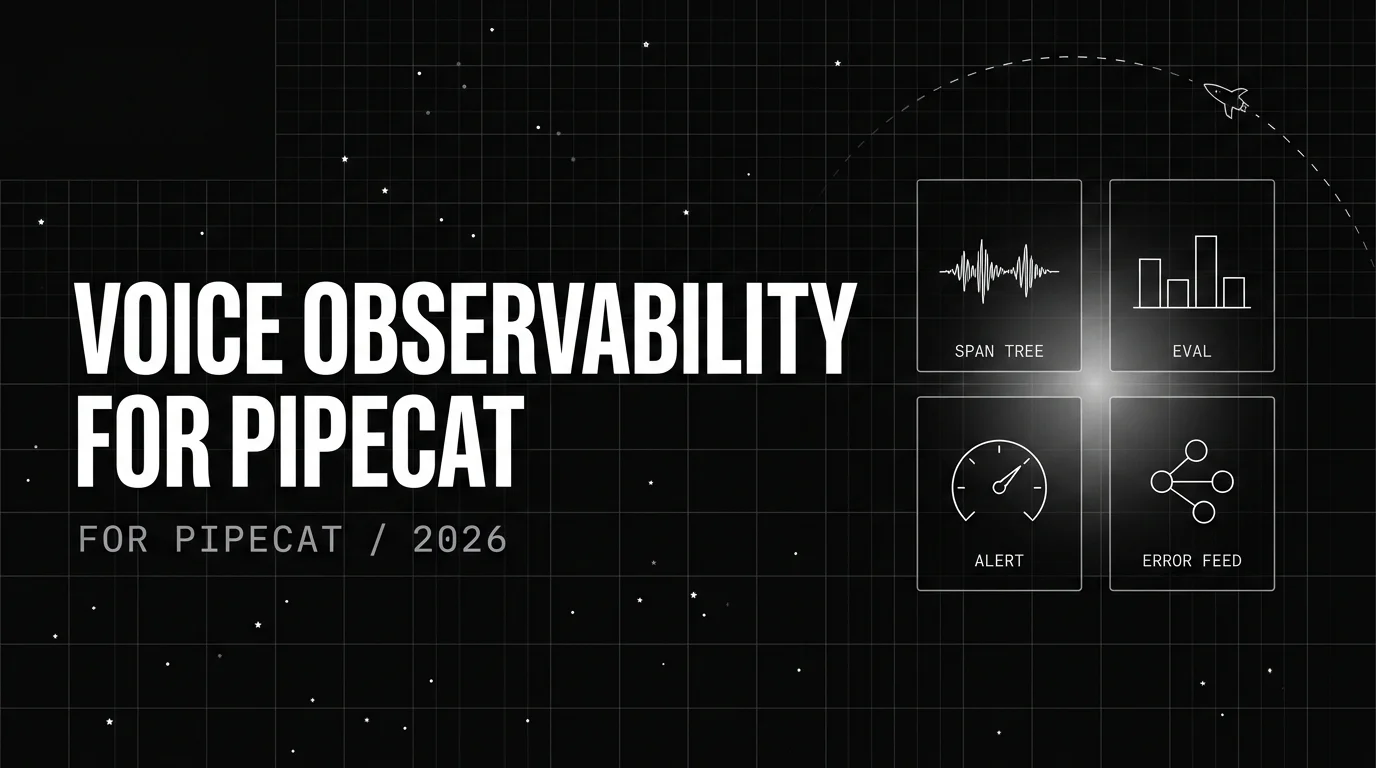
Implement voice observability for Pipecat with traceAI-pipecat: install, register, enable HTTP attribute mapping, attach audio + multi-turn eval rubrics.
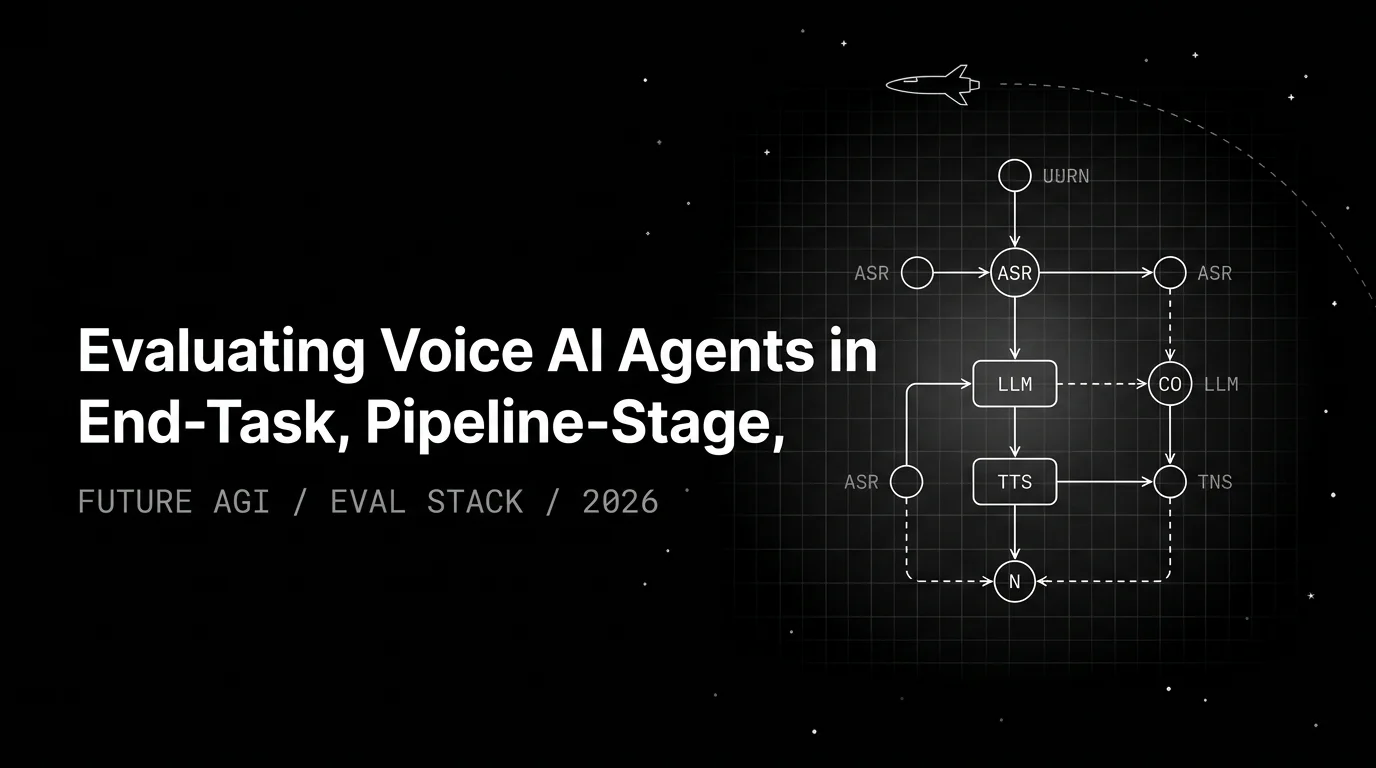
Voice agent eval is end-task scoring plus pipeline-stage attribution plus conversation coherence. WER scores the ASR component, not the agent.